

Abstract
Introduction
We sought to determine the time and vaccinia virus dose combination that would maximize the number of acute immune response changes in response to vaccinia stimulation in preparation for a large gene expression microarray experiment.
Methods
PBMCs from ten subjects were exposed to five vaccinia virus doses for three lengths of time. Gene expression was measured for 90 immune response genes via Taqman® Low Density Immune Arrays. Expression data were normalized via model-based non-linear normalization. Linear mixed effects model results were used to standardize changes across genes and determine the time/multiplicity of infection (MOI) combination with the largest number of changes.
Results
The greatest number of changes occurred with a MOI of 5.0 and exposure time of 48 hours. Further inspection revealed that most changes had occurred earlier and faded at this combination. The second highest number of changes was found at a MOI of 0.5 PFU/cell and time of 18 hours.
Conclusions
We conclude a time of 18 hours with a MOI of 0.5 PFU/cell is the optimal time/MOI combination for the full scale gene expression study. The strategy described herein is a general and resource efficient way to make critical decisions regarding experimental parameters for studies utilizing expensive assays that interrogate a large number of variables.
Keywords: Smallpox, Microarray, TLDA, vaccinia virus
1.0 Introduction
Microarray technologies have revolutionized our approach to biomedical and clinical research beyond the imaginable. This powerful and high-throughput genomic tool allows us to assay RNA transcript levels of thousands of genes in a single experiment (Dhiman et al., 2002;Morley et al., 2004;Watson et al., 2000). Microarray approaches are now being used to compare inter-individual genomic profiles, better known as “transcriptional signatures” to determine variations in genetic constitution and regulation that may result in differences in disease prognosis or treatment, drug or vaccine responses and susceptibility to infectious agents (Albertson and Pinkel, 2003;Esteves et al., 2007;Trevino et al., 2007;Neuman, V and Robinson, 2004;Maynard et al., 2007). With the sophistication of hybridization and computational methods to analyze the vast data sets generated by microarrays, they are fast becoming successful, mature and reliable genomic tools for personalized medicine (Heidecker and Hare, 2007;Baron et al., 2007;Jain, 2005).
Smallpox is an ancient human disease; however, we have little fundamental knowledge about the immunogenetics of immune responses to either vaccination or disease aided by use of modern tools such as microarrays. Recent in vivo gene expression studies on primate models using high titer infection (up to 109 plaque forming units) have successfully identified some immune function gene families and pathways responsible for effective host response to smallpox (Rubins et al., 2004;Esteves et al., 2007;Valdivia-Granda et al., 2007). Similarly, in vitro studies with vaccinia virus using high multiplicity of infection (MOI) [up to MOI of 10 (plaque forming units)PFU/cell] to infect human cell lines and monocyte-derived dendritic cells have identified differentially expressed discrete gene clusters of immune response genes between 2-16 hours post infection (Guerra et al., 2007;Grinde et al., 2007;Assarsson et al., 2008;Guerra et al., 2004;Guerra et al., 2003). A smallpox vaccine response study conducted by Scherer et al interrogated gene expression profiles in response to the Aventis-Pasteur Wetvax® vaccine by sampling blood at various time points from 2-60 days post vaccination (Scherer et al., 2007). Population-based studies to profile differential gene expression in response to smallpox vaccination have not been reported.
The success of a microarray experiment depends heavily on intelligent design, stringent controls and replicates, and robust statistical procedures. Otherwise, due to the multiplicity of assays involved, noise or mere chance findings instead of real biological truths may result. Although advances have been made in terms of tools for data mining and analysis, the corresponding design and optimization approaches have not received careful consideration within the microarray community. We have designed a population-based gene expression study to profile overall and gender and race-specific inter-individual differences in immune responses to smallpox vaccination. In order to determine the optimal time point and dose of vaccinia virus to stimulate PBMC in vitro, we propose the use of Taqman® low density immune arrays (TLDA). These are micro fluidic cards designed to quantitate gene expression of immune response genes such as cytokines and their receptors, HLA genes, chemokines, growth factors, immune regulators, apoptosis markers, and others, including classic house keeping markers. To our knowledge, TLDA has not been used for a microarray optimization study and we demonstrate the utility of using TLDA as a methodological way to choose a combination of optimal time point and stimulation dose where maximal acute changes in gene expression occur.
2.0 Methods
2.1 Study subjects
We enrolled 1,076 healthy subjects (ages 18-40 years) as a part of a large, population-based study designed to elucidate genetic determinants associated with heterogeneity in immune response after smallpox vaccination. All subjects had received a single dose of US-licensed Dryvax® smallpox vaccine between one to 48 months prior to blood draw. Subjects with an underlying immunocompromising condition, suspected exposure to smallpox, previous participation in an experimental trial involving an unlicensed smallpox vaccine, and with a documented “no take” to the vaccine did not meet the inclusion criteria for the study. The study was approved by the Mayo Clinic Institutional Review Board. We obtained written informed consent and obtained peripheral blood samples by venipuncture from each subject.
For the TLDA optimization study, we selected 10 subjects from the high and low extremes of the immune response spectrum based on vaccinia-specific neutralizing antibody titers and IFNγ-producing cells as measured by ELISPOT as detailed below.
2.2 Vaccinia Virus
The New York City Board of Health (NYCBOH) vaccine strain of vaccinia virus was obtained from ATCC (Manassas, VA) and was grown and titrated as described previously (Ryan et al., 2009). Briefly, susceptible HeLa S3 (ATCC) cells were infected with NYCBOH vaccinia virus for two to three days at a MOI of 0.05 PFU/cell and the vaccinia virus was purified according to the protocol described previously (Earl et al., 2001b). Infected cells were centrifuged at 500 × g for 10 minutes at 4°C, reconstituted in 10mM Tris-Cl (Sigma, St. Louis, MO), pH 9.0, and sonicated for three cycles of 20 seconds each. Vaccinia virus containing supernatants were layered on 36% sucrose (Sigma) and ultracentrifuged at 33,000 × g for 80 minutes at 4°C. The pellet containing virus was resuspended in 1mM Tris-Cl, pH 9.0, resonicated as described above and titered.
The vaccinia virus was titered using a standard plaque assay on confluent monolayers of Vero cells (ATCC) according to previously established protocols (Earl et al., 2001a;Newman et al., 2003). The titered vaccinia virus stock was adjusted to 1×10⁸ PFU/mL with 1X Hank’s balanced salt solution (HBSS, Mediatech Inc., Manassas, VA) containing 0.1% bovine serum albumin (BSA, Sigma) and incubated with 5 μg/ml Psoralen (Sigma) for 10 minutes at room temperature. Following incubation, the viral mixture was UV-irradiated for 60 seconds at 365 nm in a UV crosslinker (Spectrolinker™, Spectronics Corporation, Westbury, NY) and aliquoted and stored at -80°C until further use. A single stock of vaccinia virus was used for the entire study to eliminate potential batch-to batch variation.
2.3 Neutralization Antibodies
Vaccinia- specific neutralization antibodies were measured by neutralization assay based on a recombinant vaccinia virus strain expressing the β-galactosidase reporter gene as described previously (Manischewitz et al., 2003;Kennedy et al., 2009). Briefly, serial dilutions of heat-inactivated serum samples from individual subjects were coincubated with equal amounts of β-galactosidase expressing vaccinia virus stock (vSC56, kindly provided by B. Moss, NIAID) for 1 hour at 37°C. This serum/virus mixture was then added to HeLa cells plated at a concentration of 1 × 10⁵ cells per well in EMEM+10% fetal calf serum (FCS, Hyclone, Logan, UT) in 96-round bottom plates, and incubated for 16-18 hours in replicates of five per dilution. The next day all cultures were lysed using 4% IGEPAL CA630 (Sigma) in EMEM/10% FCS at 37°C for 1 hr. 10 μl of lysate was transferred to 96 well Immulon-2 plates (Dynatech, Alexandria, VA). The β-galactosidase activity was measured using CPRG (chlorophenolred-ß-D-galactopyranoside; Roche Diagnostics, Indianapolis, IN) as a substrate and absorbance was read at 575nm. Vaccinia Immune Globulin (VIG) was obtained from C. Anderson (CBER/FDA) and used as a positive control. Negative controls contained virus and assay medium only. Assay results are reported as the serum dilution inhibiting 50% of viral activity (ID50). A minimum of three separate assays were performed on each subject and the reported results are the average ID50 values.
2.4 Isolation, cryopreservation and thawing of PBMC
Our detailed protocol for PBMC isolation, cryopreservation and thawing has been previously described in detail (Ryan et al., 2009). Briefly, PBMC were isolated using density gradient centrifugation using Accuspin tubes (Sigma) containing HISTOPAQUE®-1077 (Sigma) from 100 mL of heparinized blood collected from each subject. PBMC were washed with 1X PBS (Mediatech Inc.,) and were resuspended in RPMI 1640 culture media containing L-Glutamine (Invitrogen, Carlsbad, CA) containing 10% dimethyl sulfoxide (Protide Pharmaceuticals, St. Paul, MN) and 20% FCS at a concentration of 1×10⁷ cells/mL. PBMC were frozen overnight at -80°C in a controlled-rate freezer, and then transferred to liquid nitrogen for storage until further use.
PBMC were thawed by a rapid thawing method that we have previously described (Ovsyannikova et al., 2005a;Ovsyannikova et al., 2005b). The cell pellet was washed and resuspended at a concentration of 2×10⁶ cells/mL in RPMI 1640 culture media containing L-glutamine (Invitrogen) supplemented with 5% FCS (Hyclone), 100 U/mL penicillin (Sigma), 100 μg/mL streptomycin (Sigma), and 1mM sodium pyruvate (Mediatech). PBMC were cultured for 18 hours at 37°C at a concentration of 4×10⁶ cells/well in 24 well plates in the presence of 50 IU/mL of IL-2 (Proleukin®, Chiron, Emeryville, CA). Following resting, the adherent cells were detached by trypsinization (0.25% Trypsin-EDTA, Invitrogen) for 10 minutes at 37°C. PBMC were washed and resuspended in 5% FCS containing RPMI 1640 media and cell numbers and viability were checked using Trypan blue exclusion test.
2.5 IFN-γ ELISPOT
IFN-γ ELISPOT assays were performed using commercially available kits (R&D Systems, Minneapolis, MN) according to the manufacturer’s instructions. Briefly, rested PBMC at a concentration of 4×10⁶/mL (50μL/well) were plated on precoated ELISPOT plates. PBMC were stimulated in triplicate with and without UV-inactivated vaccinia virus (MOI 5 PFU/cell) diluted in RPMI 1640 culture media containing 5% FCS (Hyclone), 100 U/mL penicillin (Sigma), 100 μg/mL streptomycin (Sigma), and 1mM sodium pyruvate (Mediatech) for 24 hours. One well of PBMC from each subject was stimulated with 5 μg/mL PHA (Sigma) as a positive control. The plate was incubated for 2 hrs with Streptavidin-AP conjugate and the reaction was developed using BCIP/NBT chromogen. Plates were dried, scanned and analyzed using an automated Immunospot® S4 Pro Analyzer (Cellular Technology Ltd., Cleveland, OH).
2.6 TLDA assays
Rested PBMC at a concentration of 4×10⁵/mL (500 μl/well) were plated in duplicate on 6 well tissue culture plates (Becton, Dickinson & Co., Franklin Lakes, NJ) with UV-inactivated vaccinia virus (MOI 0.5, 1 and 5 PFU/cell) diluted in RPMI 1640 culture media containing 5% FCS (Hyclone), 100 U/mL penicillin (Sigma), 100 μg/mL streptomycin (Sigma), and 1mM sodium pyruvate (Mediatech) for 12, 18, 24, 36 and 48 hours in a CO2 incubator at 37°C. PBMC with media alone served as zero time-point controls. After specified time points, the cells were stabilized using RNAprotect cell reagent (Qiagen, Valencia, CA). Total RNA was extracted according to the manufacturer’s instructions using the RNeasy Protect Cell Mini kit (Qiagen).
Gene expression was profiled according to the manufacturer’s instructions provided by commercially available TaqMan® Human Immune Array representing 90 immune function genes and 6 house keeping genes on a 384-plex genecard (Applied Biosystems, Carlsbad, CA). First, cDNA samples were prepared from total RNA samples using the High Capacity cDNA Reverse Transcription kit (Applied Biosystems). 100 μl of cDNA from each sample was mixed with an equal volume of TaqMan Universal PCR Master Mix (Applied Biosystems), centrifuged, and loaded on the port on a TLDA card (Applied Biosystems). The genecard was sealed and PCR amplification was performed for 40 cycles of 2 minutes at 50°C, 10 minutes at 94.5°C, 30 seconds at 97°C and 1 minute at 59.7°C using an ABI Prism 7900HT sequence detection system (Applied Biosystems).
2.7 Study Design
Changes in immune response gene expression from a time of 0 hours and MOI of 0 (control) were investigated for five time points (12, 18, 24, 36, 48 hrs) and three MOI levels (0.5, 1.0, 5.0 PFU/cell) in a full factorial fashion for a total of 15 time/MOI treatment combinations for each of ten subjects. As each TLDA plate accommodates four specimens, one well was used for the control and the remaining three wells for three of the 15 time/MOI combinations of interest. All four specimens on a given plate were from the same subject. Thus, expression values were planned for each patient at 15 time/MOI combinations and five replicates of the time=0/MOI=0 combination. Run order for the time/MOI combinations were randomized so that run date would not be confounded with treatment combination.
2.8 Secreted cytokine measurements by ELISAs
The levels of vaccinia virus-specific IL-1β, IL-2, IL-4, IL-6, IL-10, IL-12p40, TNF-α, and IFN-γ (all from BD Pharmingen, San Diego, CA) and IL-18 (MBL International, Woburn, MA) were measured in cell free PBMC culture supernatants by ELISA following the manufacturer’s protocol at pre-optimized conditions described in detail previously (Ryan et al., 2009;Dhiman et al., 2004).
3.0 Statistical methods/analysis
The goal of this study was to estimate the time/MOI combination that maximized the acute change in expression from baseline in response to vaccinia stimulation for the most genes possible. The primary endpoint was the ΔCT value which is defined as the CT value (which ranges from 0 to 40 cycles) for the gene minus the CT value for the endogenous control (18S) for each well. All analyses were performed on the log base-2 scale where expression changes are considered additive.
Per specimen modified MVA plots (Eckel et al., 2005), similar to Bland-Altman plots(Bland and Altman, 1986), were used to assess the existence and functional form of biases. Biases were seen between plates and specimens, and these biases were a function of abundance indicating the need for nonlinear normalization. Thus, a nonlinear model-based normalization allowing incorporation of pertinent experimental effects was used to normalize the data. The normalization model was a semiparametric model of the form ΔCT = μ + f(μ) + ε where ΔCT represents the un-normalized value defined above, μ represents the true mRNA signal for each gene, f(μ) represents a nonlinear bias function and ε represents random error. Due to the fact that the panel consisted of immune response genes and we expected to see changes in response to vaccinia in the majority of these genes, the data were normalized within time/MOI combinations. This was accomplished by setting μ = geneg + (time*moi)tm + (gene*time*moi)gtm where geneg is a categorical variable representing the gth gene, (time*moi)tm is a categorical variable representing the time by MOI levels (the interaction) and (gene*time*moi)gtm represents the interaction between the gene and time/MOI levels. Thus, this is a model to estimate the gene means within time/MOI combination. A per-specimen nonlinear bias curve was accommodated via the nonparametric function fmps(μ) representing the mth MOI on the pth plate for the sth subject. Estimation of the parametric and nonparametric portions is accomplished in an iterative fashion. In concept, this normalization algorithm amounts to the following steps: 1) create per-specimen modified MVA plots with residuals from the parametric model on the vertical axis versus the predicted value on the horizontal axis, 2) fit a nonlinear smooth to this plot to estimate the bias function fmps(μ), and 3) subtract the estimated bias from the original data. If the data are completely normalized, the smoother would lie on the horizontal y=0 line of this plot. A comprehensive discussion of the model building and estimation processes has been published (Eckel et al., 2005).
A linear mixed effects model was then fit for each gene with the normalized log base-2 ΔCT values as the dependent variable, and time, MOI and the time-by-MOI interaction as the independent variables. Subject was included as a random effect in order to account for correlation between observations on the same subject. Estimates of the negative average difference for each gene at each time and MOI combination relative to the control were computed from this model. This estimate, , where g indicates gene, t indicates time and m indicates MOI, corresponds to the average -ΔΔCT value and can be interpreted as the average fold change from control on the log base-2 scale. A standardized Z-score was then calculated for each gene at each time/MOI combination by subtracting the overall gene specific mean and then dividing by the model based standard error in order to place all genes on a common scale, i.e., where • indicates summation over the corresponding subscript.
The absolute value of the Z-score was used in order to determine the time/MOI combination with large changes in the most genes since up- and down-regulation were of equal interest. First, the time/MOI value corresponding to the maximum absolute value Z-score was determined for each gene and the number of genes for which each time/MOI combination had the maximum score was tabulated. In addition, the absolute Z-scores were summed over all genes within each time/MOI combination to determine the time/MOI combination with the largest sum.
Finally, we tallied those time/MOI combinations with the maximum change plus those that were “close seconds,” where “close second” was defined to be overlapping ± one standard error intervals. To do this, the gene specific mean ± standard error points were Z-transformed as . The time/MOI combinations for which these intervals overlap the maximal change interval were tallied over all genes within each time/MOI combination.
Association of gene expression measured by TLDA and cytokine secretion measured by ELISA was assessed via Spearman’s correlation.
4.0 Results
4.1 Subjects
The ten subjects were chosen such that five had high immune response and five had low immune response according to both the vaccinia-specific neutralization antibody and IFN-γ ELISPOT assays. For the low responders, the median number of IFN-γ secreting cells was 11 (range -1 to 28) and median neutralization antibody ID50 was 47.43 (range 34.9 to 28). For the high responders, the median number of IFN-γ secreting cells was 127 (range 95 to 219) and median neutralization antibody ID50 was 331.8 (range 171.1 to 481.9). Nine subjects were male and 1 was female and the ten subjects had an average age of 23.4 yrs (range 19 to 32 yrs). One subject reported a race of Black or African-American, 8 reported White, and 1 reported Other. One subject reported being Hispanic or Latino and the remaining nine subjects reported being Not Hispanic or Latino.
4.2 TLDA Results
Pre- and post-normalization box and whisker plots are shown in Figure 1. Global shifts in ΔCT values are evident from vertical shifts in the boxes, especially between patients and between the multiple control samples within a patient. These shifts are reduced in the post-normalized data. Variance is reduced post-normalization as well.
Figure 1.
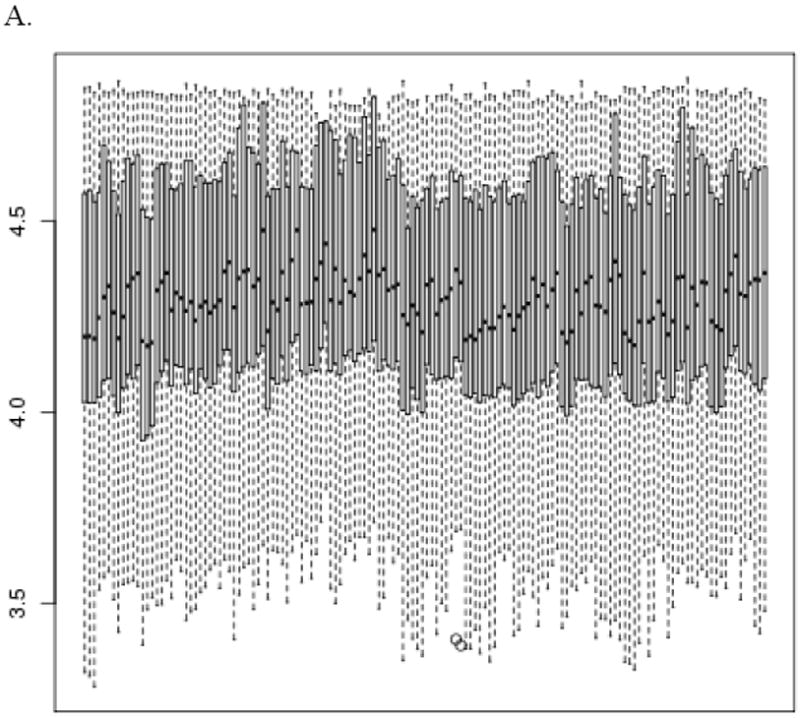
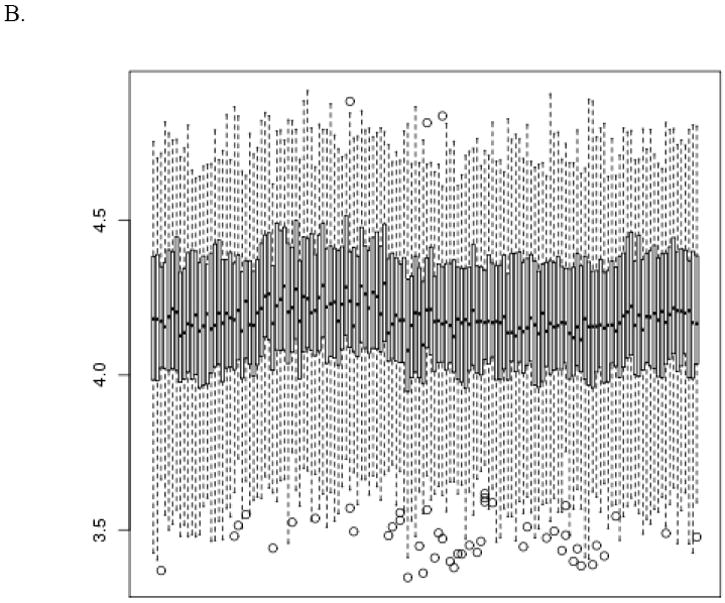
Pre- (panel A) and post- (panel B) normalization box and whisker plots of the ΔCT values for all specimens, sorted by TLDA plate run order. The vertical axis is log base 2 ΔCT and the horizontal axis corresponds to specimen ID. The bottom and top of the box represent the 25th and 75th percentiles of the probe expression values. The horizontal bar inside the box represents the median. The whiskers extend to either 1.5 times the interquartile range (75th percentile minus the 25th percentile) beyond the box or the most extreme point, whichever is shorter. Points beyond that range are shown as circles.
Some time/MOI combinations were not observed for some subjects due to insufficient sample. Of the 90 immune response genes, 22 genes were excluded after normalization from further analyses because 40% or more of the values over all of the samples were at the maximum CT value of 40 and therefore were largely uninformative leaving 68 genes for further analysis.
4.3 Optimum Time/MOI Combination
Frequencies for the number of times the maximum Z-score occurs for each time/MOI combination are shown in Table 1. The most maximum Z-scores were observed at time=48 hours and MOI=5.0 PFU/cell with a tally of 47 genes. The other metrics described in the methods indicated the same optimal time/MOI combination. Upon further inspection, all 47 genes were found to be down-regulated compared to control. For nearly all of the 47 genes, this down-regulation appeared to not be the primary change. For example, Figure 2 shows Z-scores for all time/MOI combinations for IL-10 and TNF-α gene expression. It is evident for IL-10 that the largest acute response is an up-regulation at 12 hours. The broad down-regulation of gene expression at 48 hours is likely to be a result of large-scale, viral-induced shutdown of cellular metabolic activity and/or cellular death.(Buller and Palumbo, 1991;Jungwirth and Launer, 1968;KIT and DUBBS, 1963) As our primary focus was the acute response to viral infection, we excluded the 48 hour time point from further consideration. When excluding time=48 hours, the time/MOI combination with the most maximum absolute Z-scores was MOI=0.5 PFU/cell at 18 hours. This was the case for all metrics used.
Table 1.
Frequencies for the number of times the maximum Z-score occurs for each time/MOI combination.
Time/MOI combination with the overall largest frequency of maximum absolute Z-scores.
Time/MOI combination with the overall largest frequency of maximum absolute Z-scores when excluding 48 hours.
Figure 2.
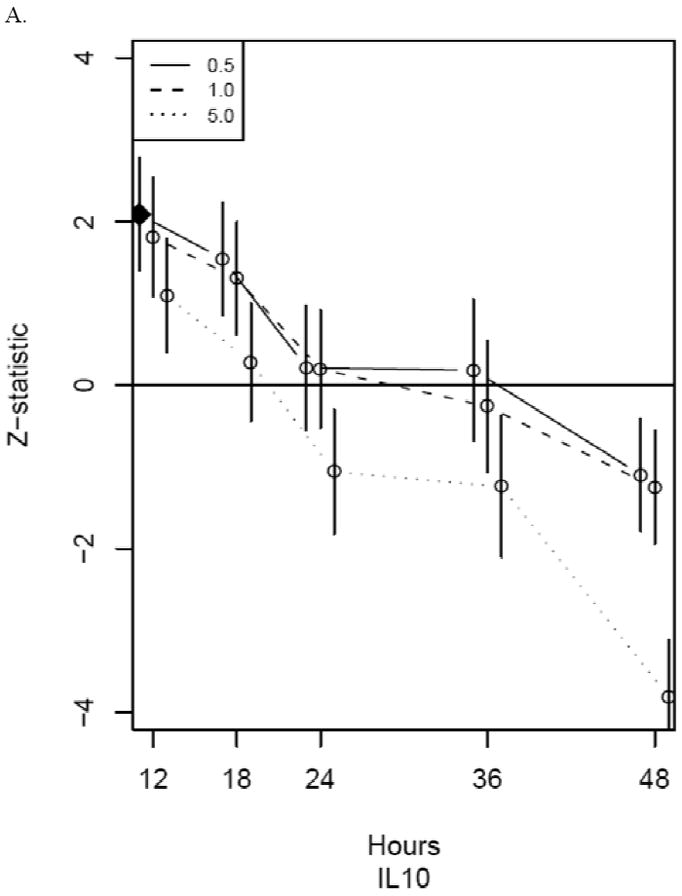
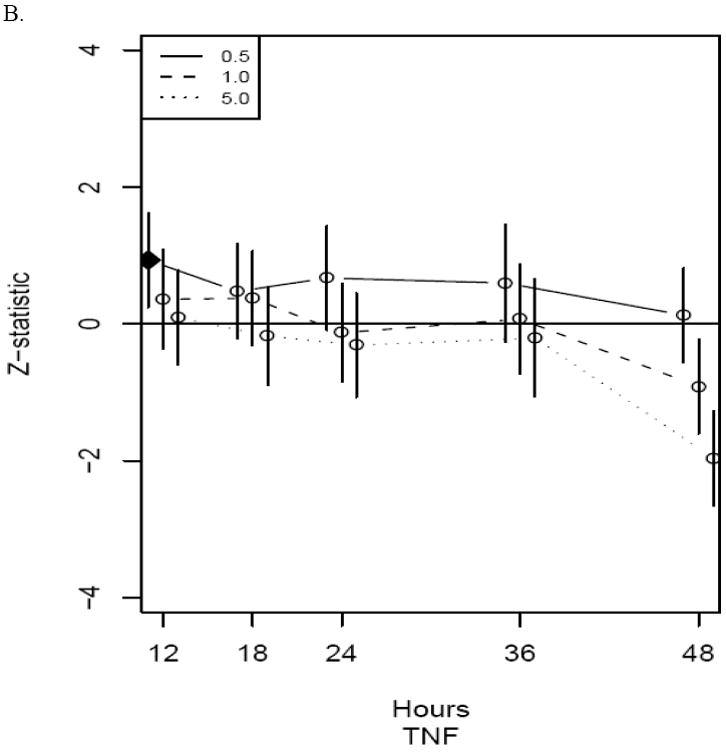
Z-statistics for IL10 (panel A) and TNF (panel B) for each time/MOI combination. The vertical axis is the standardized model-based estimate of change from control and the horizontal axis corresponds to time in hours of exposure to vaccinia. Line types indicate MOI as indicated in legends. The closed diamond indicates the time/MOI combination with the maximum absolute Z-score (excluding time=48 hours) for that gene while the open circles indicate non-maximum standardized model-based estimates. Vertical bars indicate Z-transformed ± 1 standard error limits. Dots for the three MOIs are jittered somewhat at each time to enable complete viewing of the confidence intervals.
4.4 Comparison of Gene Expression to Secreted Cytokine Levels
Table 2 shows the summary of corresponding secretion levels for the 10 subjects in this study for the 9 cytokines which were represented on the TLDA. Secretion of IL-6, IL-12p40, IL-1β, IFN-γ and TNF-α was observed (Table 2). Little relationship between gene expression and cytokine secretion was observed as demonstrated in Figure 3 These measures were significantly correlated only for IL-2 (Spearman r=0.72, p=0.03), in spite of the fact that no meaningful change was observed in either endpoint. Gene expression increased for IL-12p40, decreased for IL-10 and TNF-α, and did not change for IL-2, IL-4, IL-6, IL-18 IL-1β and IFN-γ (Supplementary Table 1).
Table 2.
Secreted levels of vaccinia-specific cytokines in PBMC infected with UV-inactivated vaccinia virus on the 10 subjects in this study.
| Cytokine | Median pg/mL (IQR)# |
|---|---|
| IL-2 | 7.26 (-4.53, 14.96) |
| IL-4 | -0.11 (-2.29, 1.73) |
| IL-6 | 574.14 (368.05, 627.64) |
| IL-10 | 0.50 (-3.83, 4.30) |
| IL-12p40 | 59.76 (22.03, 149.05) |
| IL-18 | -0.89 (-3.26, 2.63) |
| IL-1β | 26.32 (15.86, 45.36) |
| IFN-γ | 323.28 (54.11, 918.69) |
| TNF-α | 100.81 (66.22, 179.61) |
Cytokine secretion levels defined as the difference in the median of the vaccinia stimulated PBMC and the median of the unstimulated PBMC
Figure 3.
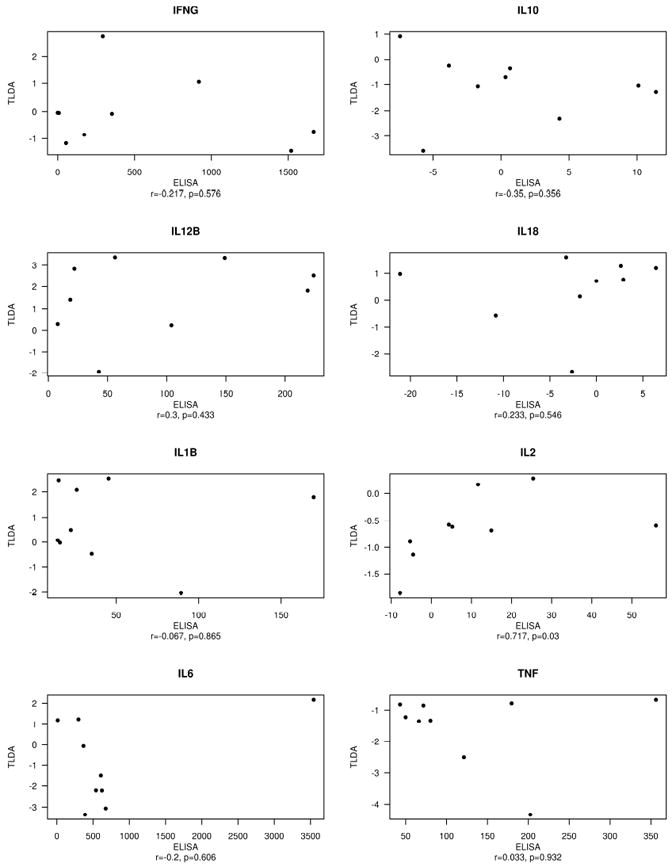
Scatter plots demonstrating relationship between normalized TLDA gene expression on the y-axis and cytokine secretion measured by ELISA on the x-axis. Both axes are fold change from control. Spearman correlations and associated p-values are included in axis labels. Cytokines are indicated in panel titles. IL-4 did not express on the TLDA, so is not shown.
5.0 Discussion
In this study we sought to determine the time and vaccinia dose combination that would maximize identification of the number of acute immune response changes in response to vaccinia stimulation in preparation for a large gene expression microarray experiment. We utilized a TLDA immune response panel to assess expression of 90 immune response genes at 15 time/MOI combinations in ten subjects. There is indeed evidence of change from baseline in many of these genes. While the maximum number of large changes occurred at a time of 48 hours and MOI of 5 PFU/cell, we determined that most acute responses had passed by 48 hours. The ideal time/MOI combination appears to be 18 hours with a MOI of 0.5 PFU/cell.
In our previous optimization we compared the vaccinia-specific secretion of a panel of cytokines following stimulation with either the replicating (live) NYCBOH strain or the virus inactivated with psoralen and long wavelength UV light (Ryan et al., 2009). We observed higher secretion of vaccinia-specific cytokines involved in both innate and adaptive immunity with the inactivated vaccinia virus. Therefore, we chose to use inactivated vaccinia virus for all gene expression studies as the inactivated vaccinia virus retains the ability to infect cells but cannot replicate and hence potentially perturb the host cell machinery (Tsung et al., 1996).
There is a clear need for normalization of the relative abundance values produced by RT-PCR due to experimental variation between clinical samples resulting from sample handling and extraction as well as thermal cycling differences between plates (Abruzzo et al., 2005;Kagedal et al., 2007;Kriegova et al., 2008;Marco and Kleerebezem, 2008). Many authors propose use of a housekeeping gene(s) that is expected to have little variation between tissue types and experimental conditions as a normalizing factor. Use of one gene as a normalization factor on a TLDA array where expressions of multiple genes are measured assumes the same normalization factor (i.e., bias correction factor) holds for all genes. Indeed, several genes have been evaluated as potential normalizers with varying conclusions of reliability. Given the variability observed by ourselves and others in genes used as normalizers, and the fact that statistical models easily handle relative abundance values provided proper experimental design is used, the ideal endpoint for analyses would be CT rather than ΔCT.
Inspection of the data at hand indicated that a single normalizer was not sufficient; nonlinear smoothers on the MVA plots demonstrated that bias was a function of abundance rather than constant for all genes. It is well known that nonlinear biases in gene expression are generally expected in the expression microarray literature on various platforms, and nonlinear model-based normalization has been found to be optimal in that setting (Dudoit et al., 2002;Bolstad et al., 2003;Eckel et al., 2005;Oberg et al., 2006; Cunningham et al., 2009).
Thus, we used a nonlinear model-based normalization that allows incorporation of known experimental effects, e.g. TLDA plate, to remove the nonlinear biases in the ΔCT values (Eckel et al., 2005). As with most commonly used global microarray normalization algorithms, this assumes that only a small portion of genes are differentially expressed between specimens normalized together, that the distribution of differentially expressed genes is approximately symmetric about identity, and that there are sufficient genes for estimation of bias without over-fitting. Data from all 96 genes were used in the normalization in order to estimate the entire expression distribution. While 96 total genes is small relative to the number of genes on high dimensional arrays, the distribution of expression values spanned a range sufficient to estimate bias as a function of mean abundance without over-fitting or undue influence from a few genes. Normalization was performed within a time/MOI combination since a large portion of this panel of immune response genes were expected to be differentially expressed between these combinations.
Per-gene linear mixed effects models such as those proposed in Steibel et al were used to compute predicted values for all time/MOI combinations (Steibel et al., 2009). We allowed for a gene-specific variance. These models allow estimation of average change from control using all available TLDA data, even from plates where the control failed due to insufficient sample. Z-scores were used to put all genes on an equal playing ground when summarizing changes. While the goal here was to determine the time/MOI combination yielding the most changes, the analytical strategy using non-linear normalization together with linear (mixed) models can be easily used for estimating fold changes, significance of changes and associated confidence intervals in these high throughput PCR assays. In fact, multiple comparisons assessing statistical significance of pair-wise comparisons could be performed within the per-gene model framework to determine whether the time/MOI combination with the maximum change is significantly different from the “close second” combinations for an optimization study with a large enough sample size; those with the largest changes, yet not significantly different from the largest, could all be considered candidates for the optimal time/MOI setting. An optimization study with small sample size would have limited power to detect such differences however, so care should be taken while interpreting non-significant differences.
There is limited literature on the identification of putative immune response genes post-smallpox vaccination to compare and contrast the genes that we identified in our optimization study (Scherer et al., 2007;Esteves et al., 2007;Assarsson et al., 2008;Guerra et al., 2004;Guerra et al., 2003). Despite this, we found overlap of some key genes that we identified with our approach in the literature. Guerra et al identified up-regulation of genes in two clusters containing 20 immune response genes at 2, 6 and 16 hours post infection in Human HeLa cells in response to modified vaccinia virus Ankara (Guerra et al., 2003;Guerra et al., 2004). Some of the key immune response genes belonging to these two clusters, including CD28, CD80, IL-1A, IL-6, IL-7, IL-8, IL-15 and components of signal transduction pathways, such as NFKB2, were identified using our approach. In addition, CD40, FN1, and HLA-DRA molecules that were found to change in our study were also identified to be differentially expressed in a smallpox vaccine (Aventis-Pasteur Wetvax®) immune response study (Scherer et al., 2007). These data suggest that the conditions for time and MOI identified using our approach would be optimal for detecting differences in key immune response genes.
Our cytokine secretion data showed only mild concordance with gene expression data as demonstrated by scatter plots and correlations. The lack of direct correlation between mRNA and protein expression has been reported in other studies as well (Chen and Wilson, 2007;Gygi et al., 1999;Moutaftsi et al., 2010). There is no clear and simple one-to-one correspondence between PCR primer sets (or microarray probe sets) and protein species and it is likely that post-transcriptional, translational, post-translational, and other forms of regulation contribute to the disconnect between protein and mRNA expression levels (Fagan et al., 2007;Zhang et al., 2010;Chen and Wilson, 2007). Furthermore, there are temporal delays between mRNA expression and protein production and transport to the appropriate cellular location, not to mention the effects of the ubiquitin-proteosome system on protein regulation (Hershko and Ciechanover, 1998;Kodadek, 2010). We observed gene up- or down-regulation and subsequent secretion of IL-12p40 and TNF-α in smallpox vaccinees. Gene down-regulation was observed for IL-10 but no cytokine secretion was detected. IL-1β, IFN-γ and IL-6 were secreted despite no change in gene expression. No secretion or change in gene expression was observed for IL-2, IL-4 and IL-18. Limited literature on vaccinia-specific cytokine detection show that infected human peripheral blood cells can secrete IFN-α, TNF-α, IL-1β, IL-6 and IL-10 (Zhang et al., 2005;Ennis et al., 2002;Ryan et al., 2009). In addition, the absence of IL-4, IL-10, and IL-18 secretion was also in concordance with no up- or down-regulation of the corresponding genes for these cytokines. There are no reports on IL-4, IL-12p70 and IL-18 secretion post-smallpox vaccination. A few reports show low secretion of IL-4 and no secretion of IL-12p70 or IL-18 by PBMC in response to a related poxvirus, parapox virus ovis (PPVO) (Friebe et al., 2004;Zhang et al., 2005).
6.0 Conclusions
This study evaluates gene expression for a large panel of immune response genes at 15 different time/MOI combinations using a factorial treatment design. The use of TLDA allows such an evaluation in a relatively high throughput manner and at a reasonable cost compared to other technologies. While the sample sizes here are small, they are sufficient for determining optimal time/MOI conditions. Our results will inform a high dimensional microarray experiment with much larger sample sizes to be performed allowing for inferences between immune response groups, gender, race and ethnic groups in known immune response genes as well as discovery of other genes involved in the immune response process. The strategy we have implemented represents a way of making decisions regarding critical experimental parameters that is faster, cheaper and less labor intensive than utilizing the microarray platform intended for the full study. We expect this strategy to be practical and useful to many investigators in any area of research utilizing expensive, high dimensional assay platforms that interrogate hundreds to thousands of end points.
Supplementary Material
Acknowledgments
We are grateful for the contributions of Ms. Vernadette A. Simon, Mr. Christopher P. Kolbert, Dr. V. Shane Pankratz and Mr. Robert A. Vierkant. This work was partially supported by NIH grant N01-AI40065. In addition, the project described was supported by Grant Number 1 UL1 RR024150 from the National Center for Research Resources (NCRR), a component of the National Institutes of Health (NIH), and the NIH Roadmap for Medical Research. Its contents are solely the responsibility of the authors and do not necessarily represent the official view of NCRR or NIH. Information on NCRR is available at http://www.ncrr.nih.gov/. Information on Reengineering the Clinical Research Enterprise can be obtained from http://nihroadmap.nih.gov.
Footnotes
Disclosures The authors have no conflicts of interest relative to vaccinia virus to declare.
Publisher's Disclaimer: This is a PDF file of an unedited manuscript that has been accepted for publication. As a service to our customers we are providing this early version of the manuscript. The manuscript will undergo copyediting, typesetting, and review of the resulting proof before it is published in its final citable form. Please note that during the production process errors may be discovered which could affect the content, and all legal disclaimers that apply to the journal pertain.
Reference List
- 1.Abruzzo LV, Wang J, Kapoor M, Medeiros LJ, Keating MJ, Edward HW, Barron LL, Cromwell CC, Coombes KR. Biological validation of differentially expressed genes in chronic lymphocytic leukemia identified by applying multiple statistical methods to oligonucleotide microarrays. J Mol Diagn. 2005;7:337. doi: 10.1016/s1525-1578(10)60562-4. [DOI] [PMC free article] [PubMed] [Google Scholar]
- 2.Albertson DG, Pinkel D. Genomic microarrays in human genetic disease and cancer. Hum Mol Genet. 2003;12(Spec No 2):R145–R152. doi: 10.1093/hmg/ddg261. [DOI] [PubMed] [Google Scholar]
- 3.Assarsson E, Greenbaum JA, Sundstrom M, Schaffer L, Hammond JA, Pasquetto V, Oseroff C, Hendrickson RC, Lefkowitz EJ, Tscharke DC, Sidney J, Grey HM, Head SR, Peters B, Sette A. Kinetic analysis of a complete poxvirus transcriptome reveals an immediate-early class of genes. Proc Natl Acad Sci U S A. 2008;105:2140. doi: 10.1073/pnas.0711573105. [DOI] [PMC free article] [PubMed] [Google Scholar]
- 4.Baron C, Somogyi R, Greller LD, Rineau V, Wilkinson P, Cho CR, Cameron MJ, Kelvin DJ, Chagnon P, Roy DC, Busque L, Sekaly RP, Perreault C. Prediction of graft-versus-host disease in humans by donor gene-expression profiling. PLoS Med. 2007;4:e23. doi: 10.1371/journal.pmed.0040023. [DOI] [PMC free article] [PubMed] [Google Scholar]
- 5.Bland JM, Altman DG. Statistical methods for assessing agreement between two methods of clinical measurement. Lancet. 1986;1:307. [PubMed] [Google Scholar]
- 6.Bolstad BM, Irizarry RA, Astrand M, Speed TP. A comparison of normalization methods for high density oligonucleotide array data based on variance and bias. Bioinformatics. 2003;19:185. doi: 10.1093/bioinformatics/19.2.185. [DOI] [PubMed] [Google Scholar]
- 7.Buller RM, Palumbo GJ. Poxvirus pathogenesis. Microbiol Rev. 1991;55:80. doi: 10.1128/mr.55.1.80-122.1991. [DOI] [PMC free article] [PubMed] [Google Scholar]
- 8.Chen S, Wilson DB. Proteomic and transcriptomic analysis of extracellular proteins and mRNA levels in Thermobifida fusca grown on cellobiose and glucose. J Bacteriol. 2007;189:6260. doi: 10.1128/JB.00584-07. [DOI] [PMC free article] [PubMed] [Google Scholar]
- 9.Cunningham JM, Oberg AL, Borralho PM, Kren BT, French AJ, Wang L, Bot BM, Morlan BW, Silverstein KA, Staggs R, Zeng Y, Lamblin AF, Hilker CA, Fan JB, Steer CJ, Thibodeau SN. Evaluation of a new high-dimensional miRNA profiling platform. BMC Med Genomics. 2009;2:57. doi: 10.1186/1755-8794-2-57. [DOI] [PMC free article] [PubMed] [Google Scholar]
- 10.Dhiman N, Bonilla R, O’Kane D, Poland GA. Gene expression microarrays: A 21st century tool for directed vaccine design. Vaccine. 2002;20:22. doi: 10.1016/s0264-410x(01)00319-x. [DOI] [PubMed] [Google Scholar]
- 11.Dhiman N, Ovsyannikova IG, Howe RC, Ryan JE, Jacobson RM, Poland GA. Interleukin-4 induced by measles virus and measles-derived peptides as measured by IL-4 receptor-blocking ELISA. J Immunol Methods. 2004;287:217. doi: 10.1016/j.jim.2004.02.002. [DOI] [PubMed] [Google Scholar]
- 12.Dudoit S, Yang YH, Callow MJ, Speed TP. Statistical methods for identifying genes with differential expression in replicated cDNA microarray experiments. Statistica Sinica. 2002;12:111. [Google Scholar]
- 13.Earl PL, Cooper N, Wyatt LS, Moss B, Carroll MW. Preparation of cell cultures and vaccinia virus stocks. Curr Protoc Mol Biol. 2001a;Chapter 16(Unit16) doi: 10.1002/0471142727.mb1616s43. [DOI] [PubMed] [Google Scholar]
- 14.Earl PL, Moss B, Wyatt LS, Carroll MW. Generation of recombinant vaccinia viruses. Curr Protoc Mol Biol. 2001b;Chapter 16(Unit16) doi: 10.1002/0471142727.mb1617s43. [DOI] [PubMed] [Google Scholar]
- 15.Eckel JE, Gennings C, Therneau TM, Burgoon LD, Boverhof DR, Zacharewski TR. Normalization of two-channel microarray experiments: a semiparametric approach. Bioinformatics. 2005;21:1078. doi: 10.1093/bioinformatics/bti105. [DOI] [PubMed] [Google Scholar]
- 16.Ennis FA, Cruz J, Demkowicz WE, Jr, Rothman AL, McClain DJ. Primary induction of human CD8+ cytotoxic T lymphocytes and interferon-- producing T cells after smallpox vaccination. J Infect Dis. 2002;185:1657. doi: 10.1086/340517. [DOI] [PubMed] [Google Scholar]
- 17.Esteves GH, Simoes AC, Souza E, Dias RA, Ospina R, Venancio TM. New insights about host response to smallpox using microarray data. BMC Syst Biol. 2007;1:38. doi: 10.1186/1752-0509-1-38. [DOI] [PMC free article] [PubMed] [Google Scholar]
- 18.Fagan A, Culhane AC, Higgins DG. A multivariate analysis approach to the integration of proteomic and gene expression data. Proteomics. 2007;7:2162. doi: 10.1002/pmic.200600898. [DOI] [PubMed] [Google Scholar]
- 19.Friebe A, Siegling A, Friederichs S, Volk HD, Weber O. Immunomodulatory effects of inactivated parapoxvirus ovis (ORF virus) on human peripheral immune cells: induction of cytokine secretion in monocytes and Th1-like cells. J Virol. 2004;78:9400. doi: 10.1128/JVI.78.17.9400-9411.2004. [DOI] [PMC free article] [PubMed] [Google Scholar]
- 20.Grinde B, Gayorfar M, Hoddevik G. Modulation of gene expression in a human cell line caused by poliovirus, vaccinia virus and interferon. Virol J. 2007;4:24. doi: 10.1186/1743-422X-4-24. [DOI] [PMC free article] [PubMed] [Google Scholar]
- 21.Guerra S, Lopez-Fernandez LA, Conde R, Pascual-Montano A, Harshman K, Esteban M. Microarray analysis reveals characteristic changes of host cell gene expression in response to attenuated modified vaccinia virus Ankara infection of human HeLa cells. J Virol. 2004;78:5820. doi: 10.1128/JVI.78.11.5820-5834.2004. [DOI] [PMC free article] [PubMed] [Google Scholar]
- 22.Guerra S, L¢pez-Fern ndez LA, Pascual-Montano A, Munoz M, Harshman K, Esteban M. Cellular gene expression survey of vaccinia virus infection of human HeLa cells. J Virol. 2003;77:6493. doi: 10.1128/JVI.77.11.6493-6506.2003. [DOI] [PMC free article] [PubMed] [Google Scholar]
- 23.Guerra S, Najera JL, Gonzalez JM, Lopez-Fernandez LA, Climent N, Gatell JM, Gallart T, Esteban M. Distinct gene expression profiling after infection of immature human monocyte-derived dendritic cells by the attenuated poxvirus vectors MVA and NYVAC. J Virol. 2007;81:8707. doi: 10.1128/JVI.00444-07. [DOI] [PMC free article] [PubMed] [Google Scholar]
- 24.Gygi SP, Rochon Y, Franza BR, Aebersold R. Correlation between protein and mRNA abundance in yeast. Mol Cell Biol. 1999;19:1720. doi: 10.1128/mcb.19.3.1720. [DOI] [PMC free article] [PubMed] [Google Scholar]
- 25.Heidecker B, Hare JM. The use of transcriptomic biomarkers for personalized medicine. Heart Fail Rev. 2007;12:1. doi: 10.1007/s10741-007-9004-7. [DOI] [PubMed] [Google Scholar]
- 26.Hershko A, Ciechanover A. The ubiquitin system. Annu Rev Biochem. 1998;67:425. doi: 10.1146/annurev.biochem.67.1.425. [DOI] [PubMed] [Google Scholar]
- 27.Jain KK. Personalised medicine for cancer: from drug development into clinical practice. Expert Opin Pharmacother. 2005;6:1463. doi: 10.1517/14656566.6.9.1463. [DOI] [PubMed] [Google Scholar]
- 28.Jungwirth C, Launer J. Effect of poxvirus infection on host cell deoxyribonucleic acid synthesis. J Virol. 1968;2:401. doi: 10.1128/jvi.2.5.401-408.1968. [DOI] [PMC free article] [PubMed] [Google Scholar]
- 29.Kagedal B, Farneback M, Hakansson A, Gustafsson B, Hakansson L. How useful are housekeeping genes? Variable expression in melanoma metastases. Clin Chem Lab Med. 2007;45:1481. doi: 10.1515/CCLM.2007.303. [DOI] [PubMed] [Google Scholar]
- 30.Kennedy R, Pankratz VS, Swanson E, Watson D, Golding H, Poland GA. Statistical approach to estimate vaccinia- specific neutralizing antibody titers using a high throughput assay. Clin Vaccine Immunol. 2009;16:1105. doi: 10.1128/CVI.00109-09. [DOI] [PMC free article] [PubMed] [Google Scholar]
- 31.KIT S, DUBBS DR. Biochemistry of vaccinia-infected mouse fibroblasts (strain L-M). IV. 3H-thymidine uptake into DNA of cells exposed to cold shock. Exp Cell Res. 1963;31:397. doi: 10.1016/0014-4827(63)90016-8. [DOI] [PubMed] [Google Scholar]
- 32.Kodadek T. No Splicing, no dicing: non-proteolytic roles of the ubiquitin-proteasome system in transcription. J Biol Chem. 2010;285:2221. doi: 10.1074/jbc.R109.077883. [DOI] [PMC free article] [PubMed] [Google Scholar]
- 33.Kriegova E, Arakelyan A, Fillerova R, Zatloukal J, Mrazek F, Navratilova Z, Kolek V, du Bois RM, Petrek M. PSMB2 and RPL32 are suitable denominators to normalize gene expression profiles in bronchoalveolar cells. BMC Mol Biol. 2008;9:69. doi: 10.1186/1471-2199-9-69. [DOI] [PMC free article] [PubMed] [Google Scholar]
- 34.Manischewitz J, King LR, Bleckwenn NA, Shiloach J, Taffs R, Merchlinsky M, Eller N, Mikolajczyk MG, Clanton DJ, Monath T, Weltzin RA, Scott DE, Golding H. Development of a novel vaccinia-neutralization assay based on reporter-gene expression. J Infect Dis. 2003;188:440. doi: 10.1086/376557. [DOI] [PubMed] [Google Scholar]
- 35.Marco ML, Kleerebezem M. Assessment of real-time RT-PCR for quantification of Lactobacillus plantarum gene expression during stationary phase and nutrient starvation. J Appl Microbiol. 2008;104:587. doi: 10.1111/j.1365-2672.2007.03578.x. [DOI] [PubMed] [Google Scholar]
- 36.Maynard JA, Myhre R, Roy B. Microarrays in infection and immunity. Curr Opin Chem Biol. 2007;11:306. doi: 10.1016/j.cbpa.2007.01.727. [DOI] [PMC free article] [PubMed] [Google Scholar]
- 37.Morley M, Molony CM, Weber TM, Devlin JL, Ewens KG, Spielman RS, Cheung VG. Genetic analysis of genome-wide variation in human gene expression. Nature. 2004;430:743. doi: 10.1038/nature02797. [DOI] [PMC free article] [PubMed] [Google Scholar]
- 38.Moutaftsi M, Tscharke DC, Vaughan K, Koelle DM, Stern L, Calvo-Calle M, Ennis F, Terajima M, Sutter G, Crotty S, Drexler I, Franchini G, Yewdell JW, Head SR, Blum J, Peters B, Sette A. Uncovering the interplay between CD8, CD4 and antibody responses to complex pathogens. Future Microbiol. 2010;5:221. doi: 10.2217/fmb.09.110. [DOI] [PMC free article] [PubMed] [Google Scholar]
- 39.Neuman,d, V, Robinson WH. Microarray profiling of antiviral antibodies for the development of diagnostics, vaccines, and therapeutics. Clin Immunol. 2004;111:196. doi: 10.1016/j.clim.2003.12.010. [DOI] [PubMed] [Google Scholar]
- 40.Newman FK, Frey SE, Blevins TP, Mandava M, Bonifacio A, Jr, Yan L, Belshe RB. Improved assay to detect neutralizing antibody following vaccination with diluted or undiluted vaccinia (Dryvax) vaccine. J Clin Microbiol. 2003;41:3154. doi: 10.1128/JCM.41.7.3154-3157.2003. [DOI] [PMC free article] [PubMed] [Google Scholar]
- 41.Oberg AL, Mahoney DW, Ballman KV, Therneau TM. Joint estimation of calibration and expression for high-density oligonucleotide arrays. Bioinformatics. 2006;22:2381. doi: 10.1093/bioinformatics/btl399. [DOI] [PubMed] [Google Scholar]
- 42.Ovsyannikova IG, Jacobson RM, Ryan JE, Vierkant RA, Pankratz VS, Jacobsen SJ, Poland GA. HLA class II alleles and measles virus-specific cytokine immune response following two doses of measles vaccine. Immunogenetics. 2005a;56:798. doi: 10.1007/s00251-004-0756-0. [DOI] [PubMed] [Google Scholar]
- 43.Ovsyannikova IG, Ryan JE, Vierkant RA, Pankratz SV, Jacobson RM, Poland GA. Immunologic significance of HLA class I genes in measles virus-specific IFN-gamma and IL-4 cytokine immune responses. Immunogenetics. 2005b;57:828. doi: 10.1007/s00251-005-0061-6. [DOI] [PubMed] [Google Scholar]
- 44.Rubins KH, Hensley LE, Jahrling PB, Whitney AR, Geisbert TW, Huggins JW, Owen A, LeDuc JW, Brown PO, Relman DA. The host response to smallpox: analysis of the gene expression program in peripheral blood cells in a nonhuman primate model. Proc Natl Acad Sci U S A. 2004;101:15190. doi: 10.1073/pnas.0405759101. [DOI] [PMC free article] [PubMed] [Google Scholar]
- 45.Ryan JE, Dhiman N, Ovsyannikova IG, Vierkant RA, Pankratz VS, Poland GA. Response surface methodology to determine optimal cytokine responses in human peripheral blood mononuclear cells after smallpox vaccination. J Immunol Methods. 2009;341:97. doi: 10.1016/j.jim.2008.11.001. [DOI] [PMC free article] [PubMed] [Google Scholar]
- 46.Scherer CA, Magness CL, Steiger KV, Poitinger ND, Caputo CM, Miner DG, Winokur PL, Klinzman D, McKee J, Pilar C, Ward PA, Gillham MH, Haulman NJ, Stapleton JT, Iadonato SP. Distinct gene expression profiles in peripheral blood mononuclear cells from patients infected with vaccinia virus, yellow fever 17D virus, or upper respiratory infections. Vaccine. 2007;25:6458. doi: 10.1016/j.vaccine.2007.06.035. [DOI] [PMC free article] [PubMed] [Google Scholar]
- 47.Steibel JP, Poletto R, Coussens PM, Rosa GJ. A powerful and flexible linear mixed model framework for the analysis of relative quantification RT-PCR data. Genomics. 2009;94:146. doi: 10.1016/j.ygeno.2009.04.008. [DOI] [PubMed] [Google Scholar]
- 48.Trevino V, Falciani F, Barrera-Saldana HA. DNA microarrays: a powerful genomic tool for biomedical and clinical research. Mol Med. 2007;13:527. doi: 10.2119/2006-00107.Trevino. [DOI] [PMC free article] [PubMed] [Google Scholar]
- 49.Tsung K, Yim JH, Marti W, Buller RM, Norton JA. Gene expression and cytopathic effect of vaccinia virus inactivated by psoralen and long-wave UV light. J Virol. 1996;70:165. doi: 10.1128/jvi.70.1.165-171.1996. [DOI] [PMC free article] [PubMed] [Google Scholar]
- 50.Valdivia-Granda WA, Kann MG, Malaga J. Transcriptional interactions during smallpox infection and identification of early infection biomarkers. Pac Symp Biocomput. 2007;100 [PubMed] [Google Scholar]
- 51.Watson SJ, Meng F, Thompson RC, Akil H. The “chip” as a specific genetic tool. Soc Biol Psychiatry. 2000;48:1147. doi: 10.1016/s0006-3223(00)01080-5. [DOI] [PubMed] [Google Scholar]
- 52.Zhang W, Li F, Nie L. Integrating multiple ‘omics’ analysis for microbial biology: application and methodologies. Microbiology. 2010;156:287. doi: 10.1099/mic.0.034793-0. [DOI] [PubMed] [Google Scholar]
- 53.Zhang Z, Abrahams MR, Hunt LA, Suttles J, Marshall W, Lahiri DK, Kotwal GJ. The Vaccinia Virus N1L Protein Influences Cytokine Secretion in Vitro after Infection. Ann N Y Acad Sci. 2005;1056:69. doi: 10.1196/annals.1352.005. [DOI] [PubMed] [Google Scholar]
Associated Data
This section collects any data citations, data availability statements, or supplementary materials included in this article.