

Abstract
Purpose
The aim of the present study was to gain insight into the penetration, biodistribution, and fate of globulins in the brain after 2-O-hexyldiglycerol-induced blood–brain barrier opening.
Procedures
The spatial distribution of fluorescence probes was investigated after blood–brain barrier opening with intracarotid 2-O-hexyldiglycerol injection. Fluorescence intensity was visualized by microscopy (mice and rats) and by in vivo time-domain optical imaging.
Results
There was an increased 2-O-hexyldiglycerol-mediated transfer of fluorescence-labeled globulins into the ipsilateral hemisphere. Sequential in vivo measurements revealed that the increase in protein concentration lasted at least 96 h after administration. Ex vivo detection of tissue fluorescence confirmed the results obtained in vivo.
Conclusion
Globulins enter the healthy brain in conjunction with 2-O-hexyldiglycerol. Sequential in vivo near-infrared fluorescence measurements enable the visualization of the spatial distribution of antibodies in the brain of living small animals.
Key words: BBB opening, 2-O-Hexyldiglycerol, Anti TGF-β antibody 1D11, Alexa Fluor 680, Cy5.5, Time-domain optical imaging
Introduction
Treatment of brain disorders such as neurodegenerative diseases or malignant brain tumors is still a major problem. While there is progress in the development of innovative chemical agents against brain disorders with excellent results in vitro, the therapeutic use of enzymes or antibodies in clinical settings is often limited [1, 2]. The unsatisfactory transport of therapeutics to the brain tissue results mostly from either low diffusion across the blood–brain barrier (BBB) due to high molecular weight and/or low lipophilicity or efflux mechanisms such as transporter systems like P-glycoprotein, which carry substances from the endothelium back into the brain capillary lumina [3, 4].
Several strategies have been described to increase the tissue concentrations of drugs within the brain. One strategy to open the BBB is the intracarotid infusion of hypertonic mannitol [5] leading to shrinkage of the brain endothelial cells and thereby widening cell–cell contacts [6]. Osmotic BBB opening has already been successfully used to increase the effectiveness of chemotherapy in animals and humans with central nervous system tumors [7]. Other methods to overcome the BBB with therapeutic intention are the use of new lipophilic chemotherapeutic agents [8], drug administration as liposomal-coated nanoparticles [9], BBB opening with bradykinin B2 receptor agonists like cereport (RMP-7, Lobradimil) [10, 11], or the co-administration of P-glycoprotein blocking drugs [12].
The intracarotid bolus administration of short chain alkylglycerols has been reported to be a new effective and well-controllable method to increase the transfer of even larger drugs such as fluorescein isothiocyanate (FITC)–Dextran 40000 and Lissamine–rhodamine B200 (RB200) albumin to the ipsilateral hemisphere of healthy and brain tumor bearing rats [13]. The opening of the BBB using 2-O-hexyldiglycerol (HG) is short lasting, and almost no toxicity has been described. Thirty minutes after intracarotid administration of HG, BBB integrity was shown to be restored [14]. However, to date, there are no data available on the alkylglycerol-mediated penetration of large 150-kDa-sized drugs like enzymes or antibodies into the brain. Moreover, no clear information exists about tissue distribution of large drugs after entering the brain via the capillaries after the BBB was permeabilized. In addition, there are no data concerning the local distribution and the fate of large molecules such as antibodies in the brain.
In view of the increasing possibilities in the field of optical imaging, we could investigate the fate of fluorescent-labeled proteins in vivo in the brain of small animals. Using near-infrared fluorescent markers, we can measure tissue penetration of the fluorescence probes [15, 16]. Time domain in vivo optical imaging allows the simultaneous analysis of both fluorescence intensity and fluorescence lifetime, and also, tissue concentration of the markers could be monitored [17]. For interpretation of the results, quantitative in vivo imaging fluorescence detection was compared with the evaluation by standard fluorescence microscopy.
Our results suggest that alkylglycerols are highly efficacious in carrying Cy 5.5 fluorescence labeled γ-globulins (Cy 5.5 γ-globulin) or Alexa Fluor 680-coupled 1D11 anti-TGF-β antibodies (Alexa Fluor 680 1D11 antibody) into the brain of normal NMRI mice. The spatial distribution, duration, and fate of the labeled antibodies are described by near-infrared imaging of the brain over time in vivo.
Materials and Methods
Drugs
HG is a derivative of the alkylglycerol family with low systemic toxicity. It was obtained from Genzyme Pharmaceuticals (Cambridge, MA, USA) as a pure substance. For intraarterial administration, HG was diluted using sterile water and physiological saline to iso-osmolar solutions to avoid osmotic effects. The concentration used in our experiments was 82.5 mM HG.
Fluorescence markers of different molecular weight were administered to visualize the permeability of the BBB in the presence or absence of HG. Fluorescein sodium was used as low molecular weight marker (MW 367 Da). It was purchased from Merck (Darmstadt, Germany) and dissolved in physiological saline to a 5% stock solution. A dose of 80 mg kg−1 was given. For intracarotid use, the stock solution was further diluted with physiological saline to a total volume of 100 µl. RB200 and bovine γ-globulin (150 kDa) were purchased from Sigma-Aldrich (Deisenhofen, Germany). Cy 5.5 was obtained from GE Healthcare Bio-Sciences (Little Chalfont, UK). RB200 was coupled to γ-globulin and purified as described by Klein et al. [18]. Cy 5.5 was also coupled to γ-globulin according to the same protocol. The concentration of RB200 γ-globulin was 80 mg ml−1. For experiments in mice, the solutions were given without further dilution, whereas in rats, the dyes were further diluted 1:1 using physiological saline. Alexa Fluor 680 1D11 antibody, a biological active anti TGF-β antibody, was obtained from Genzyme Pharmaceuticals (Cambridge, MA, USA). The concentration of the stock solution was 1.2 mg ml−1, and this marker was also used without further dilution in mice experiments.
Animal Experiments
Male Wistar rats and male NMRI mice (Winkelmann, Borchen, Germany) were used in combination with different fluorescence-coupled agents (Table 1). In first short-time experiments with microscopic evaluation of the success of BBB opening, rats were used because the method was already established in our group. To use the in vivo imaging system, the experiments had to be done in mice. Thus, the animal was changed, and long-time analyses were performed in mice. Animals were kept under conventional controlled conditions (22°C, 55% humidity, and day–night rhythm) and had free access to a standard diet (V1534-000, Fa. sniff, Soest, Germany) and tap water. The experiments were performed in accordance with the German Law on protection of animals.
Table 1.
Fluorescence-coupled agents and the molecular weights and doses of each agent used in each animal
| Fluorescent agent | Dose | Molecular weight | Animals |
|---|---|---|---|
| Fluorescein sodium | 80 mg kg−1 ml−1 | 367 Da | Wistar rats |
| RB200 γ-globulin | 80 mg animal−1 ml−1 | ∼150 kDa | Wistar rats |
| Alexa Fluor 680 1D11 antibody | 120 µg animal−1 0.1 ml−1 | ∼150 kDa | NMRI mice |
| Cy 5.5 γ-globulin | 8 mg animal−1 ml−1 | ∼150 kDa | NMRI mice |
Intraarterial Drug Administration
The animals were anesthetized by intraperitoneal ketamine/xylazine. Wistar rats weighing 180–220 g received a dose of 90 mg kg−1 body weight/7.5 mg kg−1 body weight, and NMRI mice weighing 37 to 45 g received a dose of 85 mg kg−1 body weight/7 mg kg−1 body weight, respectively. For BBB opening and drug administration, the right external carotid artery was cannulated in a retrograde manner, using a self-made fine-glass catheter. Branches of the external carotid artery were ligated. In rats, a volume of 1,200 µl of HG (100 mM) was injected within 18 s using a Microlab M Hamilton dispenser (Microlab, Hamilton Bonaduz, Switzerland). In mice, 300 µl of HG (100 mM for microscopic evaluation and 82.5 mM for in vivo imaging) was given within 18 s. Control animals received an equivalent injection of physiological saline. Antegrade blood flow was interrupted by clamping the common carotid artery during the injection (18 s). In earlier experiments, a maximum penetration of co-administered drugs to the brain was shown when given between 3 and 30 min after intracarotid injection of HG (75 mM; [14]). Therefore, 5 min after the injection of HG, the fluorescent markers were given as a 10 min short-term infusion (total volume of 1,000 µl in rats and of 100 µl in mice) using a fm Perfusor (Braun, Melsungen, Germany). Thus, the amount given to mice was 8 mg of Cy 5.5 γ-globulin and 120 µg of Alexa Fluor 680 1D11 antibody per animal. After drug administration, the animals were euthanized (short-term experiments), or the external carotid artery was ligated, the catheter was removed, and the animals were allowed to awake. At the end of the experiments for fluorescence microscopy, the animals were euthanized by intraperitoneal ketamine/xylazine overdose. The brain was carefully removed and immediately frozen.
Microscopic Evaluation
For standard fluorescence microscopy, two different time points were chosen for the evaluation of fluorescence intensity. In the first experimental group, the brain was removed and shock frozen in isopentane (−50°C) 10 min after the infusion of the marker substances (short-term experiments). In the second group, animals were allowed to awake, and the brains were removed and frozen 24 h after dye administration.
Frozen brains were cut in coronal slices of 7 µm using a Leica cryotome CM 3050S, put on an ice-cold slide, and air-dried at −20°C for 1 h before they were carefully covered with cover slips, which were stacked at the sides off the glass. Evaluation of the sections was performed using fluorescence microscopy (Leica DM 5000B, Germany). Fluorescein sodium was visualized using a FITC/Bodipy/Fluo3/Dio filter cube. RB200 was evaluated using a Y3 filter cube.
Pictures were taken using a Leica DC 300 FX camera and an image analysis program (Leica FW4000). Exposure time was adjusted to the fluorescence intensity of the tissue from the right hemisphere, where the BBB was opened. Since in the left hemisphere the BBB was not opened, thus, it was used as internal control.
In Vivo Imaging
To monitor the fate of the protein-bound near-infrared fluorescent dyes within the brain tissue of treated mice, Alexa Fluor 680 and Cy 5.5 were used. The fluorescent markers were visualized in the time domain in vivo small animal fluorescence imager Optix™ (ART, Montreal, QC, Canada) [19, 20]. To evaluate the local distribution of the fluorescent agents in the brain in vivo, the region of the mouse brain was measured. Head-detector distance was equal in all measurements. The system scans in a raster mode and a step distance of 1 mm was selected in all experiments. For these experiments, a 670-nm wavelength pulsed laser diode in combination with a 700-nm long pass filter was applied to the tissue, and the laser power was optimized for each measurement (mean laser power was 100 µW). For fluorescence detection, a time-correlated single-photon counting system (TCSPC-130) was used. Since the system is time-resolved, it is possible to provide fluorescence lifetime in addition to intensity. This lifetime varies between different chromophores and the fluorescence originating from the animal tissue. Thus, lifetime measurement can be used to discriminate between fluorescence originating from the dye administered to the animal and auto-fluorescence [21].
Furthermore, the imaging system allows calculation of fluorophore depth and concentration [22] as well as detection of fluorescence from brain tissue deep under the skull [16]. Software from Advanced Research technologies (ART, Montreal, QC, Canada) was used for topographic representations of depth and visualization of concentration and location within the animal profile [23]. Intensity units were normalized for the same excitation power and excitation time per raster point (integration time).
To reduce fluorescence absorbance and scattering of the coat, the heads of the mice were epilated with cold wax stripes before the first measurement. For all in vivo measurements, the mice were anesthetized using inhalative isoflurane. Animals were placed in prone position on the table of the imager. Anesthesia was maintained during the fluorescence detection by offering an oxygen-isoflurane gas mix via a small mask. Fluorescence measurement in the tissue was performed repeatedly after BBB opening at defined time intervals up to 96 h in order to describe the fate of the fluorescent markers within this time. Two different control groups were evaluated in the same manner: (1) mice treated with intracarotid fluorescent dyes without BBB opening and (2) mice receiving HG without fluorescent markers (physiological saline).
After the last in vivo imaging procedure, the animals were euthanized, and the brains were removed from the skull. Immediately thereafter, fluorescence of the different brain areas was remeasured in the Optix™ ex vivo. For this purpose, the brain was dissected into the cerebellum, the right and the left hemisphere, positioned in a Petri dish and covered with Tissue-Tec™ (Sakura Finetek, Zoeterwoude, Netherlands) to prevent exsiccation. This procedure was performed to distinguish fluorescence originating from the brain and from extracerebral regions and to assign the brain fluorescence to the different anatomical regions.
In Vitro Imaging
For in vitro calculation of fluorescence and fluorescence lifetime of the protein-fluorochrome conjugates, 100 µl of tap water was applied onto a 1-cm2 piece of filter paper in a Petri dish. On the paper, 10 µl of Alexa Fluor 680 1D11 antibody diluted in NaCl 0.9% to a final concentration of 29 µg/10 µl was used for the measurements in the Optix™.
Data Analysis
Fluorescence intensity data obtained by microscopy were calculated using the Leica FW4000 image analysis program.
For in vivo imaging fluorescence intensity calculations, the program Optix OptiView was used. Intensity units were normalized for the same excitation power and excitation time per raster point (integration time). Normalized fluorescence intensities are presented in arbitrary units. An area of 28 mm2 (7 mm × 4 mm) approximately represents the region of one hemisphere of a mouse brain. In the measured data, a 28-mm2 area laid over the hemisphere (ex vivo) or over the region of interest (in vivo) was used for mean fluorescence intensity calculation in this regions.
For in vitro measurements and calculations, the region for calculation of mean fluorescence was laid over the middle of the filter paper. For lifetime calculations, the Levenberg–Marquard algorithm was used. The concentration depth tool of the software was used to calculate a three-dimensional distribution map of the fluorescence concentration. For this calculation, the absorption coefficient was set at 0.3 cm as it is in organic tissue and the scattering coefficient was set at 15 cm, which is expected in the brain.
Statistics were obtained with Sigma plot 3.5 software (Systat Software Inc.) t tests (p < 0.05) or Mann–Whitney rank sum tests.
Results
Microscopic Evaluation
Fluorescence in the brain of rats and mice was evaluated by microscopy after administration of fluorescence-linked agents in conjunction with intracarotid HG-mediated BBB opening in the right hemisphere. The low molecular weight fluorescent marker sodium fluorescein and the large marker RB200 γ-globulin were given intravenously 5 min after opening of the BBB by HG in rats. The intravenously injected substances crossed the BBB and entered the brain tissue of the hemisphere ipsilateral to the BBB opening (Fig. 1). The increased intensity of RB200 fluorescence in the HG-perfused brain regions indicates that significant amounts of the large γ-globulins entered the brain of the rats (Fig. 1b). To investigate the spatial distribution of the fluorescence markers, serial sections of the brains were analyzed. Tissue fluorescence was mainly increased in the lateral cortex of the forebrain, indicating the highest level of the permeabilizing effect of HG in this region. In the contralateral left hemisphere, fluorescence was detectable only within the lumina of the cerebral vessels, and no extravasation of fluorescence was detected. The spatial distribution of fluorescence obtained 10 min after BBB opening resembled the pattern described in earlier experiments using 1-O-pentylglycerol for BBB opening in conjunction with the fluorescent markers fluorescein sodium and RB200 albumin [14]. The fluorescence intensities detected in the central nervous system of rats after intracarotid infusion of the fluorescent markers was higher than in rats that received intravenous infusion of the markers (data not shown). These results are in accordance with earlier experiments using alkylglycerols and methotrexate resulting in higher concentrations of methotrexate in the brain when given as intracarotid infusion [14].
Fig. 1.
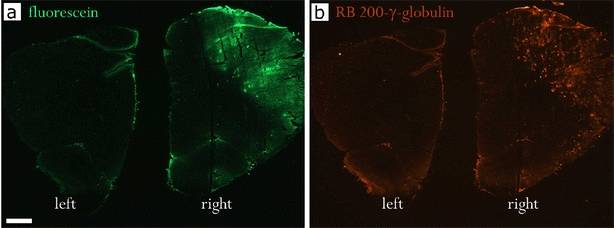
Spatial distribution of tissue fluorescence of fluorescein (a) and RB200 γ-globulin (b) in rat brain coronal sections after BBB opening with 100 mM HG. The brain was removed 10 min after i.v. administration of the fluorescent markers. More homogeneous tissue staining with the low molecular weight marker fluorescein as compared with RB200 γ-globulin. Right right hemisphere, ipsilateral to the BBB opening procedure with HG; left left hemisphere, contralateral non-treated hemisphere. Magnification 12.5-fold, bar = 1 mm.
In mice, the markers were infused via the intracarotid catheter 5 min after opening of the BBB. Tissue fluorescence was investigated 10 min (Fig. 2a, b) and 24 h after i.a. administration of RB200 γ-globulin in mice (Fig. 2c, d). After 24 h, ipsilateral tissue fluorescence was still significantly increased compared with the contralateral hemisphere. This shows that after initial extravasation, the protein marker remained within the brain (Table 2). The intracarotid injection of HG resulted in a strong increase in the transfer of both sodium fluorescein and RB200 γ-globulin to the ipsilateral brain tissue 10 min after BBB opening. Using sodium fluorescein, a bright and almost homogeneous staining in the ipsilateral brain was found 10 min after dye administration (data not shown). In contrast to this, RB200 γ-globulin showed a patchy inhomogeneous distribution in the brain tissue. Highest fluorescence was detected around BBB-opened cerebral vessels (Fig. 2b). Images obtained from animals euthanized 24 h after dye administration, however, revealed a homogeneous staining of the marker proteins reflecting a homogeneous distribution of the protein within the brain tissue probably due to diffusion (Fig. 2d).
Fig. 2.
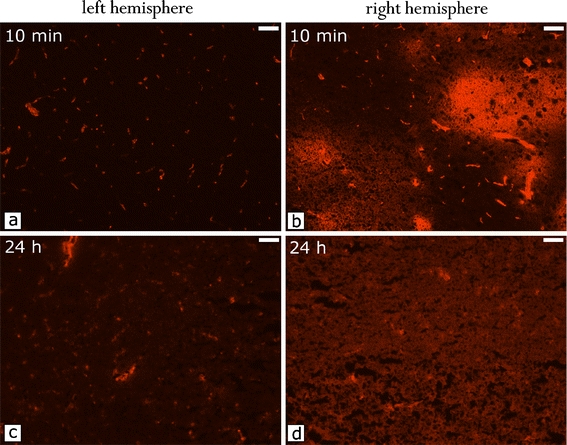
Time-dependent distribution of RB200 γ-globulin in the mouse brain after BBB opening with 100 mM HG. a Left hemisphere, 10 min after intraarterial RB200 γ-globulin; b right hemisphere, 10 min after intraarterial RB200 γ-globulin; c left hemisphere, 24 h after intraarterial RB200 γ-globulin; d right hemisphere, 24 h after intraarterial RB200 γ-globulin. The globulin is diffusing from next to the capillaries and distributing equally throughout the hemisphere within 24 h. (Photographs were taken under same conditions, magnification 200-fold, bar = 0.05 mm).
Table 2.
RB200 γ-globulin fluorescence intensity in the right and left hemisphere 10 min and 24 h after BBB opening with HG
| Time after dye administration | Right | Left |
|---|---|---|
| 10 min | 95.4 ± 9.3 | 49.5 ± 1.5 |
| 24 h | 58.1a ± 0.6 | 49.1a ± 0.3 |
n = 5 experiments
a t test right vs left, p < 0.001
In Vivo Imaging
In order to describe the intraindividual behavior of large markers in the brain after BBB opening in vivo, we investigated the intensity of globulin-coupled fluorescent dyes within the brain of healthy mice using optical imaging. Repeated imaging was performed under short anesthesia at different time points after treatment (up to 96 h). The fate of globulins was visualized by in vivo near-infrared fluorescence imaging.
In the HG- and Cy 5.5 γ-globulin-treated animals, high fluorescence intensities were detected in the right ipsilateral hemisphere reflecting high tissue concentrations of Cy 5.5 γ-globulin. Consistent with the results of microscopy, increased fluorescence in the right hemisphere could be detected after 9 h as well as 24 and 72 h after dye injection (Fig. 3a). The fluorescence intensity in the right brain seemed to increase within the first 9 h after BBB opening; however, there was no statistical significance. Thereafter, fluorescence intensity decreased slowly. Repeated measurements after infusion of Cy 5.5 γ-globulin showed an increased fluorescence signal in the right hemisphere up to 96 h in the HG-treated animals (Fig. 3b). In control animals without Cy 5.5 γ-globulin administration, no fluorescence was detected within the brain (Fig. 3b). After intracarotid infusion of Cy 5.5 γ-globulin without barrier opening (control 2), some brain tissue fluorescence was detectable. This is in accordance with the results of microscopy, showing intravascular fluorescence (Fig. 2). The fluorescence intensity in the right hemisphere was significantly higher in HG-treated animals (p < 0.05, t test), reflecting the HG-mediated transfer of the marker across the BBB. At the time point with maximum counts (after 9 h), the difference to control 2 amounted to 52,400 normalized counts (Fig. 3b). The fluorescence intensity ratio between right and left hemispheres was significantly higher in HG and Cy 5.5 γ-globulin-treated compared with Cy 5.5 γ-globulin-treated animals (t test: p < 0.005 for the groups 24 and 96 h; Mann–Whitney rank sum test: p < 0.05 for the groups 3, 6, 9, 48, and 72 h) (Fig. 3c).
Fig. 3.
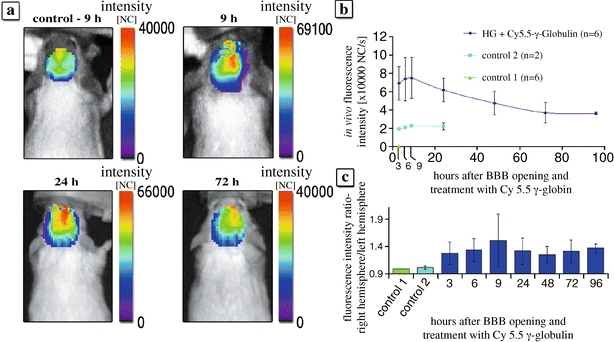
Fluorescence of Cy 5.5 γ-globulin in the brain of mice measured by time-domain optical imaging. a In vivo fluorescence intensity within the brain of control 2 and 9 h, 24 h and 72 h after BBB opening with 82.5 mM HG followed by i.c. Cy 5.5 γ-globulin. Note the high intensity in the right (treated) hemisphere. b Time course of fluorescence intensity after the BBB opening with 82.5 mM HG followed by intracarotid infusion of 8 mg Cy 5.5 γ-globulin. Fluorescence was measured over the right hemisphere at different time points. The normalized counts represent average fluorescence intensity of a 28-mm2 area located over the right hemisphere. Dark blue BBB opening with 82.5 mM HG followed by i.c. infusion of Cy 5.5 γ-globulin (n = 6). Green control 1: BBB opening with 82.5 mM HG followed by intravenous infusion of physiological saline (n = 6). Blue control 2: intracarotid bolus of physiological saline followed by i.c. infusion of Cy 5.5 γ-globulin (n = 2). c Right to left hemisphere fluorescence intensity ratio in control 1, control 2, and at different time points after BBB opening with 82.5 mM HG followed by i.c. Cy 5.5 γ-globulin (p < 0.05) for every time point compared with control 2.
A signal depth reconstruction of the dye concentration in the brain 6 h after treatment with HG localizes the fluorescence signal 2 to 5 mm under the scull surface. This equals the depth, where the brain tissue is located in the mouse. In control experiments, low concentrations of the fluorescent marker were found around the midline of the brain (data not shown).
Ex Vivo Imaging
Specificity of the fluorescence signal was verified by both ex vivo measurement of the fluorescence intensity within the brain and in vivo detection of specific lifetime of Cy 5.5 γ-globulin. Intracerebral injection of γ-globulin-coupled Cy 5.5 revealed a lifetime of 1.45 ns. There was a low auto-fluorescence of the head of control animals with a lifetime of 0.51 ns (data not shown). These results proved that the fluorescence signals in the brain detected by the optical imaging system after BBB opening came from globulin-coupled dyes.
To verify whether the fluorescence signal originated from the brain tissue, we have performed ex vivo imaging of the different brain regions after removing the brain. The highest fluorescence intensities were found in the right hemisphere of HG-treated mice as compared with controls 1 and 2 (Fig. 4). The right to left hemisphere ratio amounted to 3.65 after 9 h, 4.63 after 24 h, 5.75 after 72 h, and 3.62 after 96 h (Fig. 4b). These were higher than the ratios calculated from the in vivo data. The lifetime of the fluorescence detected was specific to γ-globulin-coupled Cy 5.5 (not shown). These data confirmed that the fluorescence detected by in vivo imaging originated from Cy 5.5 in the brain tissue. The ex vivo fluorescence intensity ratio gave evidence of a slower decrease of Cy 5.5 γ-globulin concentration from the right compared with the left hemisphere of the brain tissue during the first 72 h after BBB opening.
Fig. 4.
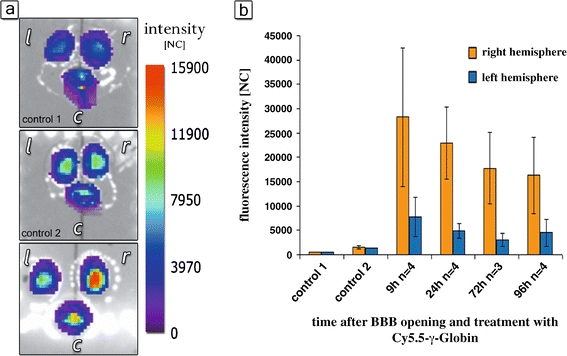
Ex vivo fluorescence of Cy 5.5 γ-globulin in the brain measured by time-domain optical imaging. a Imaging of the brain 24 h after treatment (r right hemisphere, l left hemisphere, c cerebellum). Control 1: HG + physiological saline. Low auto-fluorescence. Control 2: intracarotid physiological saline plus 8 mg Cy 5.5 γ-globulin. Low fluorescence within all brain regions. BBB opening with 82.5 mM HG and intracarotid infusion of 8 mg Cy 5.5 γ-globulin: highest intensity of Cy 5.5-mediated fluorescence within the right hemisphere. b Fluorescence intensity at different time points after BBB opening with HG in the right (red) and left hemisphere (blue). The counts represent normalized average fluorescence intensity of a 28-mm2 area over the right and left hemisphere, respectively. Control 1: BBB opening with HG followed by infusion of physiological saline. Control 2: intracarotid bolus injection of physiological saline followed by infusion of Cy 5.5 γ-globulin.
Alexa Fluor 680 1D11 Imaging
In a second experimental series, a potentially biologically active protein, Alexa Fluor 680 1D11 antibody, was used. To evaluate the stability of the binding of 1D11 antibody to the fluorochrome, the fluorescence intensity and lifetime of the marker were investigated in vitro up to 72 h. There was neither a decrease in fluorescence intensity nor a change of the lifetime of the marker during the experimental period (Fig. 5).
Fig. 5.
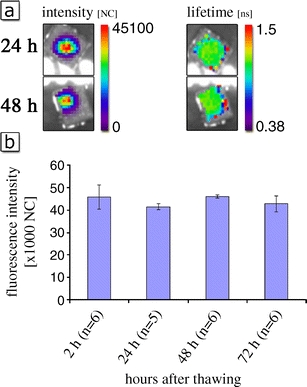
Fluorescence intensity and lifetime of equal amounts of Alexa Fluor 680 1D11 antibody. a Measurements were performed using eXplore Optix TM in vitro 2 h and 48 h after thawing. The solution was kept at room temperature between the measurements. No change of lifetime under in vitro conditions. b Time course of fluorescence intensity of 1D11 antibody in vitro. Fluorescence intensity of 0.2 mg/ml 1D11 antibody was measured using time-domain optical imaging at different time points, n = 6 independent experiments (t test: p = 0.329 between the groups 2 and 72 h).
In vivo treatment of mice with Alexa Fluor 680 1D11 antibody (intracarotid infusion of 100 µl, 2 mg/ml) after BBB opening with intracarotid HG (300 µl, 82.5 mM) resulted in an increase in fluorescence intensity in the ipsilateral right hemisphere (Fig. 6). The effect was comparable with the experiments performed with Cy 5.5 γ-globulin. The ex vivo evaluation of fluorescence intensity 6 h after BBB opening showed a 1.9-fold higher fluorescence intensity within the right hemisphere compared with the non-treated left hemisphere (data not shown).
Fig. 6.
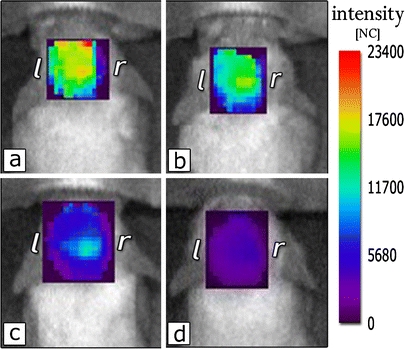
Normalized fluorescence intensity of Alexa Fluor 680 1D11 antibody in the brain in vivo. 6 (a), 9 (b), 24 (c), and 72 h (d) after HG-mediated BBB opening.
Discussion
The transfer, local distribution, and the fate of γ-globulins within the brain of healthy rats and mice were investigated after BBB opening with HG, a short chain alkylglycerol derivative. HG causes a transient permeabilization of the brain’s microvasculature [14]. Significant amounts of the administered globulins were found in the right brain hemisphere of healthy mice when administered after BBB opening. Cy 5.5 γ-globulin was given at high doses (8 mg/100 µl) to evaluate feasibility of in vivo optical imaging of proteins in the brain of mice, whereas Alexa Fluor 680 1D11 antibody, as a potentially therapeutic antibody, was infused at putative therapeutic doses (0.12 mg/100 µl). The intracarotid infusion of the marker proteins in conjunction with HG-mediated BBB opening resulted in a significant increase in the delivery of both Cy 5.5 γ-globulin and Alexa Fluor 680 1D11 antibody to the ipsilateral brain of the mice. Thus, the delivery of proteins into the brain for treatment of central nervous system diseases using alkylglycerol-induced BBB opening is feasible in an experimental mouse model.
The fluorescence was detectable as well in the brains in vivo as in the dissected brains ex vivo. There was a high interindividual variability in fluorescence intensity within the ipsilateral right brain after HG treatment. Such variances in brain penetration of co-administered drugs resulted from the different extent of BBB opening by HG as described in recent studies using alkylglycerols for BBB permeabilization [13, 14]. Regarding the other brain regions, low Cy 5.5-related fluorescence was found in the contralateral left hemisphere and the cerebellum (Fig. 3a). In vivo, there was a lower fluorescence intensity ratio between right and left hemisphere than ex vivo. This phenomenon has recently also been reported by others [24]. Reduction of the fluorescence intensity by the scull between fluorescing dye in the brain and detector can be a reason for this phenomenon. Furthermore, there can be blooming from the right to the left side of the brain. To prevent this, the ex vivo measurements were performed after segmentation of the brains to cerebellum, right and left hemisphere. To prevent differences in fluorescence intensities between the brains due to different perfusion quality, animals were not perfused. The lower fluorescence intensity in the contralateral left hemisphere shows that increased fluorescence intensity in the right hemisphere cannot have its origin from the fluorescing agent in the blood.
The analyses of fluorescence intensities of the marker proteins within the first hours after drug administration confirmed the data obtained from standard fluorescence microscopy. A strong alkylglycerol-mediated penetration of the labeled globulins was found in the treated (ipsilateral) hemisphere. The microscopic images also showed that the fluorescence detected by in vivo imaging originated from the marker drugs within the brain tissue. Extravasation and brain tissue staining by the labeled globulins was found by conventional fluorescence microscopy and in vivo optical imaging. High-resolution fluorescence microscopy yielded additional information on the local distribution of the labeled proteins in the different brain areas. Microscopy showed a homogeneous distribution of the markers within the alkylglycerol treated brain tissue 24 h after administration of the dyes, whereas shortly after the injection, the antibodies were found mainly around the capillaries. In contrast, small molecules like sodium fluorescein showed a rapid and homogeneous distribution in the brain tissue.
The integrity of the BBB can be effected by anesthetic agents. In hyperosmolar BBB disruption, the effect of various anesthetic agents was evaluated [25]. In contrast to methoxyflurane or fentanyl-droperidol, ketamine/xylazine anesthesia led to a good hyperosmolar-induced BBB disruption. For our BBB opening procedure, ketamine/xylazine was used. For alkylglycerols, the influence of the anesthetic agent was not further investigated. Despite this, in these experiments, a clip was applied to the common carotid artery prior to HG infusion. It was shown by Fortin et al. [26] that this procedure isolates the cerebral circulation from the depressant hemodynamic effects of ketamine/xylazine. Thus, the opening of the BBB is not effected by anesthesia.
In previous studies, it was shown that albumin enters the brain tissue after co-administration with 1-O-pentylglycerol [13]. However, compared with 1-O-pentylglycerol and other short chain alkylglycerols, HG offers more favorable pharmacodynamic properties, in particular a well-defined time window for drug administration [14]. Using HG for BBB opening, the drug of interest could be delivered as short-term infusion several minutes after the permeabilizing procedure [13]. This is of interest in view of both the use in experimental animal models and the putative therapeutic use for human diseases. Thus, the long-lasting HG-mediated delivery of potentially therapeutic proteins in the present study may offer new options in the treatment of brain disorders.
In the HG-treated animals, elevated fluorescence of Cy 5.5 γ-globulin was detected within the ipsilateral brain throughout the entire observation period up to 96 h. Increased brain tissue fluorescence was also found up to 72 h after infusion of Alexa Fluor 680 1D11 antibody, which was given at significantly lower doses (1.5% compared with Cy 5.5 γ-globulin). In the past, γ-globulins have been shown to enter the brain after osmotic BBB disruption using hyperosmolar mannitol. In experiments using mannitol 25% and iodinated antibodies, I-125 radioactivity in the brain increased during the first hour, remained high during the next 23 h, and showed a rapid decline until 72 h post-injection [27]. In dogs, co-injected Evans blue could be found in the brain even 52 days after osmotic BBB disruption [28]. This method was already successfully tested in humans, but the use is restricted to a few clinics only. Recently, sodium caprate has been reported to lead to a reversible BBB opening in vitro [29] and in vivo [28]. However, after intracarotid infusion, severe brain edema was seen at higher doses and a temporary hypertensive response produced by intracarotid caprate infusion complicate the use of sodium caprate as permeabilizing agent [30].
The near-infrared in vivo imaging system detects Cy 5.5 fluorescence. Alexa Fluor 680 has a comparable emission spectrum as Cy 5.5 and can be detected using the same analyzing system laser. Fluorescence intensity and fluorescence lifetime of Cy 5.5 γ-globulin and Alexa Fluor 680 1D11 antibody were sequentially evaluated in vivo by near-infrared optical imaging in mice. Simultaneous detection of intensity and lifetime at different time points after thawing showed that the brain’s fluorescence measured in our experiments originated from the coupled dyes and that the fluorescence intensity of the protein-coupled dye does not decrease over time. However, fluorescence intensity cannot be compared between the experiments. After protein binding, the Alexa Fluor 680 has a higher fluorescence than Cy 5.5 [31].
In summary, HG was shown to offer new options for the transport of proteins across the BBB into the central nervous system, e.g., for the treatment of central nervous system diseases with specific antibodies. In vivo near-infrared fluorescence optical imaging is suited to visualize fluorescence of near-infrared fluorescence probes as Cy 5.5 and Alexa Fluor 680 in the brain of mice after BBB opening. Thus, the HG-mediated delivery of proteins into the brain in conjunction with the use of optical imaging represents a new and well-feasible experimental tool to investigate pharmacokinetics of therapeutic proteins in mice models with central nervous system diseases.
Acknowledgments
We thank Genzyme Corp. for providing financial support, the HG and 1D11 antibody. Furthermore, we thank Mrs. Thi Hoang-Hoa Nguyen for excellent technical assistance. We dedicate this work to her due to her sudden and unforeseen death during the preparation of this manuscript.
Open Access
This article is distributed under the terms of the Creative Commons Attribution Noncommercial License which permits any noncommercial use, distribution, and reproduction in any medium, provided the original author(s) and source are credited.
Footnotes
The article shows the possibility to visualize antibodies in the brain of mice by near-infrared imaging after opening of the blood–brain barrier with 2-O-hexyldiglycerol.
References
- 1.Patel MM, Goyal BR, Bhadada SV, Bhatt JS, Amin AF. Getting into the brain: approaches to enhance brain drug delivery. CNS Drugs. 2009;23:35–58. doi: 10.2165/0023210-200923010-00003. [DOI] [PubMed] [Google Scholar]
- 2.Banks WA. Delivery of peptides to the brain: emphasis on therapeutic development. Biopolymers. 2008;90:589–594. doi: 10.1002/bip.20980. [DOI] [PubMed] [Google Scholar]
- 3.Deli MA. Potential use of tight junction modulators to reversibly open membranous barriers and improve drug delivery. Biochem Biophys Acta. 2008;1788:892–910. doi: 10.1016/j.bbamem.2008.09.016. [DOI] [PubMed] [Google Scholar]
- 4.Golden PL, Pollack GM. Blood–brain barrier efflux transport. J Pharm Sci. 2003;92:1739–1753. doi: 10.1002/jps.10424. [DOI] [PubMed] [Google Scholar]
- 5.Neuwelt EA, Barnett EA, McCormick CI, et al. Osmotic blood–brain barrier modification: monoclonal antibody, albumin, and methotrexate delivery to cerebrospinal fluid and brain. Neurosurgery. 1985;17:419–423. doi: 10.1227/00006123-198509000-00004. [DOI] [PubMed] [Google Scholar]
- 6.Rapoport SI. Osmotic opening of the blood–brain barrier: principles, mechanisms, and therapeutic applications. Cell Mol Neurobiol. 2000;20:217–230. doi: 10.1023/A:1007049806660. [DOI] [PMC free article] [PubMed] [Google Scholar]
- 7.Doolittle ND, Miner ME, Hall WA, et al. Safety and efficacy of a multicenter study using intraarterial chemotherapy in conjunction with osmotic opening of the blood–brain barrier for the treatment of patients with malignant brain tumors. Cancer. 2000;88:637–647. doi: 10.1002/(SICI)1097-0142(20000201)88:3<637::AID-CNCR22>3.0.CO;2-Y. [DOI] [PubMed] [Google Scholar]
- 8.Reardon DA, Rich JN, Friedmann HS, Bigner DD. Recent advances in the treatment of malignant astrocytoma. J Clin Oncol. 2006;24:1253–1265. doi: 10.1200/JCO.2005.04.5302. [DOI] [PubMed] [Google Scholar]
- 9.Kreuter J. Influence of the surface properties on nanoparticle-mediated transport of drugs to the brain. J Nanosci Nanotechnol. 2004;4:484–488. doi: 10.1166/jnn.2003.077. [DOI] [PubMed] [Google Scholar]
- 10.Borlongan CV, Emerich DF. Fascilitation of drug entry into the central nervous system via transient permeation of blood brain barrier: laboratory and preliminary clinical evidence from bradikinin receptor agonist, Cereport. Brain Res Bull. 2003;60:297–306. doi: 10.1016/S0361-9230(03)00043-1. [DOI] [PubMed] [Google Scholar]
- 11.Warren K, Jakacki R, Widemann B, et al. Phase II trial of intravenous lobradimil and carboplatin in childhood brain tumors: a report from the Children’s Oncology Group. Cancer Chemother Pharmacol. 2006;58:343–347. doi: 10.1007/s00280-005-0172-7. [DOI] [PubMed] [Google Scholar]
- 12.Fellner F, Bauer B, Miller DS, et al. Transport of paclitaxel (Taxol) across the blood–brain barrier in vitro and in vivo. J Clin Invest. 2002;110:1309–1318. doi: 10.1172/JCI15451. [DOI] [PMC free article] [PubMed] [Google Scholar]
- 13.Erdlenbruch B, Alipour M, Fricker G, et al. Alkylglycerol opening of the blood–brain barrier to small and large fluorescence markers in normal and C6 glioma-bearing rats and isolated rat brain capillaries. Br J Pharmacol. 2003;140:1201–1210. doi: 10.1038/sj.bjp.0705554. [DOI] [PMC free article] [PubMed] [Google Scholar]
- 14.Erdlenbruch B, Schinkhof C, Kugler W, et al. Increased administration of short-chain alkylglycerols for increased delivery of methotrexate to the rat brain. Br J Pharmacol. 2003;139:685–694. doi: 10.1038/sj.bjp.0705302. [DOI] [PMC free article] [PubMed] [Google Scholar]
- 15.Gurfinkel M, Ke S, Wen X, et al. Near-infrared fluorescence optical imaging and tomography. Dis Markers. 2003;19:107–121. doi: 10.1155/2004/474818. [DOI] [PMC free article] [PubMed] [Google Scholar]
- 16.Wessels JT, Busse AC, Mahrt J, et al. In vivo imaging in experimental preclinical tumor research—a review. Cytom A. 2007;71:542–549. doi: 10.1002/cyto.a.20419. [DOI] [PubMed] [Google Scholar]
- 17.Abulrob A, Brunette E, Slinn J, et al. In vivo time domain optical imaging of renal ischemia-reperfusion injury: discrimination based on fluorescence lifetime. Mol Imaging. 2007;6:304–314. [PubMed] [Google Scholar]
- 18.Klein B, Kuschinsky W, Schröck H, Vetterlein F. Interdependency of local capillary density, blood flow, and metabolism in rat brains. Am J Physiol. 1986;251(6 Pt 2):H1333–H1340. doi: 10.1152/ajpheart.1986.251.6.H1333. [DOI] [PubMed] [Google Scholar]
- 19.Keren S, Gheysens O, Levin CS, Gambhir SS. A comparison between a time domain and continuous wave small animal optical imaging system. IEEE Trans Med Imaging. 2008;27:58–63. doi: 10.1109/TMI.2007.902800. [DOI] [PMC free article] [PubMed] [Google Scholar]
- 20.Kumar ATN, Raymond SB, Dunn AK, et al. A time domain fluorescence tomography system for small animal imaging. IEEE Trans Med Imaging. 2008;27:1152–1163. doi: 10.1109/TMI.2008.918341. [DOI] [PMC free article] [PubMed] [Google Scholar]
- 21.McCormack E, Micklem DR, Pindard LE, et al. In vivo optical imaging of acute myeloid leukemia by green fluorescent protein: time-domain autofluorescence decoupling, fluorophore quantification, and localization. Mol Imaging. 2007;6:193–204. [PubMed] [Google Scholar]
- 22.Ma G, Gallant P, McIntosh L. Sensitivity characterization of a time-domain fluorescence imager: eXplore Optix. Appl Opt. 2007;46:1650–1657. doi: 10.1364/AO.46.001650. [DOI] [PubMed] [Google Scholar]
- 23.Bloch S, Lesage F, McIntosh L, et al. Whole-body fluorescence lifetime imaging of a tumor-targeted near-infrared molecular probe in mice. J Biomed Opt. 2005;10:054003. doi: 10.1117/1.2070148. [DOI] [PubMed] [Google Scholar]
- 24.Zhou H, Luby-Phelps K, Mickey BE, Habib AA, Mason RP, Zhao D. Dynamic near-infrared optical imaging of 2-deoxyglucose uptake by intracranial glioma of athymic mice. PLoS One. 2009;4(11):e8051. doi: 10.1371/journal.pone.0008051. [DOI] [PMC free article] [PubMed] [Google Scholar]
- 25.Gumerlock MK, Neuwelt EA. The effects of anesthesia on osmotic blood–brain barrier disruption. Neurosurgery. 1990;26:268–277. doi: 10.1097/00006123-199002000-00014. [DOI] [PubMed] [Google Scholar]
- 26.Fortin D, Adams R, Gallez A. A blood–brain barrier disruption model eliminating the hemodynamic effect of ketamine. Can J Neurol Sci. 2004;31:248–253. doi: 10.1017/s0317167100053890. [DOI] [PubMed] [Google Scholar]
- 27.Neuwelt EA, Barnett PA, Hellstrom I, et al. Delivery of melanoma-associated immunoglobulin monoclonal antibody and Fab fragments to normal brain utilizing osmotic blood–brain barrier modification. Cancer Res. 1988;48:4725–4729. [PubMed] [Google Scholar]
- 28.Neuwelt EA, Glasberg M, Frenkel E, Barnett P. Neurotoxicity of chemotherapeutic agents after blood–brain barrier modification: neuropathological studies. Ann Neurol. 1983;14:316–324. doi: 10.1002/ana.410140310. [DOI] [PubMed] [Google Scholar]
- 29.Preston E, Slinn J, Vinokourov I, Stanimirovic D. Graded reversibile opening of the rat blood–brain barrier by intracarotid infusion of sodium caprate. J Neurosci Meth. 2008;168:443–449. doi: 10.1016/j.jneumeth.2007.11.004. [DOI] [PubMed] [Google Scholar]
- 30.Sugibayashi K, Onuki Y, Takayama K. Displacement of tight junction proteins from detergent-resistant membrane domains by treatment with sodium caprate. Eur J Pharm Sci. 2008;36:246–253. doi: 10.1016/j.ejps.2008.09.011. [DOI] [PubMed] [Google Scholar]
- 31.Berlier JE, Rothe A, Buller G, et al. Quantitative comparison of long-wavelength Alexa Fluor dyes to Cy dyes: fluorescence of the dyes and their bioconjugates. J Histochem Cytochem. 2003;51:1699–1712. doi: 10.1177/002215540305101214. [DOI] [PubMed] [Google Scholar]