Abstract
Summary: The top-scoring pair (TSP) and top-scoring triplet (TST) algorithms are powerful methods for classification from expression data, but analysis of all combinations across thousands of human transcriptome samples is computationally intensive, and has not yet been achieved for TST. Implementation of these algorithms for the graphics processing unit results in dramatic speedup of two orders of magnitude, greatly increasing the searchable combinations and accelerating the pace of discovery.
Availability: http://www.igb.illinois.edu/labs/price/downloads/.
Contact: ndprice@illinois.edu
Supplementary information: Supplementary data are available at Bioinformatics online.
1 INTRODUCTION
Rapidly improving technologies have made large amounts of gene expression data available for analysis and classification. The NCBI Gene Expression Omnibus (GEO) database contains hundreds of thousands of samples representing a wide range of diseased and healthy tissue for which gene expression has been measured. As next-generation RNA sequencing technology (Cloonan et al., 2008) becomes ubiquitous, GEO and other databases will further increase in size and accuracy of information. Researchers have sought to use this expression data to identify distinct gene relationships that classify disease states, allowing for accurate diagnosis of diseases given the expression patterns of a few genes. Such methods include support vector machines (Brown et al., 2000), decision trees (Zhang et al., 2003) and neural networks (Khan et al., 2001). The top-scoring pair (TSP) algorithm and its variants have demonstrated similar accuracies to these methods while remaining relatively simple, resistant to overfitting and consistent across data normalization methods (Geman et al., 2004; Lin et al., 2009; Price et al., 2007; Tan et al., 2005). Classifiers identified using these algorithms have been used to predict cancer outcomes and model disease progression (Eddy et al., 2010). Despite these advantages, the TSP and especially the top-scoring triplet (TST) algorithm are computationally intensive and therefore slow. Because increasing the accuracy of predictions may require analysis of thousands of samples across tens of thousands of transcripts, it is important to improve the speed of these algorithms. Faster algorithms also enable more comparisons to be made, including automated data mining across many sample sets.
While primarily known for gaming applications, the graphics processing unit (GPU) is increasingly applied to computationally challenging scientific problems including molecular dynamics simulations (Stone et al., 2010), quantum chemistry (Ufimtsev and Martinez, 2008), and medical imaging (Stone et al., 2008). The GPU is designed for massive parallelism involving thousands of simultaneous executing threads, but requires different coding than that which runs on CPUs. Algorithms well suited for such parallelism can run tens to hundreds of times faster on GPUs than a corresponding CPU implementation. GPUs are also now widely available to researchers via National Center for Supercomputing Applications (NCSA) clusters and businesses such as Amazon Web Services EC2 Cloud Computing. Here, we present implementations of the TSP algorithm and the TST algorithm on the GPU. As the TST algorithm is particularly computationally demanding, this GPU implementation enables the first comprehensive search of all possible TSTs for classification.
2 ALGORITHMS
Given two classes of samples C = {C1, C2} with expression values for N genes {x1,…, xN}, the TSP algorithm identifies the marker gene pair (xi, xj) in which the TSP score
is maximized. The algorithm performs all pairwise comparisons between the genes of the dataset and calculates the TSP score for each, then selects the maximum or set of maximum scores. Multiple pairs may then be combined to improve classification (Tan et al., 2005). The TSP algorithm exhibits O(N2) time complexity.
The TST algorithm extends the TSP algorithm to triplets of genes (Lin et al., 2009). The TST algorithm is calculated similarly to TSP: all possible triplets of gene ranks are compared, and the probabilities of each permutation within each triplet are calculated and scored. The algorithm finds the maximum TST score from all triplets in O(N3) time complexity. Extended details of both algorithms can be found in the Supplementary Material.
3 METHODS
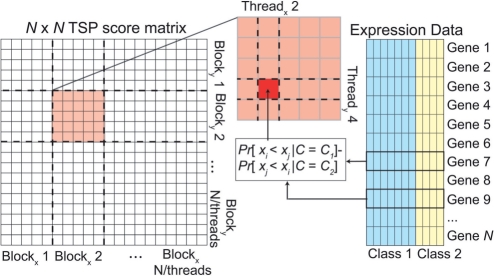
Modern (compute 1.2 and higher) NVIDIA CUDA GPU architectures contain multiple (2–30) streaming multiprocessors (SM), each consisting of multiple cores. Each core can execute one floating point or integer instruction per clock cycle in parallel with all other cores of that SM. Programming this device involves organizing executing code into threads; each thread is executed by a single core, and runs in parallel with all other threads currently being executed on the SM. The GPU implements the single instruction, multiple data (SIMD) design: each parallel thread in a multiprocessor executes the same instruction simultaneously, but on different data. Threads are logically organized into thread blocks, which map loosely onto each streaming multiprocessor. The TSP and TST algorithms exhibit characteristics that make them ideal for a GPU implementation: there is no data dependence between individual scores; therefore each score may be calculated in parallel (Fig. 1). Detailed descriptions of the implementation of these algorithms on the GPU are in the Supplementary Material.
Fig. 1.
Logical organization of the TSP algorithm on the GPU. Each portion of the output TSP matrix is calculated independently of the others by each thread block. Each thread outputs a single element of the TSP matrix.
4 RESULTS
The algorithms described above have been implemented in C with CUDA extensions and compiled into MEX files for use within the MATLAB computing environment; a standalone application is also available. Two existing CPU implementations of the TSP algorithm, tspair (Leek, 2009) and RXA (Lin et al., 2009) were used for speed comparisons with the GPU code. One existing CPU implementation of the TST algorithm (RXA) was used for speed comparisons. Both CPU software packages are implemented in the C programming language as packages for the statistical environment R. All CPU speed tests were performed on an Intel Xeon x5680 3.33 GHz 6-core processor. The GPU tests were performed on a NVIDIA Tesla T10 and an NVIDIA GeForce GTX480. Source code and executables for all GPU implementations are available at http://www.igb.illinois.edu/labs/price/downloads/.
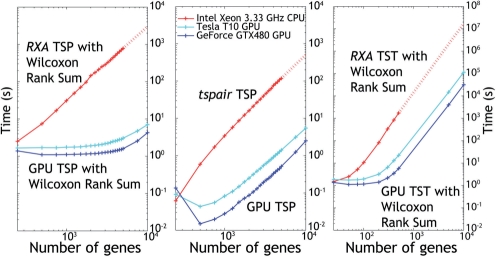
Figure 2 shows the results of the running time comparisons. The results for RXA and tspair are plotted separately due to the fact that RXA implements the Wilcoxon rank sum test to filter for only the most differentially expressed genes, whereas tspair does not. As the number of genes increases, the speedup on the GPU improves, therefore further speedup might be expected for larger tests. All GPU timings include the device data transfer as well as computation times. The Tesla T10 executes the algorithms 77X to 255X faster than the corresponding CPU implementations, and the GTX480 executes the algorithms 228X to 455X faster. Processing 10 000 genes on the CPU version of the TST algorithm would take over 6.5 months, while the GPU implementation of the TST algorithm on this dataset was completed in <9 h. Using the GPU enables the discovery of accurate marker gene pairs and triplets that are infeasible with the CPU implementations, while also allowing more stringent error estimation methods than are currently possible due to previous computational time constraints.
Fig. 2.
Plot of RXA TSP algorithm versus GPU implementation (left). Both algorithms filter for most differentially expressed genes using the Wilcoxon rank-sum test. Maximum speedup is 255X (Tesla T10) and 455X (GTX480). Plot of tspair TSP algorithm versus GPU implementation. Maximum speedup is 83X (Tesla T10) and 228X (GTX480) (center). Plot of RXA TST algorithm versus GPU implementation. Maximum speedup is 77X (Tesla T10) and 301X (GTX480) (right). The dataset used had 350 samples in Class 1 and 306 samples in Class 2. All data points are the mean of three independent runs of the software. Dotted lines indicate extrapolation from previous data points using a quadratic (TSP) or cubic (TST) polynomial fit.
Supplementary Material
ACKNOWLEDGEMENTS
The authors acknowledge the National Center for Supercomputing Applications (NCSA) AC cluster for CPU and GPU speed tests.
Funding: National Institutes of Health Howard Temin Pathway to Independence Award in Cancer Research; the Grand Duchy of Luxembourg; the Roy J. Carver Charitable Trust.
Conflict of Interest: none declared.
REFERENCES
- Brown MP, et al. Knowledge-based analysis of microarray gene expression data by using support vector machines. Proc. Natl Acad. Sci. USA. 2000;97:262–267. doi: 10.1073/pnas.97.1.262. [DOI] [PMC free article] [PubMed] [Google Scholar]
- Cloonan N, et al. Stem cell transcriptome profiling via massive-scale mRNA sequencing. Nat. Methods. 2008;5:613–619. doi: 10.1038/nmeth.1223. [DOI] [PubMed] [Google Scholar]
- Eddy JA, et al. Relative expression analysis for molecular cancer diagnosis and prognosis. Technol. Cancer Res. Treat. 2010;9:149–159. doi: 10.1177/153303461000900204. [DOI] [PMC free article] [PubMed] [Google Scholar]
- Geman D, et al. Classifying gene expression profiles from pairwise mRNA comparisons. Stat. Appl. Genet. Mol. Biol. 2004;3 doi: 10.2202/1544-6115.1071. Article19. [DOI] [PMC free article] [PubMed] [Google Scholar]
- Khan J, et al. Classification and diagnostic prediction of cancers using gene expression profiling and artificial neural networks. Nat. Med. 2001;7:673–679. doi: 10.1038/89044. [DOI] [PMC free article] [PubMed] [Google Scholar]
- Leek JT. The tspair package for finding top scoring pair classifiers in R. Bioinformatics. 2009;25:1203–1204. doi: 10.1093/bioinformatics/btp126. [DOI] [PMC free article] [PubMed] [Google Scholar]
- Lin X, et al. The ordering of expression among a few genes can provide simple cancer biomarkers and signal BRCA1 mutations. BMC Bioinformatics. 2009;10:256. doi: 10.1186/1471-2105-10-256. [DOI] [PMC free article] [PubMed] [Google Scholar]
- Price ND, et al. Highly accurate two-gene classifier for differentiating gastrointestinal stromal tumors and leiomyosarcomas. Proc. Natl Acad. Sci. USA. 2007;104:3414–3419. doi: 10.1073/pnas.0611373104. [DOI] [PMC free article] [PubMed] [Google Scholar]
- Stone JE, et al. GPU-accelerated molecular modeling coming of age. J. Mol. Graph Model. 2010;29:116–125. doi: 10.1016/j.jmgm.2010.06.010. [DOI] [PMC free article] [PubMed] [Google Scholar]
- Stone SS, et al. Accelerating advanced MRI reconstructions on GPUs. J. Parall. Dist Comput. 2008;68:1307–1318. doi: 10.1016/j.jpdc.2008.05.013. [DOI] [PMC free article] [PubMed] [Google Scholar]
- Tan AC, et al. Simple decision rules for classifying human cancers from gene expression profiles. Bioinformatics. 2005;21:3896–3904. doi: 10.1093/bioinformatics/bti631. [DOI] [PMC free article] [PubMed] [Google Scholar]
- Ufimtsev IS, Martinez TJ. Graphical processing units for quantum chemistry. Comput. Sci. Eng. 2008;10:26–34. [Google Scholar]
- Zhang H, et al. Cell and tumor classification using gene expression data: construction of forests. Proc. Natl Acad. Sci. USA. 2003;100:4168–4172. doi: 10.1073/pnas.0230559100. [DOI] [PMC free article] [PubMed] [Google Scholar]
Associated Data
This section collects any data citations, data availability statements, or supplementary materials included in this article.


