

Abstract
In this paper, we report on a study that investigated the feasibility of reliably visualizing high-intensity focused ultrasound (HIFU) lesion boundaries using axial-shear strain elastograms (ASSE). The HIFU-induced lesion cases used in the present work were selected from data acquired in a previous study. The samples consisted of excised canine livers with thermal lesions produced by an MR-compatible HIFU system (GE Medical System, Milwaukee, WI) and were cast in a gelatin block for elastographic experiment. Both single and multiple HIFU-lesion samples were investigated. For each of the single lesion sample, the lesion boundaries were determined independently from the axial strain elastogram (ASE) and ASSE at various iso-intensity contour thresholds (from −2dB to −6dB), and the area of the enclosed lesion was computed. For samples with multiple lesions, the corresponding ASSE was analyzed for identifying any unique axial-shear strain zones of interest. We further performed Finite Element Modeling (FEM) of simple two inclusion cases to verify if the in-vitro ASSE obtained were reasonable. The results show that the estimation of the lesion area using ASSE is less sensitive to iso-intensity threshold selection- making this method more robust compared to ASE-based method. For multiple lesion case, it was shown that ASSE enables high-contrast visualization of a ‘thin’ untreated region in between multiple fully-treated HIFU-lesions. This contrast visualization was also noticed in the FEM predictions. In summary, the results demonstrate that it is feasible to reliably visualize HIFU lesion boundaries using ASSE.
Keywords: Ablation, Axial strain, Axial-shear strain, Boundary, Breast, Elastography, Finite Element, HIFU, Lesion, Noninvasive, Tumor, Ultrasound
INTRODUCTION
High intensity focused ultrasound (HIFU) has become a promising noninvasive technique to thermally ablate and destroy volume of tissue lying deep under the skin surface (Lele 1967, Hill and ter Harr 1995). HIFU technique is synonymously used for focused ultrasound surgery (FUS), which was first investigated and described for neurosurgical applications about five decades ago (Lynn and Putnam 1944; Fry et al. 1950). In the last few decades, the HIFU technique has found several applications that include, among others, ablation of tumors in prostate (Sanghvi et al. 1999, Foster et al. 1993, Gelet et al. 1993) and other organs (Coleman et al. 1985, Vallancien et al. 1993, Vaezy et al. 2001, Hynynen et al. 2001). The success of the HIFU procedure required that the progress of the treatment be accurately visualized. This was a major challenge until the late 1970s, as there was no reliable imaging modality for the purpose. In the last two decades magnetic resonance imaging (MRI)-based methods as well as ultrasound (US)-based methods have been investigated for monitoring the HIFU treatment.
MRI methods used for monitoring and guiding HIFU therapy have utilized the real-time tracking of the resulting temperature elevation in the target region (cf. Cline et al. 1995, Hynynen et al. 1996) to visualize the thermal damage (referred to as a HIFU lesion). Though MRI has proven to be quite capable of imaging HIFU-lesions, it has several drawback and limitations. Most notably, MRI is expensive, not portable and may not be suitable for some populations, such as those with pacemakers, pregnant women, children or large patients.
The desire to have a unified system for HIFU treatment and inexpensive real-time lesion visualization has fueled research on several ultrasound based methodologies. However, the extent of the HIFU lesion is difficult to quantify with current B-mode imaging (sonography) techniques because of lack of contrast between lesion and normal tissue boundaries, as well as shadows that limit the entire view of the lesion. Bush et al. (1993) reported that there was a significant increase in the speed of sound and attenuation associated with HIFU lesion whereas the backscatter coefficient did not change significantly.
Several methods have been proposed that attempt to estimate the temperature increase during HIFU exposure by detecting change in the speed of sound (Sehgal et al. 1986; Seip and Ebbini 1995; Miller et al. 2002; Arthur et al. 2003; Pernot et al. 2004; Anand et al. 2007). The major limitation of this approach is that the data relating temperature and speed of sound is limited. Further, a nonlinear speed of sound profile is reported at 50° (Bamber and Hill 1979, Bloch et al. 1998), limiting the temperature estimation accurately at these levels. Moreover, tissue composition varies from patient to patient and this may lead to different temperature-dependent speed of sound profile (Miller et al. 2002). This inter-patient variability would also limit the estimation of accurate temperature measurements. There have been other methods proposed that utilize the change in attenuation to visualize HIFU lesion (Ribault et al. 1998, Bevan abd Sherar 2001a, 2001b). These have been shown to be successful to an extent. Recently, method for HIFU-lesion localization has been proposed that is based on tracking the change in backscattered RF signals (Zheng and Vaezy 2010). Results from experiments performed on ex vivo chicken breast were reported. In their method, the decay of RF signal post HIFU exposure is tracked temporally on a pixel by pixel basis for the entire image. Later, an image is formed by mapping the decay rate at each pixel. The contrast due to differences in decay rate between the HIFU lesion and the surrounding tissue was used to locate the lesion. Though the initial results are promising its applicability in vivo, where target motion may challenge pixel by pixel tracking for decay rate estimation, has yet to be demonstrated.
Ultrasound (US) elastography was introduced by Ophir et al. (1991) as a technique to image the stiffness variation in soft-tissues. The technique involves acquiring US (RF/envelope) signals from an imaging plane before and after the application of a small (~1%) quasi-static compression. Typically, the pre- and post- compression frames are processed to generate images of local strain, commonly known as elastograms. When the elastogram depicts axial strain values, it is referred to as an axial strain elastogram (ASE) (Ophir et al. 1999).
It is known that protein denaturation causes changes in stiffness of the HIFU lesion compared to the surrounding soft tissue (Fasano et al. 1983, Consigny et al. 1989, Sapin-de Brosses et al. 2010). Therefore, axial strain elastography was proposed as a possible technique to visualize HIFU lesion (Stafford et al. 1998). The feasibility of using ASE to detect HIFU lesion was demonstrated in ex vivo animal model (Stafford et al. 1998, Kallel et al. 1999) as well as ex vivo human prostate (Souchon et al. 2003). Righetti et al. (1999) performed elastographic experiments with controlled compression on canine liver in vitro. They characterized the appearance of HIFU-lesion on ASE and showed that lesion size measured from ASE was virtually unbiased and correlated well with that from pathology image, when the lesion boundary on ASE was set at a particular iso-intensity strain contrast level of −2.5dB. Although the HIFU-lesion had appreciable contrast with the surrounding soft tissue, a challenge was to define the boundary of the lesion. Righetti et al. (1999) showed that the lesion size depended on the choice iso-intensity strain contrast level and that −2.5 dB was appropriate for their case. However, for in vivo applications and applications where HIFU lesion in a heterogeneous tissue is of interest, defining lesion boundary in a consistent and reliable manner becomes important.
Recently, Axial-shear strain elastography has been introduced as a method to visualize the boundaries of breast lesions (Thitaikumar et al. 2007). In this technique, the axial-shear strain experienced by the tissue element due to quasi-static compression (like in elastography) is imaged and referred to as axial-shear strain elastograms (ASSE). The axial-shear strain is estimated using the equation 1.
| (1) |
Where, v is the displacement along direction of compression (axial) and x is the lateral direction. We have shown previously that axial-shear strains are generated at the boundaries of a firmly-bonded inclusion, and thus producing contrast to visualize the boundary directly. We hypothesize that this method may also be useful in reliable HIFU lesion boundary visualization.
MATERIALS AND METHODS
Original In vitro data acquisition and Data reprocessing
The HIFU-induced lesions used in the present work were from data acquired in a previous study (Righetti et al. 1999). The samples consisted of excised canine livers with thermal lesions produced by a prototype MR-compatible HIFU system (GE Medical System, Milwaukee, WI). After thermal exposure the samples were cast in a gelatin block and placed in the compression apparatus. The elastographic experiments were conducted using a linear array scanner (Diasonics Spectra II, Santa Clara, CA) operating at a 5 MHz center frequency. The samples were scanned using a multi-compression scheme with a step size of 0.5 %. For each step the RF signals were digitized using an 8-bit digitizer (Lecroy Corp., Chestnut Ridge, NY) operating at a 48 MHz sampling frequency. More details about the sample preparation and data acquisition can be found in Righetti et al. (1999).
In the present work, the original pre- and post-compression RF data were reprocessed using a multilevel coarse-to-fine 2D block-matching algorithm (Thittai et al. 2010) to compute the displacement map. The Axial Strain and Axial-Shear Strain Elastograms were generated from the displacement estimates using a least squares strain estimator (LSQE) with a kernel size of ~ 4 mm and staggered-strain estimation, respectively (Kallel et al. 1997, Thitaikumar et al. 2007).
Characterization of lesion area
The data archive consisted of both single lesion and multiple lesion samples. For each of the single lesion samples, the lesion boundary was determined independently from the ASE and ASSE at various iso-intensity contour thresholds, and the area of the enclosed lesion was computed. In the ASE, the level of axial strain varies from inside the lesion to the surrounding background. The iso-intensity contour level of the strain contrast (between the lesion and the surrounding) defines the lesion boundary for that level and was varied from −2dB to −6dB. In the case of ASSE, a strain contrast exists between the finite axial-shear strain regions at the lesion boundary and lack of axial-shear strain inside the lesion. The iso-intensity contour level of the axial-shear strain contrast defines the lesion boundary for that level and was varied from −2dB to −6dB.
The lesion boundary on ASE and ASSE at an iso-intensity contour level was determined in the following manner, and an illustrative flow diagram is shown in figure 1. First, both images were normalized based on the high-valued pixels that were of good quality (i.e., having corresponding correlation coefficient value > 0.75) in the respective images. For the ASSEs the positive and negative valued axial-shear strain regions were normalized separately. As discussed in Righetti et al. (1999) this normalization procedure is necessary to obtain consistent depiction of the lesion at a particular strain iso-intensity threshold value. Second, the lesion on the ASE was manually outlined for each case and used as a starting boundary position. This initial outline was automatically adjusted (reduced or increased asymmetrically) to achieve the desired iso-intensity contour level. Unlike ASE, the lesion itself is not visible in the ASSE and there exist regions where there is no axial-shear strain contrast between the host tissue and the lesion (usually in regions close to 0°, 90°, 180°, and 360°). In order to obtain a closed lesion boundary we used the initial outline from the ASE as a staring boundary position on ASSE as well. This initial outline was automatically adjusted (reduced) to achieve the desired iso-intensity contour level. Finally, the area of the lesion from ASE and ASSE were obtained at various iso-intensity contour levels.
Figure 1.

Illustrative flow diagram that demonstrates the iso-intensity contour segmentation method used in the HIFU-induced lesion area estimation from the ASE (left column, gray scale) and ASSE. The automatic lesion boundary determined at an iso-intensity threshold value of −3 dB is shown in the on bottom row. The manual lesion outline that was chosen as the starting position is shown in the images on top row.
For samples with multiple lesions, the resulting ASSE was visually analyzed for identifying any unique axial-shear strain zones of interest. In order corroborate the axial-shear strain zones observed in the ASSE from in-vitro samples, we built Finite Element Model (FEM) with two stiff-inclusions (both of them were twice as stiff as the background) and obtained the predicted axial-shear strain zones. The FEM was done using ANSYS® (Ansys Inc, Canonsburg, PA) assuming a 2D plane strain model. Four models were built, each having a different relative position for the two inclusions. In all the cases the inclusions were 10 mm in diameter and the overall geometry was 40 mm × 40 mm. In the first model, the inclusions were located at the same depth but were separated laterally by 10 mm. The two inclusions in the second model were at the same depth but separated by only 0.1mm, and in the third model the two inclusions overlapped 50% laterally. In the fourth model, the inclusions were not only separated by 0.1mm laterally but were also located at different depths (2.5 mm offset between their centers). The models were subjected to 1% compression from the top. The pre- and post-compression node positions were imported into Matlab® (Mathworks, MA) and the axial-shear strains were computed as the gradient of the axial-displacement in lateral direction (Thitaikumar et al. 2007).
RESULTS
Single HIFU-lesion case
A total of five single lesion cases were used in this work. The HIFU- induced lesion area was estimated from the two elastograms (ASE and ASSE) separately, based on the lesion boundary determined by the iso-intensity contour threshold values ranging from −2dB to −6 dB.
Figure 2 shows the Sonogram, ASE and ASSE of an example case of HIFU- lesion. The lesion boundaries corresponding to the two extreme iso-intensity contour levels used (−6dB and −2 dB) are also shown. The difference between the enclosed areas at the two contour levels can be readily appreciated on the ASE compared to on the ASSE. The corresponding sonogram (left) suggests an indistinct hypoechoic area, but it is difficult to clearly define the HIFU lesion. The estimated lesion area obtained at other contour threshold levels from the ASE and ASSE are plotted in Figure 3. It is clear that the HIFU-lesion area estimated from ASE spans a larger range compared to that from ASSE, indicating that the boundary visualization using ASE is more susceptible to image display dynamic range compared to ASSE.
Figure 2.

Sonogram (a), ASE (b) and ASSE (c) of a single HIFU-induced lesion case. The lesion boundary corresponding to two iso-intensity contours of −2dB (—) and −6dB (- -) are shown on the elastograms. Image size shown corresponds to 25 mm × 20 mm.
Figure 3.
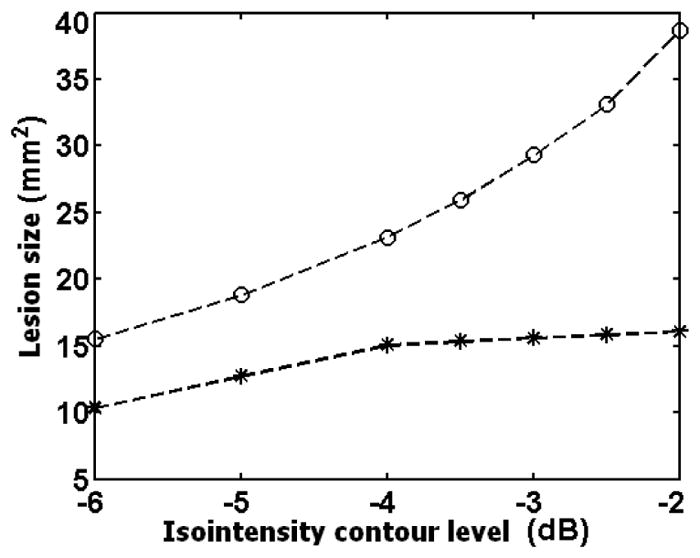
A plot of the estimated HIFU-induced lesion area from ASE (○) and ASSE ( ) for the case shown in figure 2.
Table 1 compares the mean and standard deviation values of the estimated lesion area obtained at seven iso-intensity contour values from ASE and ASSE for the 5 single-lesion cases. An overall variation between (approx) 31% to 49 % can be observed for the lesion area estimations from ASE. The corresponding variation for the estimates from ASSE ranges only between 15 to 20 %.
Table 1.
Mean and standard deviation of the estimated lesion areas from ASE and ASSE images for the 5 cases used. The mean and deviations values were computed from the lesion area obtained at different iso-intensity contour levels in the range −2dB to −6dB.
| Case | Mean (± std) values (mm2) | Variation (%) | ||
|---|---|---|---|---|
| ASE | ASSE | ASE | ASSE | |
| Case 1 | 13.6 (±6.6) | 10.7 (±2.2) | 48.5 | 20.6 |
| Case 2 | 42.3 (±14.2) | 31.8 (±6.1) | 33.6 | 19.1 |
| Case 3 | 32.7 (±11.1) | 20.2 (±3.4) | 34.0 | 16.8 |
| Case 4 | 26.4 (±8.1) | 14.4 (±2.1) | 30.7 | 14.6 |
| Case 5 | 12.2 (±5.4) | 18.3 (±2.7) | 44.3 | 14.8 |
The tabulated result shows that the estimation of the HIFU-induced lesion area (or lesion boundary visualization) using ASSE is less sensitive to iso-intensity threshold selection. This suggests that ASSE method may be more robust than the ASE-based method for lesion boundary visualization and lesion area estimation.
Two HIFU-lesions case: ASSEs from in-vitro samples
Figure 4 shows the ASE and ASSE of a sample with two HIFU-lesions that are well separated. The two lesions are well identified individually on ASE as regions with low axial strain values (figure 4a). The characteristic positive and negative axial-shear strain pattern at the lesion boundary clearly identifies the two lesions separately on ASSE as well (figure 4b). In order to better visualize axial-shear strain distribution pattern in the context of the lesion visible on ASE, we present a composite image with color-overlay of ASSE on top of ASE (figure 4c). Only those pixels from ASSE that were of good quality (corresponding correlation coefficients >0.75) and greater than a threshold value (50% of peak value) are color-overlaid.
Figure 4.

Example of a case with two HIFU-lesion that appear to be well-separated on the different elastograms (a) ASE, (b) ASSE and (c) color-overlay of ASSE on ASE. Observe that the characteristic axial-shear strain pattern associated with each lesion (e.g. see ASSE in fig 2) is clearly identified in (c). Also, observe that only those pixels from ASSE that were of good quality (corresponding correlation coefficients >0.75) and greater than a threshold value (50% of peak value) are color-overlaid.
We see interesting sets of images when two HIFU-lesions are close together. Figure 5 shows the ASE and ASSE of one such case. Interestingly, the negative axial-shear strain region of one lesion cancels the positive axial-shear strain region of the other. Thus, we see only 4 regions (2 per lesion) of finite axial-shear strain at the lesion boundary instead of 8 regions that would be expected had the 2 lesions behaved independently (for e.g. see figure 4). In addition, notice that ASSE enables high-contrast visualization of a ‘thin’ untreated region between the two lesions (figure 5b). The thin untreated region is also visible as soft region between two stiff lesions on ASE, but is of low-contrast (figure 5a). This contrast can deteriorate even further with improper choice of image smoothing parameters commonly employed to reduce noise and improve the image quality in ASE.
Figure 5.

Example of a case with two HIFU-lesion on elastograms (a) ASE, (b) ASSE and (c) color-overlay of ASSE on ASE. Observe the presence of a high-contrast axial-shear strain zone corresponding to the thin untreated region in the ASSE.
Two HIFU-lesions case: ASSEs from in-vitro samples
Axial-shear strain maps from FEM for the 4 different models are shown in figure 6. Observe that the FEM predicts that the axial-shear strain region associated with each inclusion appearing as being distinct when the inclusions are well separated (figure 6a). However, the opposite polarity axial-shear regions start to cancel at the boundaries that comes close together as the inclusions are brought closer (figure 6b) before eventually vanishing when the two inclusions merge into one (figure 6c). When the inclusions are vertically-offset, the locations of the axial-shear strain regions of the two inclusions are also offset in such a way that the axial-shear strains with the same polarity reinforce each other (figure 6d). This gives rise to a high-contrast axial-shear strain zone at the thin (0.1 mm) soft region between the stiff inclusions. The ASSE observed for the in vitro samples (figures 4 and 5) are consistent with the FEM predictions shown in figure 6.
Figure 6.

FEM-predicted axial-shear strain images of the 4 different two-inclusion models. The two 10 mm inclusions were located at the same depth but were laterally separated by (a) 10 mm, (b) 0.1 mm and (c) 50% overlap. In the forth model (d), the centers of the inclusions were offset vertically by 2.5 mm and were laterally separated by 0.1mm.
DISCUSSION
Single HIFU-lesion case
In this paper, we investigated the ASSE of in vitro samples of canine liver containing HIFU-induced lesion. Unlike ASE, where a stiff lesion is visualized as low strain region, ASSE does not visualize the stiff lesion directly. Rather, the finite axial-shear strain values at the lesion boundary contrasts the boundary from zero axial-shear strain inside the lesion. The ASSE of the single HIFU-lesion case (cf. figure 2C) appears similar to the ASSE of firmly-bonded inclusion case published in our earlier works (Thitaikumar et al. 2007). This suggests that HIFU-created lesion is firmly-bonded to the surrounding, which seems reasonable.
The results (see Table 1) demonstrate that the lesion boundary determined from ASSE is more stable when compared to ASE-based determination. This can be inferred from the lower values of the % variation (Table 1) from ASSE compared to that from ASE. Typically, the ASE is displayed in grey scale with ‘black’ encoding small strain values (stiff lesion) and ‘white’ encoding the high strain values (soft background) (Ophir et al. 1999). A change in the threshold (i.e., iso-contour levels) on the grey values at the lesion-background transition, affects the lesion boundary determined from ASE (Righetti et al. 1999). In the case of ASSE, a change in the contrast level threshold affects the size of the axial-shear strain region at the boundary. However, the location where finite axial-shear strains first appear outside the lesion, which determines the lesion boundary, remains stable. Therefore, lesion boundary visualization using ASSE may be more robust compared to that of ASE.
Multiple HIFU-lesions case
In addition to data from single lesion samples discussed above, data from two- and three-HIFU lesions sample were also analyzed. When the multiple lesions were well separated spatially, their appearance on the corresponding ASE was unambiguous. In the corresponding ASSE, the axial-shear strain zones at the boundaries of each of these lesions were clearly identified. An example of such case was shown in figure 4. When pair of lesions comes close together, the lesions start to merge into one on the ASE (fig. 5a). The appearance of ASSE becomes interesting in that the axial-shear strain zones associated with each of the lesion boundary vanishes at the boundary regions that come close together. Interestingly, the axial-shear zone corresponding to the ‘thin’ region between the two lesions is visualized at high-contrast (figure 5b, c). This behavior of ASSE may prove important in some applications. For example, HIFU treatment of a large tumor is typically achieved by multiple small exposures that cover the entire volume (Clement 2004). Therefore, it becomes important to visualize the multiple smaller lesions and ensure that there remains no untreated region in between them. Clearly, ASSE may become a useful modality in such situations to visualize the thin untreated region. We further anticipate that once the thin untreated (soft) region is treated, the two separate lesions will merge into one bigger lesion and the high-contrast axial-shear zone in-between the lesions will also vanish. Thus, ASSE may prove useful in HIFU treatment monitoring applications.
Limitations of the study
Though the results are encouraging there are several limitations with the present study. The data used in this study were retrieved from our archive and reprocessed. This limited our ability to obtain the actual stiffness map of the sample, which would have enabled us to compare the ASSE- determined lesion boundary in relation to actual stiffness contrast. This would have provided a way to investigate why the lesion boundary determined by ASSE is more robust compared to ASE–determined boundary. Another important limitation was that the original study (Righetti et al. 1999) compared the ASE determined lesion size to pathology size, but we could not identify the pathology images in the archives to perform such a study for ASSE. Also, we showed that ASSE enables visualization of thin untreated regions between multiple lesions. However, because of the retrospective nature of this study we could not treat this region and demonstrate that the associated high-contrast axial-shear strain zone will vanish.
CONCLUSIONS
We have demonstrated that it is feasible to reliably visualize HIFU lesion boundaries using ASSE. Further, we have shown that the estimation of the lesion area using ASSE is less sensitive to iso-intensity threshold selection, making this method more robust compared to ASE-based method. We have also shown that ASSE enables high-contrast visualization of the presence of a thin untreated tissue layer subtended between multiple fully-treated HIFU-lesions.
Acknowledgments
Data used in this study were acquired previously for projects supported by NIH Program Project grants P01-CA64597 and P01-EB02105-13. The current work was supported by NIH grant R21-CA135580. The authors would like to thank the authors of the previous study (Righettti et al. 1999) who acquired and archived the data that is used in the present study.
Footnotes
Publisher's Disclaimer: This is a PDF file of an unedited manuscript that has been accepted for publication. As a service to our customers we are providing this early version of the manuscript. The manuscript will undergo copyediting, typesetting, and review of the resulting proof before it is published in its final citable form. Please note that during the production process errors may be discovered which could affect the content, and all legal disclaimers that apply to the journal pertain.
References
- Anand A, Savery D, Hall C. Three-dimensional spatial and temporal temperature imaging in gel phantoms using backscattered ultrasound. IEEE Trans Ultrason Ferroelectr Freq Control. 2007;54:23–31. doi: 10.1109/tuffc.2007.208. [DOI] [PubMed] [Google Scholar]
- Arthur RM, Straube WL, Starman JD, Moros EG. Noninvasive temperature estimation based on the energy of backscattered ultrasound. Med Phys. 2003;30:1021–1029. doi: 10.1118/1.1570373. [DOI] [PubMed] [Google Scholar]
- Bamber JC, Hil CR. Ultrasonic attenuation and propagation speed in mammalian tissues as a function of temperature. Ultrasound Med Biol. 1979;5:149–157. doi: 10.1016/0301-5629(79)90083-8. [DOI] [PubMed] [Google Scholar]
- Bevan PD, Sherar MD. B-scan ultrasound imaging of thermal coagulation in bovine liver: log envelope slope attenuation mapping. Ultrasound Med Biol. 2001a;27:379–387. doi: 10.1016/s0301-5629(00)00358-6. [DOI] [PubMed] [Google Scholar]
- Bevan PD, Sherar MD. B-scan ultrasound imaging of thermal coagulation in bovine liver: Frequency shift attenuation mapping. Ultrasound Med Biol. 2001b;27:809–817. doi: 10.1016/s0301-5629(01)00380-5. [DOI] [PubMed] [Google Scholar]
- Bloch SHB, Michael R, Crum LA, Kaczkowski PJ, Keilman GW, Mourad PD. Measurements of sound speed in excised tissue over temperatures expected under high-intensity focused ultrasound conditions. J Acoust Soc Am. 1998;103:2868. [Google Scholar]
- Bush NL, Rivens I, ter Haar GR, Bamber JC. Acoustic properties of lesions generated with an ultrasound therapy system. Ultrasound Med Biol. 1993;19:789–801. doi: 10.1016/0301-5629(93)90095-6. [DOI] [PubMed] [Google Scholar]
- Clement GT. Perspectives in clinical uses of high-intensity focused ultrasound. Ultrasonics. 2004;42:1087–1093. doi: 10.1016/j.ultras.2004.04.003. [DOI] [PubMed] [Google Scholar]
- Cline HE, Hynynen K, Hardy CJ, Watkins RD, Schenck JF, Jolesz FA. MR temperature mapping of focused ultrasound surgery. Magn Reson Med. 1994;31:628–636. doi: 10.1002/mrm.1910310608. [DOI] [PubMed] [Google Scholar]
- Coleman DJ, Lizzi FL, Driller J, Rosado AL, Burgess SE, Torpey JH, Smith ME, Silverman RH, Yablonski ME, Chang S. Therapeutic ultrasound in the treatment of glaucoma. Ophthalmology. 1985;92:339–346. doi: 10.1016/s0161-6420(85)34028-9. [DOI] [PubMed] [Google Scholar]
- Consigny PM, Teitelbaum GP, Gardiner GG, Kerns WD. Effects of laser thermal angioplasty on arterial contractions and mechanics. Cardiov Interven Radiol. 1989;12:83–87. doi: 10.1007/BF02577394. [DOI] [PubMed] [Google Scholar]
- Sapin-de Brosses E, Gennisson J-L, Pernot M, Fink M, Tanter M. Temperature dependence of the shear modulus of soft tissues assessed by ultrasound. Phys Med Biol. 2010;55:1701–1718. doi: 10.1088/0031-9155/55/6/011. [DOI] [PubMed] [Google Scholar]
- Fasano VA, Ponzio RM, Benech F, Sicuro M. Effects of laser sources (Argon, Nd: YAG, CO2) on the elastic resistance of the vessel wall. Lasers Surg Med. 1983;2:45–54. doi: 10.1002/lsm.1900030108. [DOI] [PubMed] [Google Scholar]
- Foster RS, Bihrle R, Sanghvi NT, Fry FJ, Donhue JP. High-intensity focused ultrasound in the treatment of prostatic disease. Eur Urol. 1993;23(suppl 1):29–33. doi: 10.1159/000474676. [DOI] [PubMed] [Google Scholar]
- Fry WJ, Wulff VJ, Tucker D, Fry FJ. Physical factors involved in ultrasonically induced changes in living system. J Acoust Soc Am. 1950;22:867–876. [Google Scholar]
- Gelet A, Chapelon JY, Margonari J, et al. High-intensity focused ultrasound on human benign prostatic hypertrophy. Eur Urol. 1993;23(suppl 1):44–47. doi: 10.1159/000474679. [DOI] [PubMed] [Google Scholar]
- Hill CR, ter Haar GR. Review article: High-intensity focused ultrasound–potential for cancer treatment. Br J Radiol. 1995;68:1296–1303. doi: 10.1259/0007-1285-68-816-1296. [DOI] [PubMed] [Google Scholar]
- Hynynen K, Freund WR, Cline HE, Chung AH, Watkins RD, Vetro JP, Jolesz FA. A clinical, noninvasive, MR imaging monitored ultrasound surgery method. Radiographic. 1996;16(1):185–95. doi: 10.1148/radiographics.16.1.185. [DOI] [PubMed] [Google Scholar]
- Hynynen K, Pomeroy O, Smith DN, Huber PE, McDannold NJ, Kettenbach J, Baum J, Singer S, Jolesz FA. MR imaging-guided focused ultrasound surgery of fibroadenomas in the breast: A feasibility study. Radiology. 2001;219:176–185. doi: 10.1148/radiology.219.1.r01ap02176. [DOI] [PubMed] [Google Scholar]
- Kallel F, Ophir J. A least-squares strain estimator for elastography. Ultrasonic Imaging. 1997;19:195–208. doi: 10.1177/016173469701900303. [DOI] [PubMed] [Google Scholar]
- Kallel F, Stafford RJ, Price RE, Righetti R, Ophir J, Hazle JD. The Feasibility of Elastographic Visualization of HIFU-Induced Thermal Lesions in Soft-Tissue. Ultras Med and Biol. 1999;25(4):641–647. doi: 10.1016/s0301-5629(98)00184-7. [DOI] [PubMed] [Google Scholar]
- Lele PP. Production of deep focal lesions by focused ultrasound-current status. Ultrasonics. 1967;5:105–122. doi: 10.1016/s0041-624x(67)80011-8. [DOI] [PubMed] [Google Scholar]
- Lynn JG, Putnam TJ. Histological and cerebral lesions produced by focused ultrasound. Am J Pathol. 1944;20:637–649. [PMC free article] [PubMed] [Google Scholar]
- Miller NR, Bamber JC, Meaney PM. Fundamental limitations of noninvasive temperature imaging by means of ultrasound echo strain estimation. Ultrasound Med Biol. 2002;28:1319–1333. doi: 10.1016/s0301-5629(02)00608-7. [DOI] [PubMed] [Google Scholar]
- Ophir J, Alam SK, Garra BS, Kallel F, Konofagou EE, Krouskop TA, Varghese T. Elastography. Ultrasonic Estimation and Imaging of the Elastic Properties of Tissues. Journal of Engineering in Medicine. 1999;213 (H3):203–233. doi: 10.1243/0954411991534933. [DOI] [PubMed] [Google Scholar]
- Ophir J, Céspedes I, Ponnekanti H, Yazdi Y, Li X. Elastography: a method for imaging the elasticity of biological tissues. Ultrasonic Imaging. 1991;13 (2):111–134. doi: 10.1177/016173469101300201. [DOI] [PubMed] [Google Scholar]
- Pernot M, Tanter M, Bercoff J, Waters KR, Fink M. Temperature Estimation Using Ultrasonic Spatial Compound Imaging. IEEE Trans UFFC. 2004;51 (5):606–615. [PubMed] [Google Scholar]
- Ribault M, Chapelon JY, Cathignol D, Gelet A. Differential attenuation imaging for the characterization of high intensity focused ultrasound lesions. Ultrason Imaging. 1998;20:160–77. doi: 10.1177/016173469802000302. [DOI] [PubMed] [Google Scholar]
- Righetti R, Kallel F, Stafford RJ, Price RE, Krouskop TA, Hazle JD, Ophir J. Elastographic characterization of HIFU-induced lesions in canine livers. Ultras Med Biol. 1999;25(7):1099–1113. doi: 10.1016/s0301-5629(99)00044-7. [DOI] [PubMed] [Google Scholar]
- Sanghvi NT, Foster RS, Bihrle R, Casey R, Uchida T, Phillips MP, Syrus J, Zaitsev AV, Marich KW, Fry FJ. Noninvasive surgery of prostate tissue by high intensity focused ultrasound: an updated report. Eur J Ultrasound. 1999;9:19–29. doi: 10.1016/s0929-8266(99)00010-5. [DOI] [PubMed] [Google Scholar]
- Sehgal CM, Brown GM, Bahn RC, Greenleaf JF. Measurement and use of acoustic nonlinearity and sound speed to estimate composition of excised livers. Ultrasound Med Biol. 1986;12:865–74. doi: 10.1016/0301-5629(86)90004-9. [DOI] [PubMed] [Google Scholar]
- Seip R, Ebbini ES. Noninvasive estimation of tissue temperature response to heating fields using diagnostic ultrasound. IEEE Trans Biomed Eng. 1995;42:828–839. doi: 10.1109/10.398644. [DOI] [PubMed] [Google Scholar]
- Souchon R, Rouviere O, Gelet A, Detti V, Srinivasan S, Ophir J, Chapelon JY. Visualisation of HIFU lesions using elastography of the human prostate in vivo: Preliminary results. Ultrasound Med Biol. 2003;29:1007–1015. doi: 10.1016/s0301-5629(03)00065-6. [DOI] [PubMed] [Google Scholar]
- Stafford RJ, Kallel F, Hazle J, Cromeens D, Price R, Ophir J. Elastographic imaging of thermal lesions in soft-tissue: a preliminary study in-vitro. Ultrasound in Medicine and Biology. 1998;24(9):1449–1458. doi: 10.1016/s0301-5629(98)00099-4. [DOI] [PubMed] [Google Scholar]
- Thitaikumar A, Krouskop TA, Garra BS, Ophir J. Visualization of bonding at an inclusion boundary using axial-shear strain elastography: a feasibility study. Phys Med Biol. 2007;52:2615–33. doi: 10.1088/0031-9155/52/9/019. [DOI] [PubMed] [Google Scholar]
- Thittai AK, Galaz B, Ophir J. Axial-shear strain distributions in an elliptical inclusion model: Experimental validation and in vivo examples with implications to breast tumor classification. Ultrasound Med Biol. 2010;36(5):814–820. doi: 10.1016/j.ultrasmedbio.2010.02.004. [DOI] [PubMed] [Google Scholar]
- Vaezy S, Martin R, Crum L. High-intensity focused ultrasound: a method of hemostasis. Echocardiography. 2001;18:309–315. doi: 10.1046/j.1540-8175.2001.00309.x. [DOI] [PubMed] [Google Scholar]
- Vallancian G, Harouni M, Veillon B. Focused extracorporeal pyrotherapy: feasibility study in man. Semin Urol. 1993;11:7–9. [PubMed] [Google Scholar]
- Zheng X, Vaezy S. An acoustic backscatter-based method for localization of lesions induced by high-intensity focused ultrasound. Ultras Med Biol. 2010;36(4):610–22. doi: 10.1016/j.ultrasmedbio.2010.01.001. [DOI] [PubMed] [Google Scholar]