Abstract
Cidofovir (1-(S)-[3-hydroxy-2-(phosphonomethoxy)propyl]cytosine, CDV) is a potent inhibitor of orthopoxvirus DNA replication. Prior studies have shown that when CDV is incorporated into a growing primer strand, it can inhibit both the 3′-to-5′ exonuclease and the 5′-to-3′ chain extension activities of vaccinia virus DNA polymerase. This drug can also be incorporated into DNA, creating a significant impediment to trans-lesion DNA synthesis in a manner resembling DNA damage. CDV and deoxycytidine share a common nucleobase but CDV lacks the deoxyribose sugar. The acyclic phosphonate bears a hydroxyl moiety that is equivalent to the 3′-hydroxyl of dCMP and permits CDV incorporation into duplex DNA. To study the structural consequences of inserting CDV into DNA, we have used 1H NMR to solve the solution structures of a dodecamer DNA duplex containing a CDV molecule at position 7 and of a control DNA duplex. The overall structures of both DNA duplexes were found to be very similar. We observed a decrease of intensity (>50%) for the imino protons neighboring the CDV (G6, T8) and the cognate base G18, and a large chemical shift change for G18. This indicates higher proton exchange rates for this region, which was confirmed using NMR monitored melting experiments. DNA duplex melting experiments monitored by circular dichroism revealed a lower Tm for the CDV DNA duplex (46°C) compared to the control (58°C) in 0.2 M salt. Our results suggest that the CDV drug is well accommodated and stable within the dodecamer DNA duplex, but the stability of the complex is less than the control suggesting increased dynamics around the CDV.
Introduction
The antiviral agent cidofovir (1-(S)-[3-hydroxy-2-(phosphonomethoxy)propyl]cytosine, CDV) is the prototype of the acyclic nucleoside phosphonate class of drugs. This compound is a deoxycytidine monophosphate (dCMP) analog in which the phosphate has been replaced by an isosteric phosphonate moiety (Figure 1A). CDV is an effective inhibitor of a broad spectrum of double stranded DNA viruses, including poxviruses, herpesviruses and adenoviruses, and is currently approved for the treatment of cytomegalovirus retinitis in AIDS patients.1 The main drawbacks encountered during clinical use of CDV are its poor oral bioavailability requiring that it be administered by intravenous infusion, and its tendency to concentrate in the kidney proximal tubule, resulting in nephrotoxicity.2,3 However, a lipid conjugate of CDV, hexadecyloxypropyl CDV (CMX001), appears to overcome these limitations.4 Interestingly, CMX001 possesses increased antiviral activity over the parent compound against vaccinia virus, cowpox virus, ectromelia virus, cytomegalovirus, herpes simplex virus and adenovirus.5-9 CMX001 is currently being developed as an orally active drug that could be used in case of an outbreak of smallpox10 or for various double stranded DNA virus infections.
Figure 1.
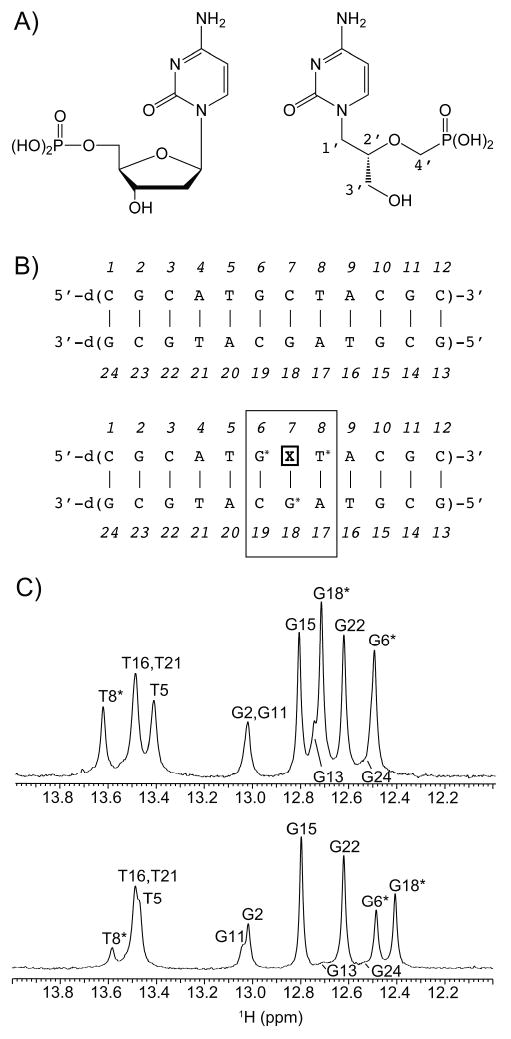
A) Structures of deoxycytidine monophosphate (left) and CDV (right). B) Sequences of the control DNA duplex (top) and the CDV DNA duplex (bottom), showing insertion at position 7 (X7). C) 1D 1H NMR spectra of the imino proton regions acquired at 25°C on a 600 MHz NMR spectrometer for the control DNA duplex (top) and CDV DNA duplex (bottom). The most perturbed imino protons G6, T8 and G18 are marked with an asterisk. The largest chemical shift change is for G18, the complementary base to CDV in the dodecamer.
We have been studying how CDV and related acyclic nucleoside phosphonates inhibit orthopoxvirus DNA replication.11-14 CDV is taken up into cells by fluid-phase endocytosis15 and then converted by cellular kinases into CDV diphosphate (CDVpp), an analog of dCTP.16 The enhanced antiviral efficacy of CMX001 is due to increased uptake as well as by better metabolic conversion into CDVpp.17 We have used vaccinia virus DNA polymerase to show that CDVpp is a substrate for orthopoxvirus polymerases in vitro, although it is used less efficiently than dCTP11 and, unlike many drugs based upon nucleotide analogs, adding CDV to a growing DNA strand does not cause immediate chain termination.11 Instead, incorporating this drug into DNA has three different effects on reactions catalyzed by the DNA polymerase.11,12 First, after CDV and one more dNMP (CDV+1) are incorporated into a growing primer strand, addition of the next nucleotide is greatly slowed. Second, this CDV+1 structure blocks the 3′-to-5′ proofreading exonuclease activity, preventing drug excision. Finally, when CDV is incorporated into what is destined to become the next template strand, the polymerase cannot extend new primers beyond the site of CDV incorporation, effectively blocking further rounds of replication. More recent studies have shown that virus DNA forms aberrant structures that are packaged poorly when vaccinia virus replicates in the presence of CDV.18 Interestingly, the related compound 9-(S)-[3-hydroxy-(2-phosphonomethoxy)propyl]adenine [(S)-HPMPA] is incorporated much more efficiently into DNA by vaccinia DNA polymerase than is CDV. However, it also creates a profound block to replication when encountered by the polymerase in the template strand.12 This difference in substrate properties may be reflected in the relatively greater antiviral activity of (S)-HPMPA over CDV.19
Vaccinia virus has also been used to study the development of resistance to CDV and other related nucleoside phosphonate drugs. We, and others, have mapped resistance mutations to both the proofreading exonuclease and DNA polymerase domains of vaccinia DNA polymerase,13,20,21 reflecting the drug's complex mechanism of action. Although viruses encoding these mutations are 3- to 14-fold more resistant to CDV than wild type virus in vitro, they are attenuated in vivo,13,20,21 and these mutations do not preclude still using CDV to treat CDV-resistant virus infections in mice.13,20
Structural studies of a molecule containing an embedded CDV could provide better insights into why these drugs create such a profound impediment to orthopoxvirus DNA synthesis. Therefore, we synthesized a single-stranded dodecamer containing CDV using a combination of “reverse” phosphoramidite DNA synthesis and methods previously described by Birkus et al.22 The duplex form d(5′-CGCATG-CDV-TACGC-3′)●d(5′-GCGTACGATGCG-3′) was prepared in sufficient quantity for detailed studies by two dimensional nuclear magnetic resonance (NMR) and circular dichroism (CD) spectroscopy. In this report we compare the three dimensional structure and dynamics of the CDV-containing DNA duplex to an isosequential control DNA.
Experimental Section
General Synthetic Chemistry
1H NMR spectra were recorded on a Varian HG spectrophotometer operating at 400 MHz and are reported in units of ppm relative to internal tetramethylsilane at 0.00 ppm. Electrospray ionization mass spectra were recorded on a Finnigan LCQDECA spectrometer at the small molecule facility, Department of Chemistry, University of California, San Diego. Chromatographic purification was done using the flash method and silica gel 60 (EMD Chemicals, Inc., 230–400 mesh). Purity (> 98%) of the target compounds was assessed by thin layer chromatography (TLC) using Analtech silica gel-GF (250 μm) plates. The products were visualized with UV light, phospray (Supelco, Bellefonte, PA, USA) and charring.
Synthesis of the CDV Monomer
Dimethoxytrityl chloride (8.5 g, 25 mmol) was added to a solution of diethyl (S)-4-N-benzoyl-1-[3-hydroxy-2-(phosphonomethoxy)propyl]cytosine (1, 8.9 g, 20.25 mmol, prepared according to Brodfuehrer et al.23) and 4-dimethyaminopyridine (200 mg, 1.6 mmol) in anhydrous pyridine (100 ml). The mixture was stirred at r. t. for 18 h, then quenched with H2O (2 ml) and concentrated under reduced pressure. The residue was dissolved in CH2Cl2 (150 ml) and washed with saturated aq. NaHCO3. The organic layer was concentrated and the crude product was purified by column chromatography on silica gel 60. Elution with 1:1 hexanes/ethyl acetate yielded 13.3 g diethyl (S)-4-N-benzoyl-1-[3-(dimethoxytrityloxy)-2-(phosphonomethoxy)propyl]cytosine (2) as a glassy solid (82% yield). 1H NMR (DMSO-d6) δ 8.05 (d, 1H), 8.03 (d, 1H), 7.66 (t, 1H), 7.55 (t, 2H), 7.46 (d, 2H), 7.36 (t, 2H), 7.34 – 7.21 (m, 7H), 6.94 (d, 4H), 4.14 – 3.88 (m, 9H), 3.77 (s, 6H), 3.29 (d, 1H), 3.00 (d, 1H), 1.23 (t, 3H), 1.21 (t, 3H).
Bromotrimethylsilane (830 mg, 5.4 mmol) was added to a solution of diethyl ester 2 (1.0 g, 1.35 mmol) and 2,6-lutidine (1.15 g, 10.8 mmol) in anhydrous acetonitrile (25 ml). The mixture was stirred at r. t. overnight then concentrated in vacuo. Water (5 ml) was added to the residue and the mixture was frozen and lyophilized. The crude phosphonic acid [(S)-4-N-benzoyl-1-[3-(dimethoxytrityloxy)-2-(phosphonomethoxy)propyl]cytosine (3)] was used for the next step without further purification.
N,N-dicylohexylcarbodiimide (DCC, 618 mg, 3 mmol) was added to a mixture of phosphonic acid 3 (1.06 g, 1.35 mmol) and 4-methoxy-1-oxido-2-pyridylmethanol (314 mg, 2 mmol, prepared according to Rejman et al.24) in dry pyridine (10 ml), and the reaction mixture was stirred overnight at r. t. then quenched with H2O (0.5 ml) and concentrated under reduced pressure. The product [4-Methoxy-1-oxido-2-picolyl (S)-4-N-benzoyl-1-[3-(dimethoxytrityloxy)-2-(phosphonomethoxy)propyl]cytosine (4)] was purified by column chromatography on silica gel 60 using an elution gradient from 100% CH2Cl2 to 20% EtOH/CH2Cl2. 1H NMR (DMSO-d6) δ 8.13 (d, 1H), 8.11 (d, 1H), 8.03 (d, 2H), 7.65 (t, 1H), 7.55 (t, 2H), 7.43 (d, 2H), 7.33 (t, 1H), 7.29 (d, 4H), 7.23 (t, 1H), 7.17 (d, 1H), 7.13 (d, 1H), 6.90 (d,4H), 4.90 (d, 2H), 3.77 (s, 3H), 3.75 (s, 6H), 3.50-3.64 (m, 4H), 3.40 (dd, 2H), 3.0-2.8 (m, 3H). Mass spectrum (electrospray ionization): m/z 821.38 [M-H]-.
Oligonucleotide Synthesis
The single strand CDV-containing oligonucleotide was prepared by TriLink BioTechnologies, Inc. (San Diego, CA). The oligonucleotide was synthesized on a 10 μmol scale in the 5′-to-3′ direction using 5′-phosphoramidite monomers. CDV monomer 4 was incorporated into the oligonucleotide using the phosphotriester coupling method.22 The synthetic oligonucleotide was purified by reverse-phase HPLC and analyzed by PAGE and mass spectroscopy. An isosequential control and complementary oligonucleotides were synthesized by the University of Calgary Core DNA Services (Calgary, AB) on a 15 μmole scale and purified by standard desalting. Additional oligonucleotides used for primer extension analyses were purchased from IDT (Coralville, IA).
CD Spectroscopy
Samples of the CDV and control DNA duplexes were prepared at a final concentration of 3.25 μM in 10 mM sodium phosphate (pH 7.3), 185 mM sodium chloride. These samples were scanned from 205 to 360 nm with a 1-nm increment using a 10 mm path length and at 20 °C to 92 °C in 3-degree increments. A sample containing only buffer was used as a control. All scans were performed on an Olis DSM 17 Circular Dichroism Spectrophotometer. The CD spectra were corrected to subtract the solvent blank (acquired at 20 °C) and plotted using GraphPad Prism software.
NMR Spectroscopy of the DNA Duplexes
The NMR samples were prepared in 95% H2O/5% D2O or 99.99% D2O, pH between 7.0-7.2, 50 mM NaCl, 20 mM Na2HPO4, 1 mM EDTA and 0.25 mM DSS-d6. According to UV absorbance measurements, the final concentration of control and CDV DNA dodecamers in the sample was approximately 2 mM for both samples. All NMR spectra used in this study were collected at 25 °C (unless otherwise specified) using Varian Inova 500 and 600 MHz NMR spectrometers equipped with triple resonance probes with Z-pulsed field gradients and a computer-controlled variable temperature (VT) module to regulate the temperature. The NOESY spectra were acquired at 600 MHz with a spectral width of 20 ppm (H2O samples) or 14 ppm (D2O samples) in both t2 and t1 dimensions, with 2048 (ω2) and 512 (ω1) complex points, a saturation delay of 1.5 s, and a mixing time of 80 ms. DQF-COSY spectra were acquired at 600 MHz with a spectral width of 20 ppm in both t2 and t1 dimensions, with 4096 (ω2) and 512 (ω1) complex points and a saturation delay of 1.5 s. Natural abundance 1H,13C HSQC spectra were acquired at 500 MHz with spectral widths of 10 ppm and 30 ppm in t2 and t1 dimensions (carrier at 56 ppm in t1), 610 (ω2) and 256 (ω1) complex points, and a saturation delay of 1.4 s.
Temperature series (from 5 °C to 40 °C) were performed for both the control and CDV DNA duplexes and monitored by NMR spectroscopy at 600 MHz. The spectra were acquired with the water pulse sequence of Biopack (Varian Inc.) with a spectral width of 30 ppm to insure a flat baseline, 128 transients, a relaxation delay of 2 s and an acquisition delay of 2 s. The spectra were processed and plotted with VnmrJ 2.1B, using a line broadening of 1.5 Hz. Backward linear prediction was used to correct the first two points of the free induction decay.
All two-dimensional NMR spectra were processed with nmrPipe v4.925 and analyzed with NMRviewJ v8.0.b30 (One Moon Scientific Inc.). For the NOESY and HSQC spectra, a sine-bell function shifted by 90° or 75° was applied to the free induction decays in each dimensions, followed by zero-filling to a maximum of twice the number of complex points and Fourier transform. For the DQF-COSY spectra, an unshifted sine-bell function was applied in both 1H dimensions before continuing with the processing mentioned above.
Structure Calculations
A model of the control and CDV B-DNA 12-mers were built using Nucleic Acid Builder26, LEap and Antechamber27 included in Ambertools 1.3. In order to build the CDV DNA duplex, the x-ray structure of CDV28 was superimposed on C7 of the control DNA duplex. The coordinates of C7 were then removed. The aliphatic backbone dihedral angles of the new X7 nucleotide were adjusted to obtain appropriate P5′ and O3′ atom positions with PyMOL (Delano Scientific Inc.). Finally, a short minimization was performed on both DNA dodecamers with Amber 1029 to obtain a starting point for the structure calculations using experimental restraints. Antechamber was used to obtain the topology information (bond lengths, angles and torsion angles force constants) of the modified nucleotide by itself and when incorporated into DNA, based on the X-ray coordinates of CDV (Crystallography Information File ab0159). The non-standard terms that were missing were estimated from parameters found in other molecules.
The calibration of the NOE cross-peak intensities obtained with NMRViewJ was performed with MARDIGRAS30 using a full-relaxation matrix approach. All NOE cross-peak intensities involving the cytosine H6 protons were doublets because of the 3JH5H6 coupling observed in the spectra, while the intensities of the T and G imino contacts with the A and C amino protons were divided by 3 and 2, respectively, to compensate for chemical exchange. An initial run of MARDIGRAS was performed using the B-DNA model of the control and CDV DNA duplex described above. The RMS error between the model and the calibrated NOE distances was 0.57 Å for both duplexes. The upper bounds obtained from MARDIGRAS were multiplied by a factor 1.25 before being exported to Amber 10 for a 25 ps simulated annealing protocol (25,000 steps). The simulated annealing protocol using the pairwise generalized Born model31 was as follows: the temperature of the system was kept constant at 600 K during the first 5 ps, cooled down slowly to 100 K between 5-18 ps, and cooled down to 0 K for the last 7 ps. The protocol was repeated 50 times to obtain an NMR ensemble with the 10 lowest RMSD structures. The structure with the lowest RMSD of the ensemble was put back into MARDIGRAS for a second and third cycle of NOE calibration and structure calculations.
For the control DNA duplex, 181 NOEs distance restraints were used in addition to 19 pseudorotation phase angle restraints of 162 ± 20° based on the measurement of 3JH1H2′ and 3JH1H2″ coupling constants. A total of 52 standard Watson-Crick inter-strand distance restraints were added to keep the two strands together during the simulated annealing. A total of 158 α, β, γ, δ, ε, and ζ backbone angle restraints (± 30°) based on the Dickerson-Drew B-DNA dodecamer X-ray structure32 were used to keep the molecule in a loose B-DNA duplex conformation. For the CDV DNA duplex, 195 NOEs distance restraints, and 17 pseudorotation phase angle restraints based on 3JH1H2′ and 3JH1H2″ coupling constant measurements were used. A total of 150 α, β, γ, δ, ε, and ζ backbone angle restraints (± 30°, none given for the X7), and 52 standard Watson-Crick inter-strand distance restraints were used during the calculations. The helical parameters of the DNA structures were calculated using the program X3DNA.33
Results
Synthesis of a CDV-Containing Oligonucleotide
Oligonucleotides containing isosteric phosphonate residues have been described in several previous papers.34,35 In particular, Birkus et al.22 described the preparation of oligonucleotides containing 9-(S)-[3-hydroxy-2-(phosphonomethoxy)propyl]adenine residues. Employing a similar strategy, we synthesized protected CDV monomer 4 and used it to incorporate CDV at the center of a dodecanucleotide. As shown in Scheme 1, 3′-O-dimethoxytritylation of the 4-N-benzoyl derivative of cidofovir (1) yielded fully protected CDV derivative 2. Removal of the ethyl ester groups with bromotrimethylsilane followed by esterification of phosphonic acid 3 with 4-methoxy-1-oxido-2-pyridylmethanol afforded the CDV monomer (4). The modified oligonucleotide (dCGCATG-X7-TACGC), where X7=CDV, was synthesized from the 5′-to-3′-end using reversed 5′ phosphoramidites; CDV monomer 4 was introduced into the oligonucleotide chain using the phosphotriester method. The complementary and dCMP-containing control strands (Figure 1B) were all synthesized using standard chemistry.
Scheme 1.

Synthesis of the monomer used to prepare a CDV-containing oligonucleotide. Reagents: a) dimethoxytrityl chloride, 4-dimethylaminopyridine, pyridine; b) 1) bromotrimethylsilane, acetonitrile; 2) H2O; c) 4-methoxy-1-oxido-2-pyridylmethanol, N,N-dicyclohexylcarbodiimide, pyridine.
We had previously used enzymatic methods to prepare a CDV-containing DNA template and showed that the drug blocks chain extension by vaccinia DNA polymerase.12 To show that the chemically synthesized substrate behaved the same way, we compared the properties of the CDV- and dCMP-containing template strands in primer extension assays (see Supporting Information). Each 12-mer was first ligated to a template-extending oligonucleotide in the presence of an IRDye700® labelled primer, to create a longer and more stable primer-template substrate (Figure S1A). The assay showed that template-primer pairs composed of the dCMP-containing control dodecamer permitted efficient primer extension to the ends of the template (Figure S1B). In contrast, negligible primer extension was detected when the template contained a CDV molecule (Figure S1B).
CD Spectroscopy of the CDV DNA Duplex
We next used CD spectroscopy to see whether the substitution of CDV for dCMP would radically perturb the structure of a DNA duplex. Figure S2 shows the CD spectra for the two DNA duplexes at 20 °C in ∼0.2 M salt, and spanning wavelengths from 205 to 360 nm. The two spectra are quite similar, and exhibit features characteristic of B-DNA. There are, however, some differences in the peak intensities between these two spectra at 255 and 282 nm, suggesting a minor alteration in the structure of the CDV-containing duplex. We also obtained melting profiles of the two duplexes at different wavelengths and spanning temperatures ranging from 20 °C to 92 °C. Figure 2 shows the change in molar CD at 246 nm. Curves fitted to these and other data (collected at different wavelengths) indicated Tm values of 46±1 °C and 58±1 °C for the CDV- and dCMP-containing DNA duplexes, respectively. The lower melting point of the CDV-containing molecule reflects differences in both the van't Hoff melting enthalpies (ΔΔHCDV-dCMP = 3.6 Kcal/mol) and entropies (ΔΔSCDV-dCMP = 13 cal/mol·deg) under these salt and DNA concentration conditions.
Figure 2.
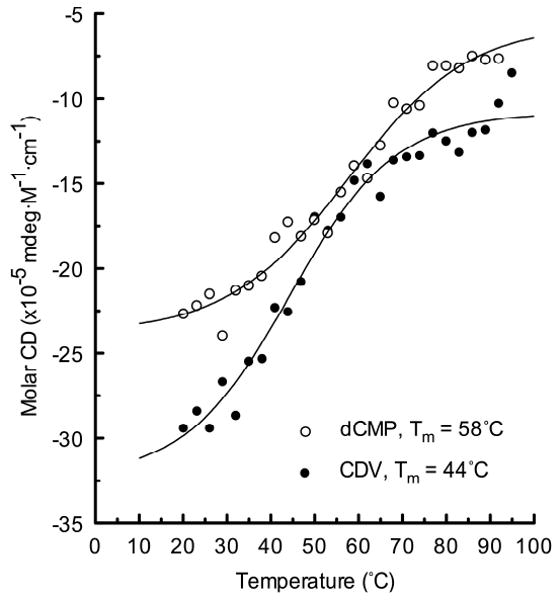
Melting profiles for CDV- and dCMP-containing duplexes. Each sample was dissolved in 10 mM sodium phosphate (pH 7.3), 185 mM sodium chloride and CD spectra were acquired at each of the indicated temperatures. The figure shows the CD signal recorded at 246 nm for each duplex and the curve fits suggested Tm values of 58°C and 44°C for dCMP and CDV-containing duplexes, respectively. Nearly identical melting points were determined over a spectral range spanning 245-255 nm (58±1°C and 46±1°C [s.e.m.] for dCMP and CDV-containing duplexes, respectively).
NMR Spectra
The 1H NMR spectra of the control and CDV DNA duplexes were remarkably similar in all respects – chemical shift dispersion, line widths, intensities, and resolution – implying homologous structures for both duplexes.
Exchangeable Imino Protons
The hydrogen bonded imino protons from the G and T nucleotides observed in the very low field region of the 1H NMR spectrum are highly sensitive indicators of the Watson-Crick base pairing and stability of DNA duplexes in solution. The imino regions of the 1D 1H NMR spectra of the control and CDV DNA duplexes are compared in Figure 1C. The imino protons of the six G and four T of the duplexes are clearly observable, with the exception of weak G13 and G24 resonances located at the extremities of the dodecamers. The presence of all imino protons and the strong similarities between the control and CDV duplex spectra indicate normal base stacking for both duplexes. Most resonances have very similar intensities and chemical shifts between both molecules, with the exception of G6, T8 and G18 for the CDV duplex that show approximately half the intensities found in the control. These three resonances are in contact with X7 in the CDV duplex. Moreover, G18, the complementary base to X7, shows by far the largest chemical shift change (0.3 ppm observed between both duplexes at 25 °C). To make sure that the CDV base makes canonical hydrogen bonds to its complimentary base, we acquired a 2D 1H, 1H NOESY spectrum of the CDV DNA duplex at 10 °C to identify the inter-strand NOE contacts (Figure 3). Six imino-imino, ten imino-amino and the four imino-methyl NOEs contacts were identified. Of special interest, two strong NOEs were found between the imino protons of G18 with the amino protons of X7, confirming that X7 is properly hydrogen bonded with G18 in a Watson-Crick manner.
Figure 3.
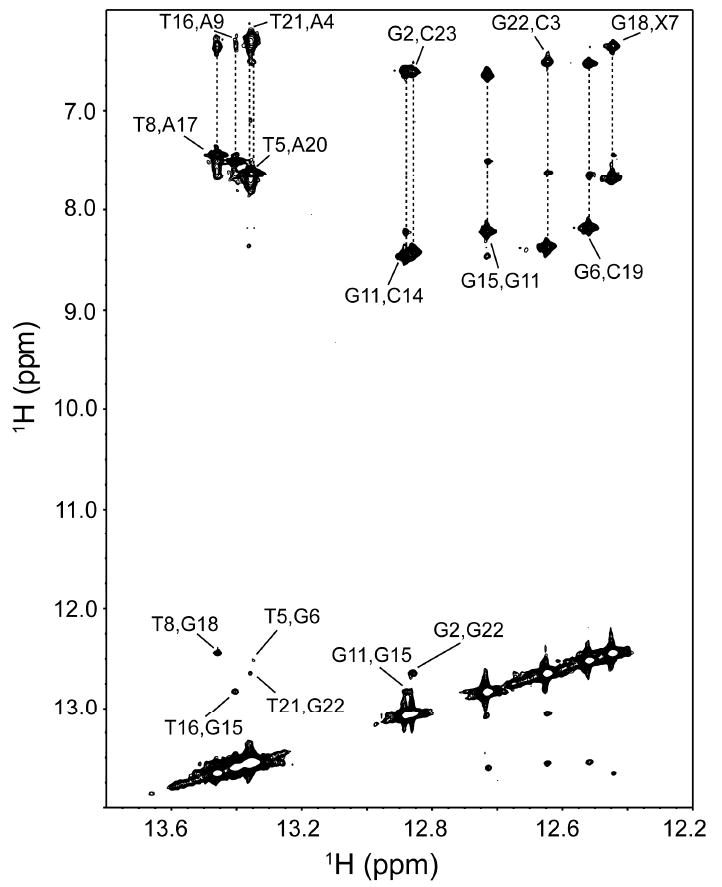
2D 1H-1H NOESY spectrum of the imino proton regions of the CDV DNA duplex at 10°C. Assigned imino-imino and imino-amino contacts are indicated, including G18,X7 contacts.
Temperature Series of the CDV and Control DNA Duplexes
1D 1H NMR spectra of both DNA duplexes were acquired at 5, 10, 15, 20, 25, 30, 35, 40 and 45 °C. The imino regions between 12 and 15.5 ppm are shown in Figure 4A,B. The peak intensities of four resonances of interest (G6, T8, G18 and G15) are plotted as a function of temperature in Figure 4C-F. The peak intensity of a given imino resonance is dependent on multiple complex phenomena including molecular rotational correlation time which influences NMR relaxation, hydrogen bonding strength which influences the rate of chemical exchange of the proton, and conformational changes. For a DNA duplex, it is typical to observe an increase in the NMR signal with temperature as molecular motion increases, and then a decrease as the temperature approaches the melting point of the base pair in question, resulting in a parabolic profile. From Figure 4C-E it is clear that the imino proton resonances of G6, T8 and G18 are less stable in the CDV DNA duplex compared to the control by 10-20 °C, but those of base pairs further away from the inserted drug such as G15 and G22 have a very similar stability (Figure 4F).
Figure 4.
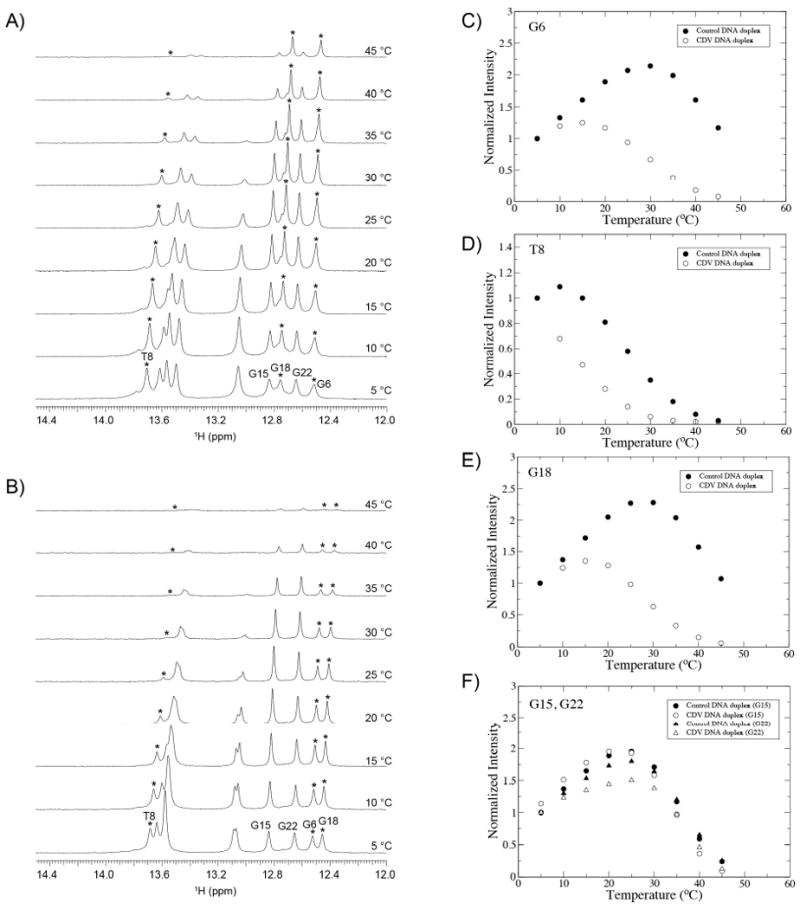
Temperature series monitored by 1D 1H NMR spectra. A) Control DNA duplex. B) CDV DNA duplex. As reflected by the plots of peak intensities of the imino protons of G6, T8 and G18 as a function of temperature (C-E), the CDV DNA duplex shows a decrease in the local stability of the nucleotides surrounding the modified base. The imino protons from bases farther away, like G15 and G22 (F), show very similar melting profiles for both duplexes.
Chemical Shift Assignments of the CDV and Incorporation Into DNA
The chemical shift assignment of the proton and carbon resonances of the CDV drug was accomplished using natural abundance 1H, 13C HSQC and DQF-COSY spectra (Figure 5A,B). The 1H and 13C chemical shifts of the drug are in good agreement with previously published chemical shifts for CDV-phosphocholine extracted from rat kidney.36 Of particular interest are the resonances of C4′, H4′ and H4″. Since 13P decoupling was not used during the acquisition of the HSQC spectra, the 13C4′ nucleus showed a splitting of 153 Hz characteristic of a 13C-31P coupling constant (1J13C-31P). A chemical shift difference of 9.5 Hz between the two equivalent protons H4′ and H4″ was also observed in the HSQC spectrum. This results from the coupling constant between the H4 protons with the 31P nucleus (2J1H-31P), as confirmed in the 1D 1H NMR spectrum. This E.COSY like pattern37 depends upon the relative signs of the coupling constants involved and leads to an apparent offset in the chemical shift of the coupled protons. The recognition of this particular J-coupling pattern was essential to the assignment of the CDV resonances in the DNA duplex (Figure 5C,D). Unlike the situation for the CDV drug, the protons H4′ and H4″ are non-equivalent in the duplex. This was confirmed by the NOE contacts found in the 2D NOESY spectrum of the duplex. These experiments were necessary in order to carefully assign the X7 resonances, particularly because protons H1″, H4″ and H3′ all possess very similar chemical shifts, making the assignment of the NOE contacts more prone to error. The natural abundance 1H,13C HSQC and DQF-COSY spectra of the control DNA duplex are presented in Figure 5E,F for comparison.
Figure 5.
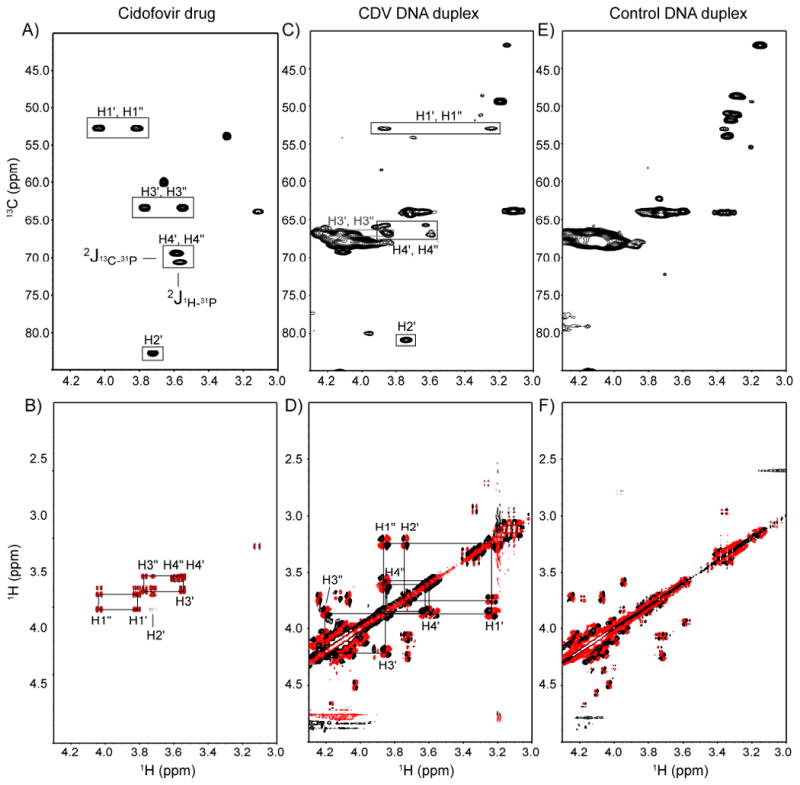
Natural abundance 1H-13C HSQC (top) and DQF-COSY (bottom) showing the chemical shift assignments of Cidofovir. A-B) CDV drug. C-D) CDV DNA duplex. E-F) Control DNA duplex. The H4′,H4″ protons of the phosphonate show an E.COSY like pattern reflecting coupling to the 31P. The 1H-13C HSQC and DQF-COSY were acquired at 500 and 600 MHz, respectively.
Sequential Assignment of the Non-exchangeable Protons in the Control and CDV DNA Duplexes
Sequential assignment of the non-exchangeable base protons (purine H8 and pyrimidine H6) was performed using through-space connectivities with the H1′-ribose protons in the 2D 1H-1H NOESY spectra. The sequential assignment for the control and CDV DNA duplexes are shown in Figure 6. The connectivities of the first strand (nucleotides 1-12) and the second strand (nucleotides 13-24) are identified with solid and dashed lines, respectively. In Figure 6, the strong intra-residue NOEs between cytosines H5 and H6 protons are labeled with a superscript #, and the base H8 protons with the base H5 protons of the previous residue are grouped together in the grey areas. All expected H6/H8-base and H1′-ribose connectivities were found in the NOESY spectra. Strong NOEs were found for the H6 protons of X7 and T8, making connections with the H1′ and H1″ protons of X7 (see below for a more detailed description the NOEs found for X7). The H2′ and H3′ sugar protons were subsequently assigned based on these assignments.
Figure 6.
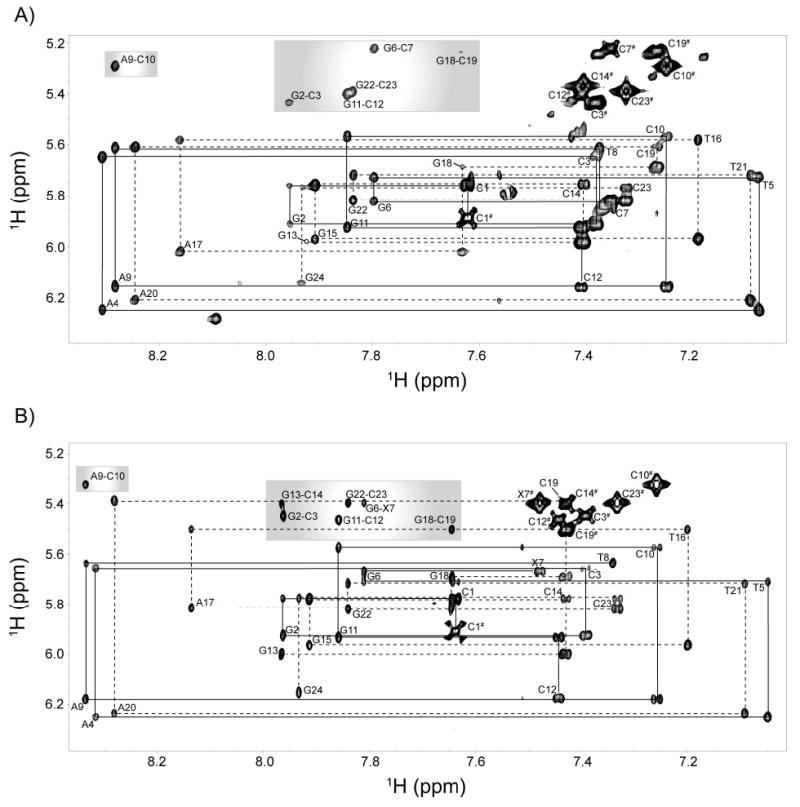
2D 1H-1H NOESY NMR spectra showing the sequential assignment of the base H6/H8 protons with the H1′-ribose protons. A) Control DNA duplex. B) CDV DNA duplex. Solid and dashed lines indicate the assignments of both strands. The H8,H5 NOEs are located in the grey areas, while the H6,H5 NOEs are marked with #.
Solution Structures of the Control and CDV DNA Duplexes
In order to measure the effect of the incorporation of the CDV drug on the structure of the DNA duplex, we performed restrained molecular dynamic simulations on both the control and CDV DNA duplexes (see Experimental Section for details). Distance restraints were obtained by calibration of the NOEs using MARDIGRAS.30 A detailed visualization of the NOE contacts involving the CDV incorporated into DNA is shown in Figure S3. The position of X7 in the DNA duplex is defined by 18 experimental NOEs.
The sugar pucker pseudo-rotation angles were determined by measuring the 2JH1H2′ and 2JH1H2″ coupling constants to estimate the percentage of C2′- and C3′-endo populations (see Experimental Section).38 Backbone dihedral restraints based on the Dickerson-Drew B-DNA structure32 and standard Watson-Crick inter-strand distance restraints were added to keep the two strands together during the simulated annealing. The molecular dynamics simulations were repeated 50 times for each duplex, and the 10 structures with the lowest root mean square deviation (RMSD) were kept for analysis. The NMR ensembles of the control and CDV DNA duplexes containing the 10 lowest RMSD structures are presented in Figure 7A and 7B, respectively. The superimposition of the representative structure of the control (green) and CDV (blue) DNA duplexes is shown in Figure 7C. The RMSD between both structures is 1.5 Å over all common atoms, confirming a similar overall B-DNA structure. The comparison of the helical parameters of the control and CDV DNA duplexes is presented in Figure 8.
Figure 7.
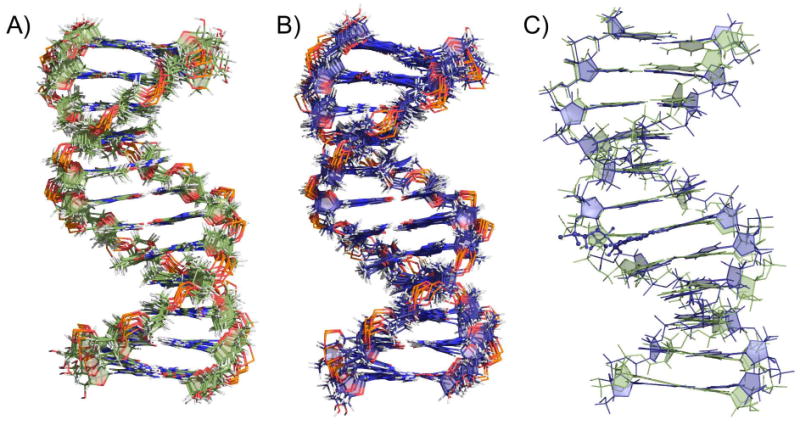
NMR structures of DNA duplexes A) Control DNA duplex: ensemble of 10 lowest RMSD structures. B) CDV DNA duplex: ensemble of 10 lowest RMSD structures. C) Superimposition of the control (green) and CDV (blue) DNA duplexes. The RMSD between both structures is 1.5 Å over all common atoms.
Figure 8.
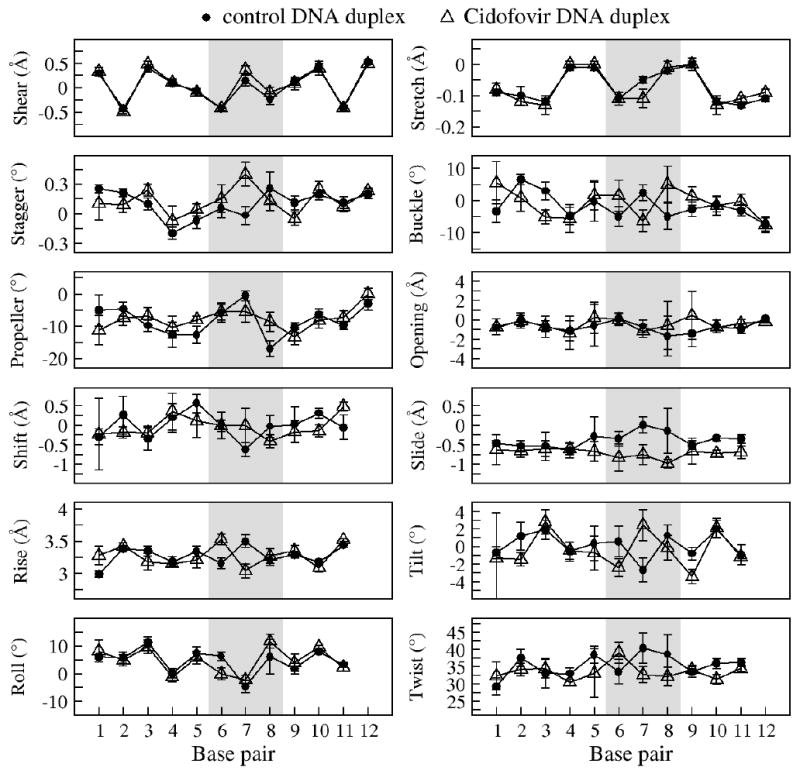
Comparison of the helical parameters for the ensemble of 10 structures obtained for the control DNA duplex (●) and the CDV DNA duplex (Δ). The error bars correspond to the standard deviations of the ensembles. The parameters were calculated using the program X3DNA.33
In order to validate the structure determination protocol, a back-calculation of the NOESY spectrum based on the NMR structure was performed using a complete relaxation matrix analysis method (CORMA39) using a 80 ms mixing time and a theoretical isotropic correlation time of 2 ns. The high-level of similarity between the back-calculated and the experimental NOESY spectra of the control DNA duplex presented in Figure S4 confirm that the structures determined here well represent the experimental data. Moreover, structure calculations were performed with and without the presence of the dihedral restraints, and with and without the presence of the NOEs to evaluate the effect of the respective restraints on the ensembles. A typical B-DNA duplex ensemble (but with higher RMSD) was obtained without the use of the dihedral restraints, while a fully distorted structure was obtained without the NOE restraints. No dihedral restraints were used in any calculation for X7. No NOE violations over 0.3 Å were observed in any structure, and only one NOE over 0.2 Å was violated in more than one structure. The average total distance and torsion penalties obtained for the ensembles were 7.92 and 0.92 for the control DNA duplex, compared to 3.35 and 1.33 for the CDV DNA duplex.
Discussion
The structure of an asymmetric DNA duplex containing a single molecule of the antiviral agent CDV has been compared to a DNA duplex containing dCMP at the equivalent site. The CDV-containing oligonucleotide was prepared using a reverse synthesis method22 and permitted the efficient synthesis of milligram quantities of DNA without constraining our choice of flanking sequence. We subsequently tested what effects a CDV molecule, located in the template strand, would have on reactions catalyzed by vaccinia virus DNA polymerase and observed that it blocked DNA synthesis across the drug lesion (Figure S1B). Thus these fully synthetic substrates behave just like the enzymatically synthesized oligonucleotides that we have used previously.12 We then used CD and two-dimensional NMR spectroscopy to examine why CDV-containing DNA can so negatively affect trans-lesion synthesis catalyzed by vaccinia DNA polymerase.
The CDV and control DNA duplexes exhibited CD spectra characteristic of B-DNA under near physiological salt and temperature conditions (Figure S2) and differed only slightly in the intensities of the absorbance peaks at 255 and 282 nm. This suggested some minor differences in base stacking between the two duplexes. CD methods have previously been used to examine the structures of DNAs containing the nucleoside analogs ganciclovir40 and cyclohexenyl-adenine41 and with similar results. For example, Marshalko et al.40 studied a self-complementary 10-mer containing two molecules of the antiviral drug ganciclovir. Ganciclovir is an acyclic nucleoside analog possessing an unmodified guanine base and these authors showed that the ganciclovir and control DNA duplexes produced similar CD spectra characteristic of B-DNA.40 We concluded that CDV causes only minor perturbations of the overall double-stranded DNA structure.
CD analysis was also used to determine the melting properties of the two oligonucleotides. The data indicated that the incorporation of a single molecule of CDV into this duplex lowers the overall Tm by ∼12 °C in 0.2 M salt (46±1 °C and 58±1 °C for CDV and dCMP duplexes, respectively). The 1D 1H NMR temperature melting series showed that the instability is localized to the region around the CDV molecule. The nucleotides surrounding CDV (G6, T8 and G18) are less stable by 10 to 14 °C compared to those surrounding a dCMP control (Figure 4C-E), whereas nucleotides located further away show melting profiles similar to that seen in the control duplex (Figure 4F). Similar effects have been reported for other forms of modified DNAs. For example the two molecules of ganciclovir noted above lowered the Tm by 13 °C relative to a control 10-mer duplex40 and a glycerol-based acyclic nucleoside linked to a thymine base reduced the Tm of a 9-mer DNA by 15 °C.42 Interestingly the 12-mer DNA containing a normal furanose sugar replaced by a cyclohexenyl ring exhibited a Tm only 0.4 °C different from the dAMP-containing control.41 These data show that modified nucleotides can be readily incorporated into B-DNA structures, but that as Marshalko et al. have suggested,40 a cyclic sugar moiety may provide an additional important stabilizing element.
The solution structures of the CDV and control DNA duplexes confirmed the B-DNA configuration suggested by the CD spectra, and the similarities between the two structures are illustrated by an RMSD of only 1.5 Å over all common atoms between both duplexes. The ready accommodation of CDV into B-DNA contrasts with the structure of a DNA containing ganciclovir.43 Although the guanine base of ganciclovir can form a normal Watson-Crick pair with a cytosine on the opposite strand, the ganciclovir-containing DNA duplex still exhibits a kink in the sugar-phosphate backbone on the 3′ side of the drug. Closer inspection of the region surrounding the CDV molecule in our structure showed only a small conformational change in the position of the cytosine base of CDV (X7) relative to that of dCMP (C7) (Figure 9). This is associated with a significant alteration in the base pair stagger, rise, and tilt at C7/X7 although the deviation does not markedly exceed the natural variation in these parameters that can be observed elsewhere in the DNA (Figure 8). The next nucleotide, T8, superimposes well in both the CDV and control DNA duplex structures although again one does see some changes in the helical parameters (Figure 8). One also still sees some alteration in the positioning of the 5′-phosphonate and 3′-phosphates flanking the CDV molecule. The movement of the phosphorus in the 5′-phosphonate linkage, relative to its phosphate homolog, may cause some perturbation of the G6 deoxyribose in the CDV-containing structure and is reflected in a change in rise (Figure 8). One also sees displacement of the phosphorus linking X7 and T8, although this is accommodated within the helix without further perturbing the T8 deoxyribose. We acquired 31P NMR spectra (data not shown), but the individual phosphates were not sufficiently resolved for either DNA to be assigned with the exception of the phosphonate from the CDV. That said, slightly larger 31P chemical shift dispersion was observed for the CDV DNA duplex.
Figure 9.
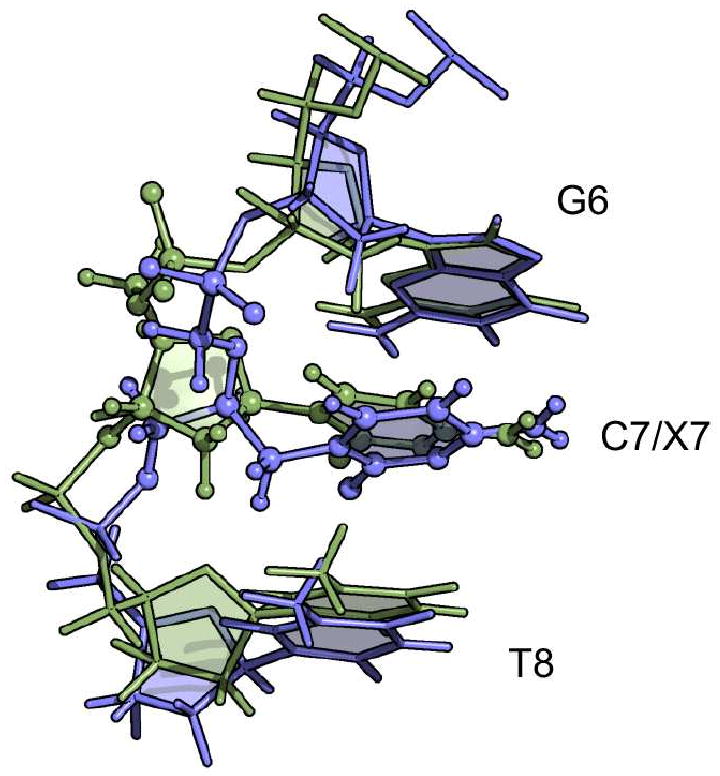
Structural comparison of C7 (green) and X7 (blue) in the middle of the DNA duplexes. The nucleobases C7 and X7 superimposed relatively well on each other with a RMSD of 0.88 Å for the heavy atoms of the ring. The absence of the ribose ring for X7 leads to a small conformational change in the positioning of the base of X7. The ring of X7 is positioned with a tilt between G6 and T8. Base pairs G6-C19, X7/C7-G18 and T8-A17 were superimposed to obtain this alignment.
Vaccinia virus DNA polymerase has been shown to be the target of the anti-poxvirus activity of CDV based on analyses of mutants resistant to the drug;13,20,21 our lab has also shown that the incorporation of CDV into DNA affects both the 3′-to-5′ exonuclease and 5′-to-3′ polymerase activities of the enzyme.11,12 The alterations seen in the CDV-containing structure provide some insights into how this nucleotide analog affects the activities of the DNA polymerase although with the caveat that we are extrapolating from a duplex structure to enzyme-bound and partially single-stranded DNA substrates. For example, the 3′-to-5′ exonuclease activity cannot attack the phosphodiester bond linking CDV to another 3′ nucleotide (the CDV+1 product).11 Based upon the conservation of sequence, this reaction will presumably depend upon a metal ion coordinated nucleophilic attack44 on the phosphorus linking the CDV to the 3′-terminal dNMP (i.e. between X7 and T8). The displacement of this atom, perhaps further exacerbated by an altered configuration around the 5′-phosphonate linkage in a displaced single-strand of DNA (Figure 9), could severely interfere with the reaction geometry within the exonuclease active site. The same arguments could be marshaled to explain how these structures partially inhibit DNA polymerization from a CDV+1 terminated primer11 or completely block synthesis across a CDV in the template strand.12 Although the position of the T8 3′-oxygen can be nearly superimposed in the two stacked structures, the several small distortions we see might be exacerbated in the absence of a fully duplex structure and disturb the positioning of the 3′-hydroxyl residue. This would disfavor 3′-chain extension from a CDV+1 terminated primer. The block to synthesis across a CDV residue is nearly absolute (Figure S1) and suggests that a CDV molecule in the template strand creates much greater problems for virus polymerases. Two features of the DNA could account for this effect. For example, any enhancement of the perturbations we see in the rise (Figure 8) would interfere with H-bonding of an incoming nucleotide to the G6 residue. Furthermore, the altered positions of the phosphorus atoms flanking the CDV molecule (Figure 9) might interfere with movement within the polymerase's DNA binding site, much as a nut cannot easily move on a damaged bolt. Both effects would inhibit polymerization across a CDV residue.
Although one can select viruses encoding polymerase mutations that independently promote enhanced drug excision45 and probably inhibit CDVpp binding,13 even double-mutant viruses exhibit only a 15-fold increase in CDV resistance. High-level resistance has proven impossible to obtain without severe effects on virulence. This may reflect the fact that no simple evolutionary path exists for producing DNA polymerases that can accommodate these insidious forms of drug-damaged DNA templates, and illustrates the promising clinical value of these non-chain-terminating antivirals.
Supplementary Material
Acknowledgments
We thank Melissa Crane for preparing the NMR samples, and Wayne Moffat, David Zinz and Craig Turk for taking the circular dichroism measurements. This work was supported by Canadian Institutes of Health Research grants (to BDS and to DHE), a Natural Sciences and Engineering Research Council grant (to DHE) and supported in part by NIH grants AI-076558, AI-074057, AI-071803, AI-066499 (to KYH). OJ is the recipient of an AHFMR studentship and a Frederick Banting and Charles Best Canada Graduate Doctoral Scholarship from CIHR.
Footnotes
Supporting Information Available. Primer extension analysis of chemically synthesized oligonucleotides, CD spectra of CDV- and dCMP-containing DNA duplexes at 20°C, the position of X7 in the DNA duplex defined by NOE distances, back-calculated portion of the NOESY spectrum for the control DNA duplex. This material is available free of charge via the Internet at http://pubs.acs.org.
References
- 1.De Clercq E, Holý A. Nat Rev Drug Discov. 2005;4:928–940. doi: 10.1038/nrd1877. [DOI] [PubMed] [Google Scholar]
- 2.Wachsman M, Petty BG, Cundy KC, Jaffe HS, Fisher PE, Pastelak A, Lietman PS. Antiviral Res. 1996;29:153–161. doi: 10.1016/0166-3542(95)00829-2. [DOI] [PubMed] [Google Scholar]
- 3.Lalezari JP, Drew WL, Glutzer E, James C, Miner D, Flaherty J, Fisher PE, Cundy K, Hannigan J, Martin JC, Jaffe HS. J Infect Dis. 1995;171:788–796. doi: 10.1093/infdis/171.4.788. [DOI] [PubMed] [Google Scholar]
- 4.Ciesla SL, Trahan J, Wan WB, Beadle JR, Aldern KA, Painter GR, Hostetler KY. Antiviral Res. 2003;59:163–171. doi: 10.1016/s0166-3542(03)00110-4. [DOI] [PubMed] [Google Scholar]
- 5.Kern ER, Hartline C, Harden E, Keith K, Rodriguez N, Beadle JR, Hostetler KY. Antimicrob Agents Chemother. 2002;46:991–995. doi: 10.1128/AAC.46.4.991-995.2002. [DOI] [PMC free article] [PubMed] [Google Scholar]
- 6.Quenelle DC, Collins DJ, Wan WB, Beadle JR, Hostetler KY, Kern ER. Antimicrob Agents Chemother. 2004;48:404–412. doi: 10.1128/AAC.48.2.404-412.2004. [DOI] [PMC free article] [PubMed] [Google Scholar]
- 7.Buller RM, Owens G, Schriewer J, Melman L, Beadle JR, Hostetler KY. Virology. 2004;318:474–481. doi: 10.1016/j.virol.2003.11.015. [DOI] [PubMed] [Google Scholar]
- 8.Beadle JR, Hartline C, Aldern KA, Rodriguez N, Harden E, Kern ER, Hostetler KY. Antimicrob Agents Chemother. 2002;46:2381–2386. doi: 10.1128/AAC.46.8.2381-2386.2002. [DOI] [PMC free article] [PubMed] [Google Scholar]
- 9.Toth K, Spencer JF, Dhar D, Sagartz JE, Buller RM, Painter GR, Wold WS. Proc Natl Acad Sci USA. 2008;105:7293–7297. doi: 10.1073/pnas.0800200105. [DOI] [PMC free article] [PubMed] [Google Scholar]
- 10.Painter GR, Hostetler KY. Trends Biotechnol. 2004;22:423–427. doi: 10.1016/j.tibtech.2004.06.008. [DOI] [PubMed] [Google Scholar]
- 11.Magee WC, Hostetler KY, Evans DH. Antimicrob Agents Chemother. 2005;49:3153–3162. doi: 10.1128/AAC.49.8.3153-3162.2005. [DOI] [PMC free article] [PubMed] [Google Scholar]
- 12.Magee WC, Aldern KA, Hostetler KY, Evans DH. Antimicrob Agents Chemother. 2008;52:586–597. doi: 10.1128/AAC.01172-07. [DOI] [PMC free article] [PubMed] [Google Scholar]
- 13.Andrei G, Gammon DB, Fiten P, De Clercq E, Opdenakker G, Snoeck R, Evans DH. J Virol. 2006;80:9391–9401. doi: 10.1128/JVI.00605-06. [DOI] [PMC free article] [PubMed] [Google Scholar]
- 14.Gammon DB, Snoeck R, Fiten P, Krecmerova M, Holy A, De Clercq E, Opdenakker G, Evans DH, Andrei G. J Virol. 2008;82:12520–12534. doi: 10.1128/JVI.01528-08. [DOI] [PMC free article] [PubMed] [Google Scholar]
- 15.Connelly MC, Robbins BL, Fridland A. Biochem Pharmacol. 1993;46:1053–1057. doi: 10.1016/0006-2952(93)90670-r. [DOI] [PubMed] [Google Scholar]
- 16.Cihlar T, Chen MS. Mol Pharmacol. 1996;50:1502–1510. [PubMed] [Google Scholar]
- 17.Aldern KA, Ciesla SL, Winegarden KL, Hostetler KY. Mol Pharmacol. 2003;63:678–681. doi: 10.1124/mol.63.3.678. [DOI] [PubMed] [Google Scholar]
- 18.Jesus DM, Costa LT, Goncalves DL, Achete CA, Attias M, Moussatche N, Damaso CR. J Virol. 2009;83:11477–11490. doi: 10.1128/JVI.01061-09. [DOI] [PMC free article] [PubMed] [Google Scholar]
- 19.Beadle JR, Wan WB, Ciesla SL, Keith KA, Hartline C, Kern ER, Hostetler KY. J Med Chem. 2006;49:2010–2015. doi: 10.1021/jm050473m. [DOI] [PubMed] [Google Scholar]
- 20.Kornbluth RS, Smee DF, Sidwell RW, Snarsky V, Evans DH, Hostetler KY. Antimicrob Agents Chemother. 2006;50:4038–4043. doi: 10.1128/AAC.00380-06. [DOI] [PMC free article] [PubMed] [Google Scholar]
- 21.Becker MN, Obraztsova M, Kern ER, Quenelle DC, Keith KA, Prichard MN, Luo M, Moyer RW. Virol J. 2008;5:58. doi: 10.1186/1743-422X-5-58. [DOI] [PMC free article] [PubMed] [Google Scholar]
- 22.Birkus G, Rejman D, Otmar M, Votruba I, Rosenberg I, Holy A. Antivir Chem Chemother. 2004;15:23–33. doi: 10.1177/095632020401500103. [DOI] [PubMed] [Google Scholar]
- 23.Brodfuehrer PR, Howell HG, Sapino C, Vemishetti P. Tetrahedron Lett. 1994;35:3243–3246. [Google Scholar]
- 24.Rejman D, Erbs J, Rosenberg I. Org Proc Res Dev. 2000;4:473–476. [Google Scholar]
- 25.Delaglio F, Grzesiek S, Vuister GW, Zhu G, Pfeifer J, Bax A. J Biomol NMR. 1995;6:277–293. doi: 10.1007/BF00197809. [DOI] [PubMed] [Google Scholar]
- 26.Macke T, Case DA. Modeling unusual nucleic acid structures. In: Leontes NB, SantaLucia J Jr, editors. Molecular Modeling of Nucleic Acids. Washington, DC: 1998. pp. 379–393. [Google Scholar]
- 27.Wang J, Wolf RM, Caldwell JW, Kollman PA, Case DA. J Comput Chem. 2004;25:1157–1174. doi: 10.1002/jcc.20035. [DOI] [PubMed] [Google Scholar]
- 28.Symerský J, Holý A. Acta Crystallogr C. 1991;47:2104–2107. doi: 10.1107/s0108270190013257. [DOI] [PubMed] [Google Scholar]
- 29.Case DA, Cheatham TE, Darden T, Gohlke H, Luo R, Merz KMJ, Onufriev A, Simmerling C, Wang B, Woods RJ. J Comput Chem. 2005;26:1668–1688. doi: 10.1002/jcc.20290. [DOI] [PMC free article] [PubMed] [Google Scholar]
- 30.Borgias BA, James TL. Methods Enzymol. 1989;176:169–183. doi: 10.1016/0076-6879(89)76011-0. [DOI] [PubMed] [Google Scholar]
- 31.Hawkins GD, Cramer CJ, Truhlar DG. J Phys Chem. 1996;100:19824–19839. [Google Scholar]
- 32.Drew HR, Wing RM, Takano T, Broka C, Tanaka S, Itakura K, Dickerson RE. Proc Natl Acad Sci USA. 1981;78:2179–2183. doi: 10.1073/pnas.78.4.2179. [DOI] [PMC free article] [PubMed] [Google Scholar]
- 33.Lu XJ, Olson WK. Nucleic Acids Res. 2003;31:5108–5121. doi: 10.1093/nar/gkg680. [DOI] [PMC free article] [PubMed] [Google Scholar]
- 34.Točík Z, Barvik I, Buděšínský M, Rosenberg I. Biopolymers. 2006;83:400–413. doi: 10.1002/bip.20571. [DOI] [PubMed] [Google Scholar]
- 35.Pav O, Protivinska E, Pressova M, Collinsova M, Jiracek J, Snasel J, Masojidkova M, Budesinsky M, Rosenberg I. J Med Chem. 2006;49:3955–3962. doi: 10.1021/jm050401v. [DOI] [PubMed] [Google Scholar]
- 36.Eisenberg EJ, Lynch GR, Bidgood AM, Krishnamurty K, Cundy KC. J Pharm Biomed Anal. 1998;16:1349–1356. doi: 10.1016/s0731-7085(97)00162-3. [DOI] [PubMed] [Google Scholar]
- 37.Griesinger C, Sørensen OW, Ernst RR. J Am Chem Soc. 1985;107:6394–6396. [Google Scholar]
- 38.Rinkel LJ, Altona C. J Biomol Struct Dyn. 1987;4:621–649. doi: 10.1080/07391102.1987.10507665. [DOI] [PubMed] [Google Scholar]
- 39.Keepers JW, James TL. J Magn Reson. 1984;57:404–426. [Google Scholar]
- 40.Marshalko SJ, Schweitzer BI, Beardsley GP. Biochemistry. 1995;34:9235–9248. doi: 10.1021/bi00028a037. [DOI] [PubMed] [Google Scholar]
- 41.Wang J, Verbeure B, Luyten I, Lescrinier E, Froeyen M, Hendrix C, Rosemeyer H, Seela F, Van Aerschot A, Herdewijn P. J Am Chem Soc. 2000;122:8595–8602. [Google Scholar]
- 42.Schneider KC, Benner SA. J Am Chem Soc. 1990;112:453–455. [Google Scholar]
- 43.Foti M, Marshalko S, Schurter E, Kumar S, Beardsley GP, Schweitzer BI. Biochemistry. 1997;36:5336–5345. doi: 10.1021/bi962604e. [DOI] [PubMed] [Google Scholar]
- 44.Brautigam CA, Steitz TA. Curr Opin Struct Biol. 1998;8:54–63. doi: 10.1016/s0959-440x(98)80010-9. [DOI] [PubMed] [Google Scholar]
- 45.Gammon DB, Evans DH. J Virol. 2009;83:4236–4250. doi: 10.1128/JVI.02255-08. [DOI] [PMC free article] [PubMed] [Google Scholar]
Associated Data
This section collects any data citations, data availability statements, or supplementary materials included in this article.


