Abstract
Dynamic nuclear polarization and dissolution of a 13C-labeled substrate enables the dynamic imaging of cellular metabolism. Spectroscopic information is typically acquired, making the acquisition of dynamic volumetric data a challenge. To enable rapid volumetric imaging, a spectral-spatial excitation pulse was designed to excite a single line of the carbon spectrum. With only a single resonance present in the signal, an echo-planar readout trajectory could be used to resolve spatial information, giving full volume coverage of 32 × 32 × 16 voxels every 3.5 seconds. This high frame rate was used to measure the different lactate dynamics in different tissues in a normal rat model and a mouse model of prostate cancer.
Keywords: 13C, hyperpolarized, lactate, spectral-spatial, metabolism
Introduction
With the recent development of a method for retaining dynamic nuclear polarization (DNP) in solution [1, 2, 3], high SNR 13C MRI and MRSI data have been demonstrated in vivo following injection of a hyperpolarized 13C agent. This method enables not only the detection of the pre-polarized agent but also the rapid imaging of cellular metabolism. The large magnetization enhancement (~40,000 fold) resulting from DNP and the low temperature within the polarizer enables real-time imaging of metabolic processes, with the downstream metabolic products differentiated from the injected compound based on a change in chemical shift. Detecting this change requires a frequency-sensitive imaging technique. In prior studies this has been accomplished with spectroscopic techniques in which the full spectrum is acquired, including the injected compound and downstream metabolic products [4, 5, 6, 7, 8, 9].
Spectroscopic methods have the advantage that no assumptions need to be made about which specific frequency components will be observed. Also, the shape of each spectral line can be resolved, which is useful for understanding the chemical environment around the molecules of interest, and for obtaining information about spin coupling. However, spectroscopic methods typically require the acquisition of a long FID in order to achieve the desired spectral resolution. Thus they are relatively slow techniques with low SNR efficiency and coarse spatial resolution.
When there is one particular resonance of interest, such as 13C-lactate for metabolic imaging of cancer when hyperpolarized 13C-1-pyruvate is used as the injected substrate, then a different strategy can be used. In this paper, a spectral-spatial excitation pulse was designed to excite a single line of the carbon spectrum. Since only a single resonance is present in the signal, an echo-planar readout trajectory could be used to resolve the spatial information, giving full volume coverage every 3.5 seconds. Results from phantoms, a normal rat model and a mouse model of prostate cancer are shown to demonstrate the feasibility and performance of the technique.
Theory
Spectral-spatial radiofrequency (RF) pulses are selective in both frequency and space [10]. This dual selectivity is accomplished by using an oscillating magnetic field gradient, with a shaped RF sub-pulse transmitted during each half-cycle of the gradient. As an approximation, the spatial profile is determined by the shape of each sub-pulse, and the spectral profile is determined by the envelope of the train of sub-pulses. Since the the envelope is discretized (by the sub-pulses), periodic replicas of the main spectral profile appear in frequency space.
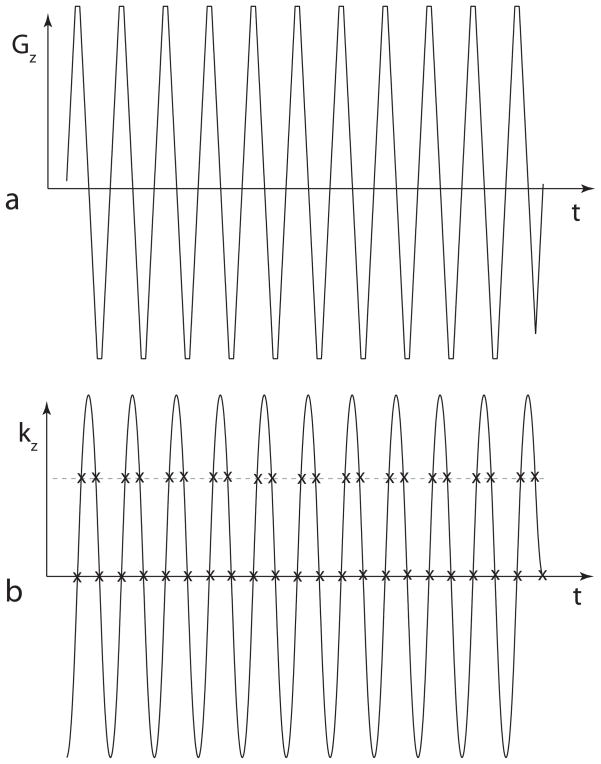
For exciting a single resonance of the 13C spectrum, the challenge is achieving a stopband of adequate width and attenuation between the central passband of the pulse and these distorted replicas in frequency space. The replicas are distorted because the trajectory through excitation k-space [11] is a “zig-zag” pattern, as shown in Fig. 1. In addition to the imperfect replicas, the zig-zag trajectory also results in bipolar “ghosts” spaced every 1/(2τ) from the main passband, where τ is the period of the gradient waveform. These bipolar lobes are the result of imperfect cancellation between replicas from the positive and negative parts of the gradient waveform.
Figure 1.
The zig-zag trajectory through excitation k-space. (a) A gradient waveform used with a typical spectral-spatial RF pulse. (b) The integral of the gradient shape gives the trajectory through excitation k-space. The “x” marks show that the sample spacing across the central region is uniform, but is staggered away from the center. Compensating for this staggered sampling is the key to the design technique used in this paper.
To widen the stopband, the gradient oscillation frequency can be increased, which comes at the expense of a larger minimum slab width due to the decreased area under each gradient lobe. Also, one of the bipolar ghosts can be suppressed by using oscillating polarity in the RF sub-lobes, as introduced in [12] and further explained in [13]. However, for the high degree of attenuation needed to suppress the signal from the injected hyperpolarized compound, enabling imaging of a single metabolic product, a more advanced strategy that takes into account the zig-zag trajectory through excitation k-space must be used.
The zig-zag k-space trajectory used with a typical spectral-spatial pulse is shown in Fig. 1. The “x” marks in Fig. 1(b) indicate that the temporal sample points are evenly distributed along the central line of the spatial k-space pattern, but are “staggered” away from the center. This staggered sampling pattern is the reason for the ghosts at 1/(2τ) from the main passband. The ghosts get worse further from the center of the frequency axis because the artifact caused by staggered sampling is worse for higher frequency signals. The reason that the technique described in the previous paragraph works is that staggered sampling has no effect on constant-amplitude (DC) signals, so adequate suppression can be achieved around 0 Hz despite the zig-zag pattern.
To further improve the attenuation in the stopband, the weighting function in excitation k-space can be designed for the specific zig-zag pattern traced out by the oscillating gradient waveform. This weighting function, defined in [11] as B1(t)/γG(t), is commonly used in the literature on multidimensional RF pulses and should not be confused with the weighting matrix W below. In conventional spectral-spatial RF pulse designs, the two-dimensional weighting function in excitation k-space is the outer product of the Fourier transforms of the desired spectral and spatial profiles [12]. Thus, the shape of the weighting function along any line across the time dimension (i.e. the “x” marks in Fig. 1(b)) is the same. However, in this work, a different weighting function was used for each kz position to compensate for the difference in sample spacing illustrated in Fig. 1.
To solve for r, a vector containing the energy deposited by the RF pulse at each point along one of the non-uniformly sampled lines, we begin with discrete Fourier transform in matrix notation:
| (1) |
where S and s are column vectors and F is a Fourier matrix with the elements:
| (2) |
where N is the number of points in s. To account for the staggered sampling along each of the off-centre lines in Fig. 1, a Fourier matrix modified to include the sample delays along the particular line, 0 ≤ Δ ≤ 1, is used:
| (3) |
For example, the (−1)k Δ values along the upper, staggered samples in Fig. 1 might be [+0.25, −0.25, +0.25, −0.25…]. A standard weighted least squares formulation can then be applied to solve for the non-uniformly spaced r values with a Fourier transform that most closely matches the desired frequency response H:
| (4) |
W is a diagonal matrix of weights that specifies the important part of the spectrum to fit to. For this work, W was 1 for the central half of the matrix covering the stopband, and 0.01 elsewhere. H is a column vector containing the desired frequency response.
With only a single line of the spectrum excited using a spectral-spatial RF pulse, efficient imaging techniques with readout trajectories such as echo-planar methods can be used. This is the strategy taken in the experiments described below.
Methods and Results
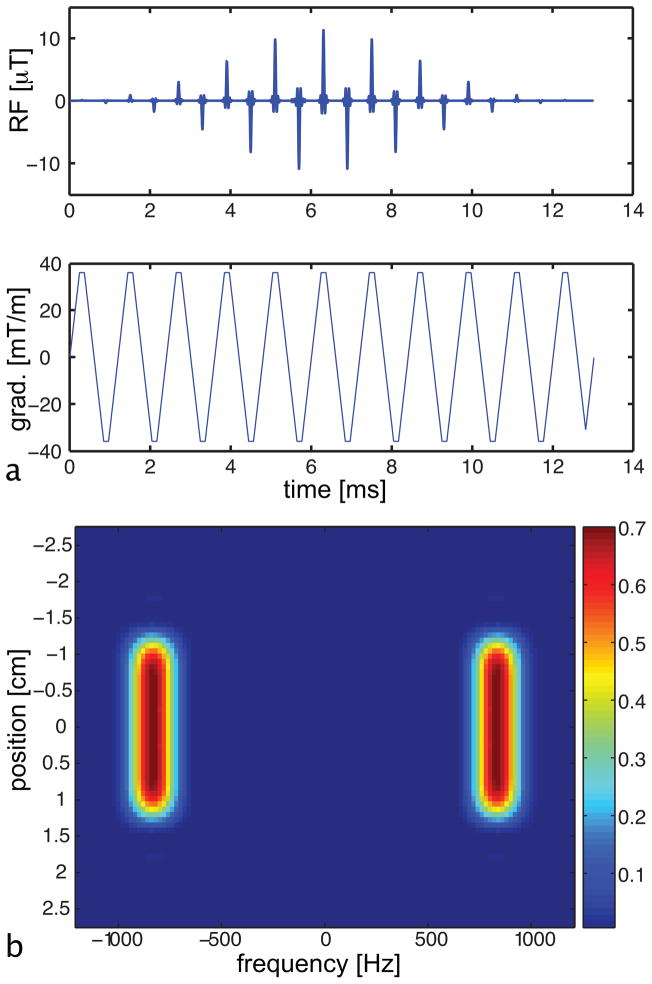
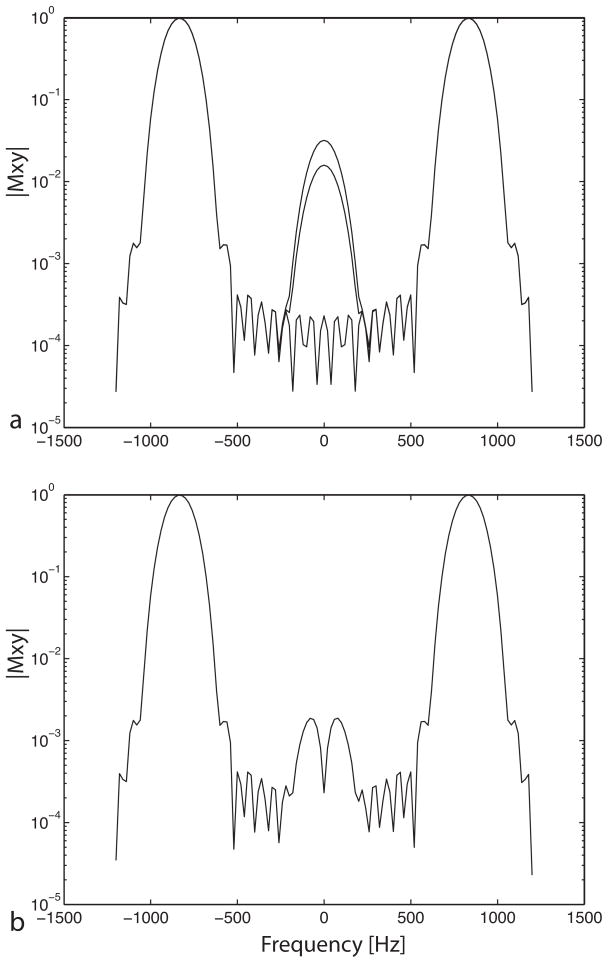
A spectral-spatial RF pulse was designed for exciting a single component of the spectrum (in this case 13C-1-lactate). The RF pulse (shown in Fig. 2) consisted of 21 sub-lobes, each with 600 μs duration. The desired frequency response function, H in Eq. 4, consisted of a passband with time-bandwidth product of 3, 1% in-band ripples and 0.1% out-of-band ripples. The response in the spatial dimension consisted of a passband with time-bandwith product of 10 and ripples of 0.1% both inside and outside. As seen in Fig. 3(a), the RF pulse gives a 180 Hz passband (full-width-at-half-max) and a 440 Hz stopband (¿ 60 dB attenuation). Using the filter-design method described above resulted in a 26-fold improvement in the stopband suppression that can be seen by comparing Fig. 3(a) and (b). The stopband suppression did not vary significantly over the tip angle range from 0 to 90 degrees.
Figure 2.
Spectral-spatial RF pulse designed for imaging single components of the 13C spectrum. (a) The RF pulse and gradient waveform. (b) The excitation profile of the spectral-spatial pulse as a function of frequency and position, with the color corresponding to the magnitude of the resulting transverse magnetization normalized by M0. Note the large spectral stopband and the sharp spatial selectivity of the pulse.
Figure 3.
Suppression in the spectral stopband of the spectral-spatial pulse. Plots of the spectral profile at the center of the slice as well as two intermediate positions within the slice are shown overlapping. (a) The spectral profile of the pulse shows inadequate suppression in the stopband, seen as the lobes at 0 Hz. (b) With the new design that compensates for the zig-zag trajectory through excitation k-space, this lobe is suppressed giving 60 dB attenuation. This level of attenuation is achieved at all locations within the slice, as seen by the identical overlapping plots.
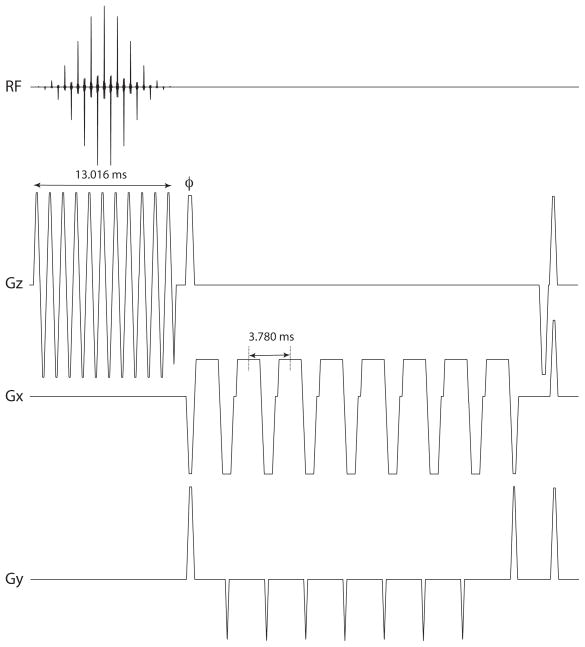
The RF pulse was implemented in the rapid, “flyback” echo-planar imaging pulse sequence shown in Fig. 4. The sequence is designed to resolve a volume of 32 × 32 × 16 voxels every 3.5 seconds, and can be run continuously to acquire time-resolved data. The maximum spatial resolution is 2.5 mm in-plane and 2 mm through slice. With eight phase-encode lines acquired per excitation, 64 excitations are required to resolve the volume. Progressively larger delays were used for successive echo-planar interleaves to smooth any off-resonance phase accrual across k-space, as in [14]. The center of k-space is crossed on the 5th lobe of the readout gradient, giving an effective TE of 22.5 ms (measured from the center of the RF pulse).
Figure 4.
Echo-planar pulse sequence used in experiments. The sequence consists of a 13.016 ms spectral-spatial RF excitation pulse followed by a gradient lobe to phase-encode the through-slice direction (labeled φ). The four lobes of the echo-planar readout gradient on Gx are separated by 3.780 ms, with blips on Gy in between.
For the experiments, the dynamic nuclear polarization (DNP) and dissolution method [1] was used to achieve ~15% polarization for 13C-1-pyruvate in the solution state. The sample was rapidly dissolved to a concentration of 79 mM. Polarization was estimated by extracting a small aliquot of the dissolved solution and injecting it into a capillary tube within a custom-designed polarimeter. At the same time as the polarization measurement, the polarized sample was rapidly carried to a General Electric EXCITE 3 T (Waukesha, WI) clinical MRI system equipped with 40 mT/m, 150 mT/m/ms gradients and a broadband amplifier.
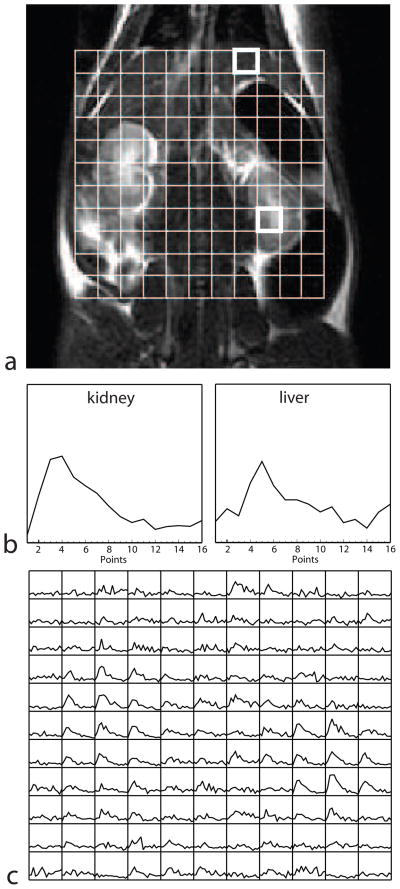
Phantom and in vivo experiments were performed to test the method. All animal experiments were carried out under a protocol approved by the institutional animal care and use committee. For phantom and rat experiments, a custom designed dual-tuned rat birdcage coil (inner diameter 8 cm) was used for signal transmission and reception, allowing push-button switching between proton and carbon imaging. To test the image quality achievable with the new pulse sequence, a small cylindrical phantom (4.4 cm diameter) was imaged, and compared with a conventional 2D spectroscopic scan with phase encoding applied along both in-plane directions (see Fig. 5). For all experiments, the nominal flip angle was 10°. This flip angle was chosen as a reasonable tradeoff, giving adequate SNR while aiming to avoid saturation of the magnetization. An injection of 3.0 mL of the hyperpolarized solution into the tail vein of a 350 g Sprague-Dawley rat was made at the same time as the start of the data acquisition. The injection was made slowly over a period of 12 s to accommodate the relatively large volume of injected fluid. The pulse sequence was run continuously, with a 3-dimensional 13C data set acquired every 5 seconds and a total imaging time of 1 minute 20 seconds for sixteen data sets (the sequence was run with the temporal resolution set slightly below the maximum to give larger temporal coverage). The center frequency of the passband was set on the expected frequency of lactate, based on previous in vivo 13C studies. The results of this experiment showing different signal dynamics in different tissues are seen in Fig. 6.
Figure 5.
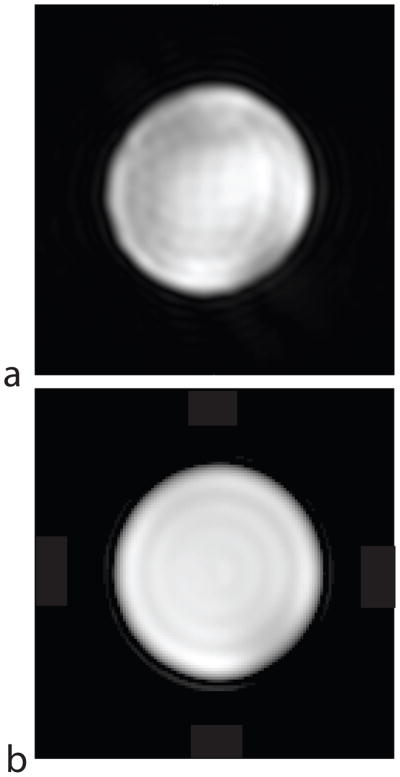
Phantom experiment showing spatial resolution of the new pulse sequence. (a) New pulse sequence, TR = 55 ms, TE = 22.5 ms, scan time = 3.5 s, 32×32×16 voxels. (b) Conventional chemical shift imaging (CSI) sequence with phase encoding in both in-plane directions, TR = 600 ms, TE = 1 ms, scan time = 614 s, 3202×32×1 voxels. For both scans, the FOV was 8 cm and the slice thickness was 5 mm.
Figure 6.
Data showing lactate dynamics in different tissues of the rat model. (a) A grid showing the arrangement of the 5 × 5 × 5 mm voxels is overlaid on the anatomical (proton) image. (b) Lactate signal at each 5 s time-point is shown for kidney and liver tissue. The time courses are from the upper and lower voxels highlighted in (a), respectively. (c) The lactate time-courses from all the voxels in the grid show different lactate metabolism in different tissues (each grid element shows the lactate signal as a function of time).
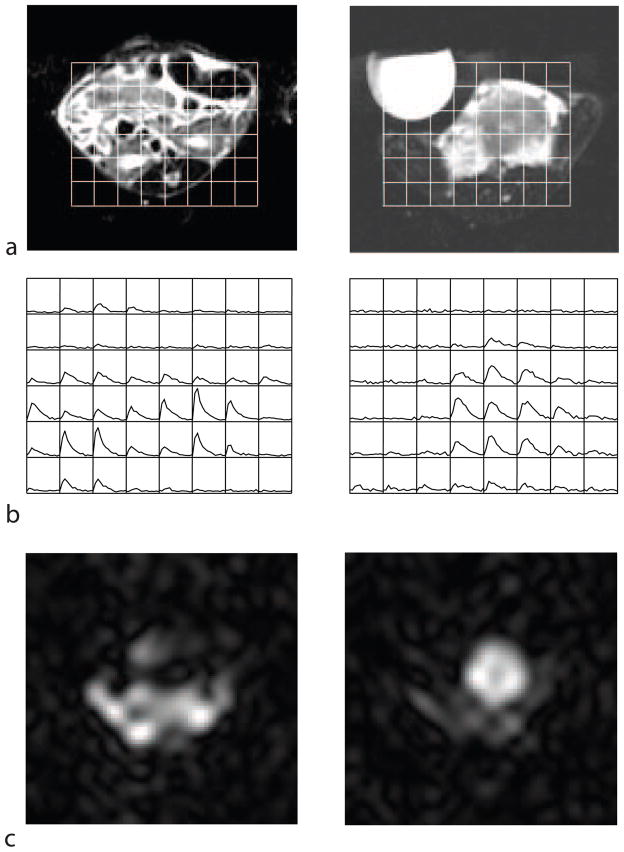
In a separate in vivo experiment, the production of lactate was studied in a Transgenic Ade-nocarcinoma of Mouse Prostate (TRAMP) mouse model. A custom-designed dual-tuned mouse birdcage coil (5 cm inner diameter and 8cm length) was used for RF transmission and reception. Intravenous access was established by a semi-permanent jugular vein catheter placed in a surgical operation one day before the MR exam. An injection of 0.3 mL of the hyperpolarized solution was made through the catheter at the same time as the start of of the scan. The injection was made over a period of 12 s. The pulse sequence was run as described above. The results of this experiment, shown in Fig. 7, suggest that significantly different dynamic curves are observed in tumour vs. non-cancerous tissue.
Figure 7.
Measurements of lactate dynamics in the TRAMP mouse model. (a) The voxel (3 × 3 × 4 mm) locations for the 13C data are shown overlaid on an axial proton image through two slices, through the abdomen of the mouse (left) and through the tumour (right). (b) The time-course of the 13C lactate produced in each voxel (each grid element shows the lactate signal as a function of time). (c) The lactate image taken at the 5th timepoint. The syringe seen to the left of the tumour in (a) contained a 13C-lactate reference, but this signal was below the noise floor of this rapid scan. The signal seen outside the abdomen is likely a combination of noise, Gibbs ringing, and artifact due to the lactate signal changing during the volume acquisition.
Discussion and Conclusions
We have developed and demonstrated a pulse sequence for rapid imaging of a single metabolic product resulting from injection of a hyperpolarized 13C-labeled substrate. By employing a spectral-spatial excitation pulse, only the resonance of interest is excited. The fact that the excited spectrum consists of only a single line enables the use of efficient readout trajectories such as the echo-planar readout used in this study. Another benefit of the spectrally-selective excitation pulse is that the substrate itself is not excited. This presumably prolongs the signal from downstream metabolites such as lactate because this magnetization is replenished as the un-excited pyruvate is metabolized, although this was not tested in the current study.
With the high temporal resolution afforded by exciting only a single resonance, the dynamic detection curves shown in Fig. 6 and Fig. 7 can be measured. Given the large amount of pyruvate injected in this study, the metabolism is likely out of physiological equilibrium during these scans. It is interesting to note that the curves have different shapes in different tissues, which is seen by comparing kidney and liver in Fig. 6. The tumour in Fig. 7(d) also demonstrates a dynamic curve distinctly different from surrounding tissue. The main differences between these curves is the time to maximum signal, and the peak level of lactate (which is notably high in the tumour). However, it is not possible to determine whether these differences in lactate dynamics are due exclusively to different lactate production rates in the particular tissue, or due to differences in perfusion and/or wash-in of lactate produced at another site. To address this uncertainty, it may be useful to include a periodic excitation of the pyruvate resonance, interleaved with the lactate measurement, to give a measurement of metabolite in-flow. However, this would come at the expense of reduced temporal resolution.
The passband of the spectral profile of the spectral-spatial RF pulse was designed to be narrow and gaussian-like. This is a potential source of signal variations since the resonance frequency varies spatially near susceptibility boundaries and temporally with respiration. However, the low time-bandwidth product (3.0) of the spectral passband, which leads to its gaussian shape, was necessary in order to achieve adequate suppression of alanine, which is the nearest large peak in the carbon spectrum at 195 Hz from lactate. A flatter spectral passband could be achieved with a longer RF pulse, but this would come at the expense of temporal resolution. The other effect of the narrow spectral passband is that the frequencies contributing to the image are restricted, so that the distortions and artifacts associated with a long echo-planar readout are mitigated.
In conclusion we have developed an echo-planar pulse sequence for rapid imaging of hyperpolarized metabolic products. By using a spectral-spatial excitation, only the resonance of interest is excited, alleviating the need for a spectroscopic acquisition and enabling volumetric coverage in 3.5 s. This high frame rate was used to measure the time-varying lactate signal in different tissues in a normal rat model and a mouse model of prostate cancer.
Acknowledgments
The authors are grateful for support from NIH grants R21 EB005363, R01 CA111291 and R01 EB007588.
Footnotes
Publisher's Disclaimer: This is a PDF file of an unedited manuscript that has been accepted for publication. As a service to our customers we are providing this early version of the manuscript. The manuscript will undergo copyediting, typesetting, and review of the resulting proof before it is published in its final citable form. Please note that during the production process errors may be discovered which could affect the content, and all legal disclaimers that apply to the journal pertain.
References
- 1.Ardenkjaer-Larson JH, Fridlund B, Gram A, Hansson G, Hansson L, Lerche MH, Servin R, Thaning M, Golman K. Increase in signal-to-noise ration of > 10,000 times in liquid-state NMR. Proc Natl Acad Sci U S A. 2003;100:10158–10163. doi: 10.1073/pnas.1733835100. [DOI] [PMC free article] [PubMed] [Google Scholar]
- 2.Golman K, Ardenkjaer-Larson JH, Peterson JS, Mansson S, Leunbach I. Molecular imaging with endogenous substances. Proc Natl Acad Sci USA. 2003;100:10435–10439. doi: 10.1073/pnas.1733836100. [DOI] [PMC free article] [PubMed] [Google Scholar]
- 3.Wolber J, Ellner F, Fridlund B, Gram A, Johannesson H, Hansson G, Hansson L, Lerche MH, Mansson S, Servin R, Thaning M, Golman K, Ardenkjaer-Larson JH. Generating highly polarized nuclear spins in solution using dynamic nuclear polarization. Nucl Instr Meth Phys Res A. 2004;526:173–181. [Google Scholar]
- 4.Golman K, Zandt R, Thaning M. Real-time metabolic imaging. Proc Natl Acad Sci U S A. 2006;103:11270–11275. doi: 10.1073/pnas.0601319103. [DOI] [PMC free article] [PubMed] [Google Scholar]
- 5.Golman K, Zandt RI, Lerche M, Pehrson R, Ardenkjaer-Larson JH. Metabolic imaging by hyperpolarized 13C magnetic resonance imaging for in vivo tumour diagnosis. Cancer Res. 2006;66:10855–10860. doi: 10.1158/0008-5472.CAN-06-2564. [DOI] [PubMed] [Google Scholar]
- 6.Golman K, Petersson JS. Metabolic imaging and other applications of hyperpolarized 13C. Acad Radiol. 2006;13:932–942. doi: 10.1016/j.acra.2006.06.001. [DOI] [PubMed] [Google Scholar]
- 7.Kohler S, Yen Y, Wolber J, Chen A, Albers M, Bok R, Zhang V, Tropp J, Nelson S, Vigneron D, Kurhanewicz J, Hurd R. In vivo 13-carbon metabolic imaging at 3t with hyperpolarized 13c-1-pyruvate. Magn Reson Med. 2007;58:65–69. doi: 10.1002/mrm.21253. [DOI] [PubMed] [Google Scholar]
- 8.Chen AP, Albers MJ, Cunningham CH, Kohler SJ, Yen Y-F, Hurd RE, Tropp J, Bok R, Pauly JM, Nelson SJ, Kurhanewicz J, Vigneron DB. Hyperpolarized C-13 spectroscopic imaging of the TRAMP mouse at 3T - initial experience. Magn Reson Med. 2007 doi: 10.1002/mrm.21256. In Press. [DOI] [PubMed] [Google Scholar]
- 9.Cunningham CH, Chen AP, Albers MJ, Kurhanewicz J, Hurd RE, Yen YF, Pauly JM, Nelson SJ, Vigneron DB. Double spin-echo sequence for rapid spectroscopic imaging of hyperpolarized 13C. J Magn Reson. 2007;187:357–362. doi: 10.1016/j.jmr.2007.05.014. [DOI] [PubMed] [Google Scholar]
- 10.Meyer CH, Pauly JM, Macovski A, Nishimura DG. Simultaneous spatial and spectral selective excitation. Magn Reson Med. 1990;15:287–304. doi: 10.1002/mrm.1910150211. [DOI] [PubMed] [Google Scholar]
- 11.Pauly J, Nishimura D, Macovski A. A k-space analysis of small-tip-angle excitation. J Magn Reson. 1989;81:43–56. doi: 10.1016/j.jmr.2011.09.023. [DOI] [PubMed] [Google Scholar]
- 12.Pauly JM, Spielman D, Macovski A. Echo-planar spin-echo and inversion pulses. Magn Reson Med. 1993;29:776–782. doi: 10.1002/mrm.1910290609. [DOI] [PubMed] [Google Scholar]
- 13.Zur Y. Design of improved spectral-spatial pulses for routine clinical use. Magn Reson Med. 2000;43:410–420. doi: 10.1002/(sici)1522-2594(200003)43:3<410::aid-mrm13>3.0.co;2-3. [DOI] [PubMed] [Google Scholar]
- 14.Butts K, Riederer SJ, Ehman RL, Thompson RM, Jack CR. Interleaved echo planar imaging on a standard MRI system. Magn Reson Med. 1994;31:67–72. doi: 10.1002/mrm.1910310111. [DOI] [PubMed] [Google Scholar]


