

Abstract
Mass spectrometry has become an indispensable tool for the global study of metabolites (metabolomics), primarily using electrospray ionization mass spectrometry (ESI-MS). However, many important classes of molecules such as neutral lipids do not ionize well by ESI and go undetected. Chemical derivatization of metabolites can enhance ionization for increased sensitivity and metabolomic coverage. Here we describe the use of tris(2,4,6,-trimethoxyphenyl)phosphonium acetic acid (TMPP-AA) to improve liquid chromatography (LC)/ESI-MS detection of hydroxylated metabolites (i.e. lipids) from serum extracts. Cholesterol which is not normally detected from serum using ESI is observed with attomole sensitivity. This approach was applied to identify four endogenous lipids (hexadecanoyl-sn-glycerol, dihydrotachysterol, octadecanol, and alpha-tocopherol) from human serum. Overall, this approach extends the types of metabolites which can be detected using standard ESI-MS instrumentation and demonstrates the potential for targeted metabolomics analysis.
The comprehensive analysis of metabolites is important to the developing field of global metabolomics. Liquid chromatography/electrospray ionization mass spectrometry (LC/ESI-MS) has become the primary tool for metabolomic studies due to its inherent sensitivity, specificity, selectivity, and throughput. However, the structural diversity and dynamic concentration range presented by endogenous metabolites greatly complicates comprehensive metabolite detection.1 While molecules possessing acidic or basic groups are often detected, many important classes of metabolites lacking these groups go undetected. Neutral lipids constitute one class of physiologically important and chemically diverse metabolites which are of great interest for metabolomics investigations2–6 but often go undetected by conventional ESI necessitating the use of other techniques such as high-performance liquid chromatography (HPLC), atmospheric pressure chemical ionization (APCI),7 immunoassay-based methods, and gas chromatography/mass spectrometry (GC/MS).8 While these are important approaches they have disadvantages vs. ESI-MS: APCI requires additional instrumentation and immunoassays are limited by availability of antibodies. While GC/MS is a popular method for lipid analysis, it has a limited mass range and typically generates significant fragmentation making molecular ion determination ambiguous.
One property of a large number of neutral lipids is the presence of a hydroxyl group. While this does not ionize via ESI, it does provide a handle for chemical modification to improve ionization. For example, previously, we have derivatized neutral steroids as sulfate esters to enhance detection using negative nanoelectrospray ionization.9 While this approach allowed detection at the high attomole level, the derivatization approach proved difficult to routinely perform. One promising chemical modification of the hydroxyl group is to use phosphonium derivatization, which has been shown to be useful for a broad range of molecules including peptides10,11 and glycosylation mapping.12 For example, Barry and Leavens13,14 have shown that phosphonium derivatization works for a wide range of pure compounds including alcohols, carboxylic acids, steroids and amines for improved characterization using LC/ESI-MS.12–18 Here we extend this work to detect neutral lipids directly from serum extracts using phosphonium derivatization. Specifically, we describe new methods for preparing and using a phosphonium label, tris(2,4,6,-trimethoxyphenyl)phosphonium acetic acid (TMPP-AA), and demonstrate that this can be used to detect neutral lipids from human serum using LC/ESI-MS analysis.
EXPERIMENTAL
Reagents
All reagents were obtained in high purity except when noted otherwise. Acetone, methanol, iodoacetic acid, dichloromethane, acetonitrile, 1-hexadecanoyl-sn-glycerol, dihydrotachysterol, 1-octadecanol, hydrochloric acid, norethindrone, cortisol, and cholesterol were purchased from Sigma-Aldrich (St. Louis, MO, USA). Tris(2,4,6,-trimethoxyphenyl)phosphine was purchased from Strem Chemicals (Newburyport, MA, USA). All solvents used for ESI-TOF-MS, ESI Q-TOF, and ESI linear ion trap (LTQ) studies were either HPLC grade from J. T. Baker (Phillipsburg, NJ, USA) or Optima grade from Fisher Scientific (Los Angeles, CA, USA).
Synthesis of tris(2,4,6,-trimethoxyphenyl)-phosphine acetic acid
A mixture of tris(2,4,6,-trimethoxyphenyl)phosphine (2 mmol) and iodoacetic acid (2 mmol) dissolved in dry acetone (5 mL) was allowed to react for 48 h at room temperature. After the completion of the reaction, the precipitate that formed was filtered and washed with acetone and then dried. Pure tris(2,4,6,-trimethoxyphenyl) phosphonium acetic acid (900 mg, 76%) was obtained from the reaction which was verified by 1H NMR (see Supplementary Fig. 1, Supporting Information) and ESI-TOF MS.
Derivatization of cholesterol with tris(2,4,6,-trimethoxyphenyl)phosphine acetic acid for sensitivity studies
An excess amount of cholesterol (104 mg, 0.269 mmol) was reacted with tris(2,4,6,-trimethoxyphenyl)phosphine acetic acid (44 mg, 0.074 mmol) in dichloromethane (600 μL) acidified with 3 M HCl (9 μL), allowed to react for 48 h at 65°C and then dried using a rotary evaporator (SpeedVac) to drive the reaction towards completion. Then 1 μL of the reaction mixture was diluted with acetonitrile (20 μL), followed by the addition of water (80 μL). Additional serial dilutions were performed for ESI-TOF analysis.
Derivatization yield for octadecanol
Since this approach is focused on endogenous metabolites which are not typically detected using ESI, it was necessary to use GC/MS to estimate the yield. Since cholesterol is not easily analyzed by GC/MS, octadecanol was used to estimate yield. However, it should be noted the yield for octadecanol is expected to be higher than the more hindered cholesterol. Analysis was performed using an Agilent 6850 GC/MS system, with a 30 m × 250 μm × 0.25 μm HP5 column (Agilent technologies, Palo Alto, CA, USA) with gas flow (helium) of 1.2 mL/min and oven temperature going from 40–260°C at 10°C/min and holding for 3 min. In this case, yield was determined based on the loss of octadecanol following the derivatization reaction (see Supplementary Fig. 2, Supporting Information). It was found that this was a slow derivatization reaction (30% yield in 1 day and 70% yield in 2 days) which is likely due to the steric hindrance of the TMPP group. Although the actual yield of the derivatization reaction is likely to be lower in ring-containing neutral lipids, our results indicated that prolonged reaction time did not increase the number of additional metabolites that were labeled by phosphonium. As such, all the subsequent reactions were performed for 2 days.
Preparation of dichloromethane extracts of human serum
The preparation of TMPP-acetic acid derivatives of lipids in human serum (male, H-1388; Sigma-Aldrich, St. Louis, MO, USA) involved dichloromethane (DCM) extraction followed by TMPP-AA derivatization. DCM extracts were prepared using 2:1 ratio (v/v) of DCM to human serum. Specifically, 100 μL of DCM was added to 50 μL human serum and vortexed for 1 h. The sample was then centrifuged at 12 000 rpm for 10 min to pellet the proteins. The supernatant was transferred into a clean 2 mL glass vial and dried in a SpeedVac. The dried extracts were derivatized using the cholesterol TMPP-AA derivatization described previously. To avoid the confounding effects of residual alcohols in this experiment, we used DCM for solvent extraction. Since this is a two-phase extraction it was performed for an extended period of time. We noted that both chloroform and DCM gave similar extraction performance.
Mass spectrometry
ESI TOF-MS experiments were performed on an Agilent ESI-TOF mass spectrometer equipped with an Agilent 1100 LC system (Agilent Technologies, Palo Alto, CA, USA). Prior to MS analysis, 1 μL of the reconstituted derivatized extract was diluted with 100 μL of 20% CH3CN in water of which 8 μL was injected in triplicate. LC separation was performed using a 2.1 mm × 100 mm (3.5 μm size column particle) C18 Symmetry column (Waters Corporation, Milford, MA, USA) at a flow rate of 250 μL/min. The gradient separation included a 10 min hold at 20% B, followed by linear gradient of 20–70% B for over 20 min, a 15 min hold at 70% B, then a 30 min linear gradient of 70–100% B. The column was then held at 100% B for 15 min before re-equilibration. Mobile phase A was H2O with 0.1% formic acid and mobile phase B was CH3CN with 0.1% formic acid. MS data was collected using capillary voltage of 3500 V, and a fragmentator voltage of 120 V, and scanning within the m/z range of 100–1000. Two internal calibrants at m/z 121.0509 and 922.0098, sprayed with a separate nebulizer, were employed to improve mass accuracy.
Product ion MS/MS experiments were performed on an ESI LTQ ion trap mass spectrometer (ThermoFinnigan, San Jose, CA, USA) or Agilent Q-TOF (Agilent Technologies, Palo Alto, CA, USA) equipped with an Agilent 1100 LC system. In the case of the ion trap, MS and multiple tandem MS scans were acquired using data-dependent scanning mode with scan event details as follows: A full scan MS within the mass range m/z 400–2000 followed by three data-dependent MS/MS scans of the three most intense ion from the full MS scan. MS/MS spectra were acquired using the following parameters: normalized collision energy of 35 eV, isolation width of 3 amu, microscan of 1, ion injection time of 8.9 ms, activation q of 0.25, and activation time of 30 ms. Samples (8 μL) were introduced using a reversed-phase fused-silica column (100 μm i.d., 15 cm long) pulled to a diameter of <5 μm and then packed with C18 stationary phase (Zorbax SB 5 μm particle size, Agilent). LC separation was performed using the same gradient and column described in the previous paragraph.
In the case of Q-TOF, the ESI-MS/MS analyses of TMPP ester derivatives were performed on an Agilent Q-TOF in the positive ion mode. Samples (8 μL) were injected and LC separation was performed using the same column and gradient conditions as in the ESI-TOF analysis. The source gas temperature was set to 350°C with a drying gas flow of 7 L/min, and a nebulization gas pressure of 15 psig. The capillary voltage was set at 4.0 kV, fragmentator at 150 V, and skimmer at 65 V. The collision energy was optimized for the best fragmentation patterns as shown in the Supporting Information, typically 60–80 V.
RESULTS AND DISCUSSION
Methodology overview
The first step was to prepare and purify the phosphonium label (Fig. 1), which in this case is accomplished in one step. This is then used to derivatize (again in a single-step reaction) metabolites with hydroxyl groups as phosphonium esters, using acid-catalyzed esterification. As a first step, model compounds were first used to test the methodologies and detection sensitivity. Once this was established, the approach was applied to the DCM extracts of human serum and the sample was analyzed with LC/ESI-MS. A time-of-flight (TOF) mass analyzer was used for accurate mass measurements and an ion trap with MS/MS was used to determine which of the metabolites contain the phosphonium label. This information was used to search metabolite databases and establish putative identifications for verification using spiking studies.
Figure 1.

Reaction scheme for the synthesis of the TMPP-AA reagent (top) and derivatization of steroids and fatty alcohols with TMPP-AA (bottom).
Acid-catalyzed esterification is a widely used method in GC/MS for fatty acid analysis. While the acid-catalyzed esterification reaction typically has lower yields than obtained using more reactive reagents, there are a number of reasons for using this approach: the TMPP-AA is simple to prepare, has good storage stability, and the acid-catalyzed esterification is easily performed making this a very accessible approach to improve metabolite coverage (i.e. neutral lipids).
Preparation of TMPP-AA
Tris(2,4,6,-trimethoxyphenyl)phosphine is reacted with iodoacetic acid in acetone at room temperature for 48 h (Fig. 1). This simple reaction produces 1 mm crystals of the TMPP-AA which are filtered and do not require further purification.
Derivatization of metabolites with TMPP-AA
TMPP-AA reacts with the hydroxyl groups of lipids through catalyzed esterification converting them into positively charged TMPP ester derivatives (Fig. 1). Three commercially available steroids, shown in Fig. 2, were selected and used as model compounds. These steroids have similar conjugated tetracyclic structure and contain hydroxyl groups with varying degrees of steric hindrance (norethindrone, cholesterol, cortisone; most to least hindered). ESI-TOF MS spectra of the resulting TMPP ester derivatives of cholesterol, cortisone, and norethindrone show characteristic charged molecular species (M+) at their expected m/z values of 959, 933, and 871 Da, respectively, with good signal-to-noise (S/N) ratios (Fig. 2). Comparison of the spectra shows variation in the observed peak intensities consistent with a lower labeling efficiency of the highly hindered norethindrone.
Figure 2.

ESI-TOF MS spectra of TMPP ester derivatives of model compounds: cholesterol, cortisone, and norethindrone.
Sensitivity of TMPP-cholesterol
The sensitivity of this method was tested using the trimethoxyphenylphosphonium ester derivative of cholesterol (TMPP-cholesterol, Fig. 3). These measurements were performed using serial dilutions of the TMPP-cholesterol followed by ESI-TOF MS analysis in triplicate using an injection volume of 8 μL. The limit of detection using direct infusion was found to be at 400 attomole (S/N ratio = 3, Fig. 3(B)), a significant advancement considering that cholesterol is typically not detected from human serum extracts using ESI-MS. In addition, it should be noted that the ESI-TOF does not have the advantage of selective ion monitoring experiments performed with quadrupole mass analyzers, suggesting the potential for significantly higher sensitivity. The sensitivity for ESI detection of TMPP-cholesterol is comparable to other approaches. For example, the sulfated derivative of pregnenolone was detected at 200 attomole using LC/ESI-MS.9 The use of Girard P as the derivatizing reagent reported by Griffiths et al. also demonstrated to provide high-sensitivity measurement of steroids and sterols in human plasma. Neutral oxosteroids and oxysterols were derivatized to Girard P hydrazones and identified by ESI and matrix-assisted laser desorption/ionization (MALDI) at pictogram level.19,20 Using a tailor-made derivatization reagent 4-(2-(trimethylammonio) ethoxy) benzenaminium halide and LC/ESI-MS analysis, Irth and co-workers21 reported various aldehydes were captured and detected from human urine at nano-molar concentration.
Figure 3.

Fragmentation pattern and sensitivity of TMPP-cholesterol: (A) Characteristic ESI-MS/MS of TMPP derivatives and fragmentation scheme *TMPP-cholesterol. The product ion at m/z 181 is due to (B) Extracted ion chromatogram of TMPP-cholesterol as a function of concentration. Inset: Expanded view of the overlay extracted ion chromatograms and mass spectra of TMPP-cholesterol at 400 attomole (S/N ratio = 3).
Extraction and derivatization of human serum extracts
Typically in metabolomics experiments, proteins are precipitated using organic solvents.22–24 To minimize sample losses and ensure solubilization of a wide range of lipids, a direct extraction using DCM was used. This also provides a simple and efficient means for removing lipophilic metabolites from the aqueous phase which contains proteins, peptides, and many other strongly ionizing metabolites. To test this approach, human serum was extracted with DCM for 1 h with vortexing to ensure good contact between the two phases. The DCM phase was dried and reacted with TMPP-AA as shown in Fig. 1 and both the underivatized and derivatized serum extracts were analyzed using ESI-MS to maximize metabolite coverage.
LC/MS and molecular feature extraction
Reversed-phase LC/ESI-TOF was used to provide accurate mass measurements to facilitate the number of metabolites following derivatization. A molecular feature extractor (Agilent Technologies, Palo Alto, CA) was used to quantify the effect of labeling on the number of observed features. Features are discrete molecular entities defined by a particular retention time and mass. This software was set to group ions by retention time, extract ions (m/z) with consideration of possible adducts (Na+, K+ and ), removes isotopes and features with S/N ratio <5. The same procedures were performed on unlabeled datasets and comparison of the unlabeled vs. labeled LC/MS datasets reveals a 40% increase in the number of features detected in the labeled sample, as shown in Fig. 4 (758 features for the unlabeled and 1071 features for the TMPP-labeled serum). These additional features are observed to elute at later chromatographic times than the TMPP-AA (which elutes at 16 min), showing a significant impact on the chromatographic separation of metabolites. For example, many small metabolites are not retained well on a reversed-phase column, reducing detection via LC/ESI-MS approaches, as a result of the ionization suppression that typically occurs at the solvent front. However, derivatization with the non-polar TMPP group increases the retention time. As shown in Fig. 4, the phosphonium greatly increases the number of small metabolites (just above the phosphonium mass indicated by the blue line at m/z 591) with the greatest increase with retention times between 16 to 30 min. It should be noted that in the case of metabolites with multiple hydroxyl groups, while it is theoretically possible to attach multiple phosphonium groups, in practice few multiply charged are observed, presumably due to both coulombic repulsion and steric hindrance.
Figure 4.
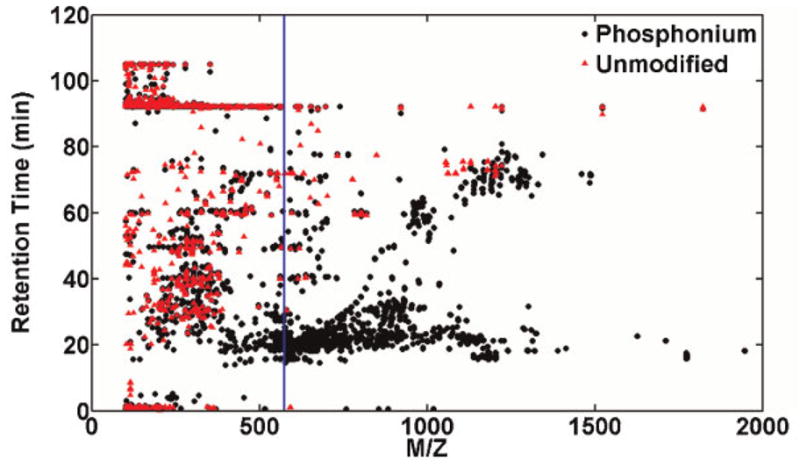
Comparison of the number of features detected in labeled and unlabeled human serum dichloromethane extracts: Comparison of the LC/MS features detected for the labeled (black circles) reveals an increase in features vs. the unlabeled (red triangles) serum extract. For reference, a blue line is shown to indicate the m/z of the TMPP-AA reagent peak.
Identification of phosphonium-labeled neutral lipids in human serum
Four chemically diverse metabolites (octadecanol, hexadecanoyl-sn-glycerol, dihydrotachysterol, and alpha-tocopherol) were selected for validation. This was accomplished in two ways: (1) by spiking the pure compound into human serum and repeating the extraction, labeling, and LC/ESI-TOF measurements to confirm retention times (see Supplementary Fig. 3, Supporting Information). (2) Comparison of the fragmentation patterns of the derivatized pure compounds with those detected in the derivatized human serum using LC/ESI-QTOF tandem mass spectrometry (MS/MS) (see Supplementary Figs. 4–8, Supporting Information).
We noted that quantitative analysis can be estimated by integrating the peak area of the spiked compound in the extracted ion chromatograms (EICs) at different spiking concentrations.25 To test the quantification using this phosphonium derivatization, alpha-tocopherol was spiked at different concentrations into the DCM-extracted human serum and derivatized using the same labeling procedures. MS/MS fragmentation patterns confirmed the compound as alpha-tocopherol (Supplementary Fig. 8, Supporting Information). LC/ESI-MS was run in replicates and the EIC peak areas corresponding to alpha-tocopherol elution were measured. Figure 5 displays a standard curve showing a linear response (R2 = 0.986) from which the concentration of alpha-tocopherol in human serum was estimated to be 45 μM.
Figure 5.

Calibration curve for the determination of alpha-tocopherol in human serum. Error bars represent one standard deviation based on four individual measurements.
CONCLUSIONS
It is shown that phosphonium labeling provides a simple and inexpensive approach to detect neutral lipids from a human serum extract. Specifically, this approach uses acid-catalyzed esterification. Tris(2,4,6,-trimethoxyphenyl)phosphonium acetic acid (TMPP-AA) is found to greatly enhance detection of lipids, for example, cholesterol which is not normally detected by ESI-MS is observed with attomole sensitivity. Using this approach, neutral lipids (hexadecanoyl-sn-glycerol, dihydrotachysterol, octadecanol, and alpha-tocopherol) from human serum are identified and validated.
Supplementary Material
Acknowledgments
This work was supported by NIH SNAPS grant MH062261 and DOE grant DE-AC02-05CH11231. We gratefully acknowledge Jaroslaw Kalisiak for his guidance in the preparation of TMPP-AA.
Contract/grant sponsor: NIH SNAPS Grant; contract/grant number: MH062261.
Contract/grant sponsor: DOE; contract/grant number: DE-AC02-05CH11231.
Footnotes
This article is a U.S. Government work and is in the public domain in the U.S.A.
Additional supporting information may be found in the online version of this article.
References
- 1.Ma S, Chowdhury SK, Alton KB. Curr Drug Metab. 2006;7:503. doi: 10.2174/138920006777697891. [DOI] [PubMed] [Google Scholar]
- 2.Fahy E, Subramaniam S, Brown HA, Glass CK, Merrill AH, Jr, Murphy RC, Raetz CRH, Russell DW, Seyama Y, Shaw W, Shimizu T, Spener F, van Meer G, VanNieuwenhze MS, White SH, Witztum JL, Dennis EA. J Lipid Res. 2005;46:839. doi: 10.1194/jlr.E400004-JLR200. [DOI] [PubMed] [Google Scholar]
- 3.Gross RW, Jenkins CM, Yang J, Mancuso DJ, Han X. Prostaglandins Other Lipid Mediat. 2005;77:52. doi: 10.1016/j.prostaglandins.2004.09.005. [DOI] [PubMed] [Google Scholar]
- 4.Han X, Gross RW. J Lipid Res. 2003;44:1071. doi: 10.1194/jlr.R300004-JLR200. [DOI] [PubMed] [Google Scholar]
- 5.Maxfield FR, Mondal M. Biochem Soc Trans. 2006;34:335. doi: 10.1042/BST0340335. [DOI] [PubMed] [Google Scholar]
- 6.Maxfield FR, Tabas I. Nature. 2005;438:612. doi: 10.1038/nature04399. [DOI] [PubMed] [Google Scholar]
- 7.Nordstrom A, Want E, Northen T, Lehtio J, Siuzdak G. Anal Chem. 2008;80:421. doi: 10.1021/ac701982e. [DOI] [PubMed] [Google Scholar]
- 8.Chard T. An Introduction to Radioimmunoassay and Related Techniques. 5. Elsevier; New York: 1995. [Google Scholar]
- 9.Chatman K, Hollenbeck T, Hagey L, Vallee M, Purdy R, Weiss F, Siuzdak G. Anal Chem. 1999;71:2358. doi: 10.1021/ac9806411. [DOI] [PubMed] [Google Scholar]
- 10.Huang ZH, Wu J, Roth KD, Yang Y, Gage DA, Watson JT. Anal Chem. 1997;69:137. doi: 10.1021/ac9608578. [DOI] [PubMed] [Google Scholar]
- 11.Roth KD, Huang ZH, Sadagopan N, Watson JT. Mass Spectrom Rev. 1998;17:255. doi: 10.1002/(SICI)1098-2787(1998)17:4<255::AID-MAS1>3.0.CO;2-4. [DOI] [PubMed] [Google Scholar]
- 12.Czeszak X, Morelle W, Ricart G, Tetaert D, Lemoine J. Anal Chem. 2004;76:4320. doi: 10.1021/ac049767q. [DOI] [PubMed] [Google Scholar]
- 13.Barry SJ, Carr RM, Lane SJ, Leavens WJ, Manning CO, Monte S, Waterhouse I. Rapid Commun Mass Spectrom. 2003;17:484. doi: 10.1002/rcm.933. [DOI] [PubMed] [Google Scholar]
- 14.Leavens WJ, Lane SJ, Carr RM, Lockie AM, Waterhouse I. Rapid Commun Mass Spectrom. 2002;16:433. doi: 10.1002/rcm.559. [DOI] [PubMed] [Google Scholar]
- 15.Cartwright AJ, Jones P, Wolff JC, Evans EH. Rapid Commun Mass Spectrom. 2005;19:1058. doi: 10.1002/rcm.1883. [DOI] [PubMed] [Google Scholar]
- 16.Czeszak X, Ricart G, Tetaert D, Michalski JC, Lemoine J. Rapid Commun Mass Spectrom. 2002;16:27. doi: 10.1002/rcm.532. [DOI] [PubMed] [Google Scholar]
- 17.Higashi T, Shimada K. Anal Bioanal Chem. 2004;378:875. doi: 10.1007/s00216-003-2252-z. [DOI] [PubMed] [Google Scholar]
- 18.Shen TL, Huang ZH, Laivenieks M, Zeikus JG, Gage DA, Allison J. J Mass Spectrom. 1999;34:1154. doi: 10.1002/(SICI)1096-9888(199911)34:11<1154::AID-JMS875>3.0.CO;2-8. [DOI] [PubMed] [Google Scholar]
- 19.Griffiths WJ, Liu S, Alvelius G, Sjövall J. Rapid Commun Mass Spectrom. 2003;17:924. doi: 10.1002/rcm.1002. [DOI] [PubMed] [Google Scholar]
- 20.Griffiths WJ, Hornshaw M, Woffendin G, Baker SF, Lockhart A, Heidelberger S, Gustafsson M, Sjoall J, Wang YQ. J Proteome Res. 2008;7:3602. doi: 10.1021/pr8001639. [DOI] [PMC free article] [PubMed] [Google Scholar]
- 21.Eggink M, Wijtmans M, Ekkebus R, Lingeman H, de Esch IJP, Kool J, Niessen WMA, Irth H. Anal Chem. 2008;80:9042. doi: 10.1021/ac801429w. [DOI] [PubMed] [Google Scholar]
- 22.Chace DH. Chem Rev. 2001;101:445. doi: 10.1021/cr990077+. [DOI] [PubMed] [Google Scholar]
- 23.Villas-Boas SG, Mas S, Akesson M, Smedsgaard J, Nielsen J. Mass Spectrom Rev. 2005;24:613. doi: 10.1002/mas.20032. [DOI] [PubMed] [Google Scholar]
- 24.Want EJ, O’Maille G, Smith CA, Brandon TR, Uritboonthai W, Qin C, Trauger SA, Siuzdak G. Anal Chem. 2006;78:743. doi: 10.1021/ac051312t. [DOI] [PubMed] [Google Scholar]
- 25.Callender HL, Forrester JS, Ivanova P, Preininger A, Milne S, Brown HA. Anal Chem. 2007;79:263. doi: 10.1021/ac061083q. [DOI] [PubMed] [Google Scholar]
Associated Data
This section collects any data citations, data availability statements, or supplementary materials included in this article.