Abstract
Nanoformulated drugs can improve pharmacodynamics and bioavailability while serving also to reduce drug toxicities for antiretroviral (ART) medicines. To this end, our laboratory has applied the principles of nanomedicine to simplify ART regimens and as such reduce toxicities while improving compliance and drug pharmacokinetics. Simple and reliable methods for manufacturing nanoformulated ART (nanoART) are shown. Particles of pure drug are encapsulated by a thin layer of surfactant lipid coating and produced by fractionating larger drug crystals into smaller ones by either wet milling or high-pressure homogenization. In an alternative method free drug is suspended in a droplet of a polymer. Herein, drug is dissolved within a polymer then agitated by ultrasonication until individual nanosized droplets are formed. Dynamic light scattering and microscopic examination characterize the physical properties of the particles (particle size, charge and shape). Their biologic properties (cell uptake and retention, cytotoxicity and antiretroviral efficacy) are determined with human monocyte-derived macrophages (MDM). MDM are derived from human peripheral blood monocytes isolated from leukopacks using centrifugal elutriation for purification. Such blood-borne macrophages may be used as cellular transporters for nanoART distribution to human immunodeficiency virus (HIV) infected organs. We posit that the repackaging of clinically available antiretroviral medications into nanoparticles for HIV-1 treatments may improve compliance and positively affect disease outcomes.
Keywords: Immunology, Issue 46, NanoART, antiretroviral, HIV/AIDS, monocytes/macrophages, wet milling, homogenization, ultrasonication
Protocol
NanoART manufacturing
1. Wet Milling NanoART by NETZSCH MicroCer Methods
Weigh the drug crystals and various surfactants that will be used to make the nanoformulations using an analytical balance and mix them with 10 mM Hepes buffer, pH 7.8 using a T-18 Ultraturrax mixer until completely dispersed. The percent of the drug in the formulation should be between 1 - 2%.
For continuous milling, make sure that the chiller and the compressor is on. The outlet pressure should be around 100 PSI before starting to mill your sample.
Turn on the control unit and rotate the grinding tank so that the grinding media can be loaded in the tank.
Add 50 mL of beads to the grinding chamber using a funnel. Make sure that there are no beads in the threads or anywhere outside the grinding chamber to avoid leaks in the mechanical seal.
Make sure that the O-ring is in its place on the milling chamber. Select an appropriate screen mesh size and use the appropriate lid assembly and secure the lids by tightening the nuts. The screen mesh size should be at least half the size of the beads. Use a large screen mesh size to avoid the product from clogging the filter while continuous milling.
Lower the grinding chamber to make it horizontal using the knob provided on the top of the chamber and make sure that the product outlet tube empties into the collecting vessel.
Add the drug suspension with various amounts of surfactants to the product inlet. The minimum volume of the suspension should be 100 mL. This will prevent the milling chamber from overheating and also avoid bead contamination due to less wear on parts
Start the pump using the control unit. The flow rate can be varied as required for your formulation (~ 50 - 150 mL/min).
Turn the agitator on and adjust the speed on the control unit. The speed can be increased from 620 rpm to 4320 rpm on a MicroCer. Monitor the temperature using the temperature gauge that is attached on top on the grinding chamber and make sure that there is no overheating.
Mill the sample at various speeds and flow rates and take out small aliquots (~1 mL) of the formulation for size and charge measurements using a Diffraction Light Scattering Brookhaven Zetasizer (Table 1).
After the desired size is obtained, stop the milling using the control unit. With the pump still on, collect the sample into a flask. Allow the drug to completely drain into the sample collection flask.
Switch off the pump. To remove the beads, place a collection tray under the unit. Loosen the nuts on the front plate of the lid assembly and collect the beads in the tray. Take off the front plate and use a deionized water bottle to wash the beads into the tray.
Transfer the milled suspension into 50 mL centrifuge tubes and set the centrifuge to 10,000 rpm (10,174 rcf) for 30 minutes. Upon completion of the centrifuge cycle, measure the amount of supernatant and replace with the same amount of fresh surfactant solution.
Once resuspension is complete, transfer the suspension to the milling chamber and mill for 10 minutes. Take an aliquot (~ 1mL) and measure the size and charge of the sample again using the Zetasizer (Table 1).
Perform a post-use cleaning of the MicroCer using deionized water and 70% ethanol.
Measure the concentration of the nanoART formulations using HPLC. In our case, we assessed the samples by reversed phase HPLC using triplicate 20 μL injections onto a YMC Octyl C8 column (Waters Inc., Milford, MA) with a C8 guard cartridge. Mobile phase consisting of 48% acetonitrile / 52% 25mM KH2PO4, pH 4.15 is pumped at 0.4 mL/min with UV/Vis detection at 272 nm. For all drug measurements, quantitation is determined by comparison to a standard curve of each free drug (0.025-100 μg/ mL) prepared in methanol.
2. NanoART Homogenization using the Avestin EmulsiFlex C5
Measure the drug crystals and various surfactants that will be used to make the nanoformulations using an analytical balance and mix them with 10 mM Hepes buffer, pH 7.8 using a T-18 Ultraturrax mixer to obtain complete dispersion.
Transfer the suspension to the homogenizing vessel and begin recirculation. Make sure that the chiller is on before starting to homogenize the sample
Increase the pressure gradually until the meter reads 20,000 ± 2,000 psi and continue to homogenize until the target particle size is achieved. This usually takes between 45 - 60 minutes. Take an aliquot (~ 1mL) periodically and measure the size and charge of the sample using a Zetasizer (Table 1).
Transfer the homogenized suspension from the homogenizer to 50 mL centrifuge tubes and set the centrifuge to 10,000 rpm (10,174 rcf) for 30 minutes. Upon completion of the centrifuge cycle, measure the amount of supernatant and replace with an equal volume of fresh surfactant solution.
After resuspension, transfer the suspension to the C5 homogenizer. Restart the circulation and return the homogenizing pressure to 20,000 ± 2,000 psi and homogenize for 30 minutes. Measure the size and charge of the formulation using the Zetasizer (Table 1).
Perform post cleaning of the unit with deionized water and ethanol as the solvent.
Measure the concentration of the samples using HPLC.
3. Sonication using the Cole Parmer Ultrasonic Processor
Measure 50 mL of dichloromethane into a glass beaker. Measure 6 g of poly (lactic-co-glycolic acid) (PLGA) using the analytical balance, add to the dichloromethane, and mix until complete dissolution is observed.
Measure 1.25 g of the drug crystals and add to the dichloromethane/ PLGA solution. Mix to obtain complete dissolution.
Make 1% polyvinyl alcohol (PVA) surfactant solution and cool it using an ice bath. Make sure that the surfactant solution is cool before the addition of the organic solution that contains the dissolved drug.
Pour the drug solution into the 1% PVA surfactant solution and start the ultrasonicator at 50% amplitude. Make sure that the surfactant solution is placed in an ice bath. The amplitude of the sonicator can be reduced to ~ 30% amplitude for smaller batches of samples. Sonicate the sample for 10 minutes.
Take out a small aliquot (~ 1 mL) for particle size analysis (Table 1). If the size of the particles is greater than 1.5 μm, sonicate the sample at 2-minute intervals up to a maximum of 16 minutes total. Observe the samples under the microscope at 20x and document observations (Figure 1A).
Use a stir plate to create an adequate vortex for the remaining suspension and continue mixing overnight at room temperature.
Weigh 8 g mannitol into a flask and add 80 mL RO water. Mix until complete dissolution is observed and store at room temperature. This will be used for resuspension after centrifugation if samples need to be lyophilized.
Collect the suspension after 24 hours and pour into 50 mL centrifuge tubes. Centrifuge the samples at a speed of 8,000 rpm for 20 minutes at 5°C. Decant the supernatant and resuspend one half the sample in 75 mL of filtered reverse osmosis (RO) water and the other half in 75 mL of 0.5% cetyl trimethylammonium bromide (CTAB) surfactant.
Centrifuge the samples again at a speed of 8,000 rpm for 20 minutes at 5°C and resuspend each of the pellets with a total of 20 mL mannitol solution.
After the second resuspension, measure the size of the particles using the Zetasizer (Table 1).
Use suitable vials to transfer the remaining suspension and place them into the lyophilizer.
Measure the concentration of the samples using HPLC.
4. NanoART Morphology
Take nanoART suspension and briefly sonicate at 20% amplitude for 5 seconds with a sonication probe. Transfer 10 μL of the suspension into 1.5 mL of RO water within a 1.7 mL microcentrifuge tube and vortex for 10 seconds.
Take a 50 μL sample of the water-nanoART solution and transfer to a filtration apparatus consisting of a Swinnex 13 polypropylene filter holder assembled with a 0.2 μm polycarbonate filtration membrane (Nuclepore Track-Etched). The filtration apparatus is primed with 50 μL 0.2μm filtered distilled water prior to the addition of the diluted drug suspension. Vacuum is then applied to the apparatus until the entire solution volume has been completely pulled past the filtration membrane.
Once the membrane is dry, it is affixed to an aluminum pin stub using double stick conductive carbon tape and sputter coated with palladium. The specimen stub is then imaged using, in our case, a JEOL JSM6300F low voltage, field emission scanning electron microscope (Figure 2).
5. NanoART Visualization
Take the prepared nanoART suspensions and sonicate them for 10 seconds at 20% amplitude with a sonication probe.
Take a microscope slide cover slip and place it on an inverted microscope. On the cover slip mix 15 μL of the nanoART suspension with 100 μL of phosphate buffered saline (PBS) and mix by pipetting up and down several times. Visualize the nanoparticles using a 20x objective (Figure 3).
Biology of nanoART
6. Isolation and Preparation of Blood Borne Monocyte and Monocyte-derived Macrophages (MDM)
Obtain human monocytes by leukapheresis from HIV-1 and hepatitis seronegative donors and purify the cells by counter-current centrifugal elutriation. Assess cell purity by immunolabeling with anti-CD68 (clone KP-1) from Wright-stained cytospins 1.
Culture purified monocytes in DMEM supplemented with 10% heat-inactivated pooled human serum, 1% glutamine, 50 μg/ mL gentamicin, 10 μg/ mL ciprofloxacin and 1000 U/ mL recombinant human macrophage colony stimulating factor (MCSF) at a concentration of 1x10⁶ cells/ mL at 37°C in a humidified atmosphere with 5% CO2. Plate 2x10⁶ cells per well in 6-well plates and culture cells for 7 days in order to allow monocytes to differentiate into macrophages 1. (Figure 3A)
7. Cell Uptake and Collection
Mix nanoART with culture media (without MCSF) to a final concentration of 100 μM and add 1 mL of treatment medium to each well.
At desired time point, or when cells are fully loaded with nanoART (Figure 2), remove all treatment medium and wash cells 3 times with 1 mL PBS to remove any particles that have not been taken in by the cells. In 1 mL of PBS, remove adherent cells from the bottom of the well by using a cell lifter and place them into a 1.7 mL microcentrifuge tube 2-4.
Centrifuge the cells at 1,000 rcf at 4°C for 10 minutes. Remove the supernatant and add 200 μL of 100% methanol. Lyse the cells and dissolve nanoART by briefly (2-5 seconds) sonicating the pellet with a sonicating probe at 20% amplitude . Store samples in -80°C until ready to analyze drug content.
8. Intracellular Retention of NanoART
Treat MDM as described in 7.1.
At desired time point, wash cells as described in 7.2; but instead of immediately scraping up cells, fix cells for 15 min at room temperature in a solution of 3% glutaraldehyde in 0.1 M phosphate buffer (pH 7.4) and further fix them for 10 minutes with 1% osmium tetroxide in 0.1 M phosphate buffer (pH 7.4).
Remove fixative and scrape cells in 1 mL PBS as described in 7.2. Also, collect and centrifuge cells as describe in 7.2; but instead of adding methanol to the pellet, add 200 μL of the glutaraldehyde fixative solution.
Cut cell pellet into thin (80 nm) sections with a microtome. Stain the sections with uranyl acetate and lead citrate. Observe stained sections using transmission electron microscopy (Figure 4).
9. ART Release
Treat cells as described in 7.1-7.2; however, instead of collecting cells after washing, replace PBS with 2 mL cell culture medium without MCSF and without nanoART.
On indicated days, or as indicated by cell culture medium turning yellow, exchange half of the medium.
At desired day, collect 1 mL of the cell medium along with replicate cells as described in 7.2-7.3.
Process cells as described in 7.3. Process medium by adding 150 μL of medium sample to 1 mL of 100% methanol and vortex at full speed for 10 seconds. Then centrifuge the samples at 21,000 rcf for 10 minutes. Remove the supernatant and transfer it to a new tube. Evaporate the methanol with a vacuum centrifuge; this can take anywhere from 1 to 4 hours depending on the sample. Store samples in -80°C until ready for drug analysis.
10. Real-time Uptake of NanoART by Confocal Microscopy
Take mature MDM from step 6.2 and label the cells using a cell labeling solution such as Vybrant Cell Labeling Solution following the manufacture's instruction. Rinse the cells 3 times using 1 mL of culture medium to remove any excess dye.
Mix nanoART with culture medium as in step 7.1 using fluorescently labeled nanoART.
Add treatment medium with labeled nanoART immediately prior to imaging with a confocal microscope. Capture an image every 30 seconds for 4 hours using a 60x objective 5 (Videos 1 & 2).
HIV-1 Infection and Infectivity Assays
11. HIV-1ADA Infection
Treat cells as described in 9.1-9.3.
On desired days, remove all medium and replace with medium, without MCSF, containing HIV-1ADA at a multiplicity of infection of 0.01 viral particles/cell and incubate for 24 hours 1. Remove viral medium and replace with fresh, virus-free media. Culture cells for 10 days exchanging half the medium every other day or as necessary to keep cells alive (Figure 5) 6.
Ten days post-infection collect 10 μL of medium from each well, place in a 96-well plate, and store at -80°C until ready to perform retroviral (reverse) transcriptase analysis.
12. Reverse Transcriptase (RT) Assay
With each 10 μL sample from step 11.3, mix 10 μL of a solution that contains 100 mM Tris-HCl (pH 7.9), 300 mM KCl, 10 mM DTT, 0.1% nonyl phenoxylpolyethoxylethanol-40 (NP-40), and water. Incubate this mixture for 15 minutes at 37°C 7.
Then add 25 μL of a solution that contains 50 mM Tris-HCl (pH 7.9), 150 mM KCl, 5 mM DTT, 15 mM MgCl2, 0.05% NP-40, 10 μg/ mL poly (A), 0.250 U/ mL oligo d(T)12-18, and 10 μCi/ mL 3H-TTP to each well and incubate at 37°C for 18 hours 7.
Following incubation, add 50 μL of ice-cold 10% trichloroacetic acid (TCA) to each well. Harvest the wells onto glass fiber filters, and assess the filters for 3H-TTP incorporation by β-scintillation spectroscopy 7.
13. HIV-1p24 Detections
Wash the replicate cells from which retroviral transcriptase medium sample was removed in step 11.3 by rinsing with 1 mL of PBS 3 times.
Fix cells with 4% paraformaldehyde overnight at 4°C. The following morning rinse cells 3 times with PBS.
Use mouse monoclonal antibodies to HIV-1 p24 (1:10, Dako, Carpinteria, CA) to visualize HIV infection. Image cells under bright field using a 40x objective (Figure 6).
14. Representative Results:
| Drug | Size (nm) | PDI | Charge (mv) | Surfactants |
| IDV | 1052 | 0.286 | -24.58 | 0.5% P188, 5.0% SDS, 9.25% Sucrose |
| RTV | 233 | 0.273 | -7.47 | 0.5% P188, 9.25% Sucrose |
| ATZ | 840 | 0.192 | +25.47 | 0.5% P188, 0.1% mPEG 2000-DSPE, 1.0% DOTAP, 9.25% Sucrose |
| EFV | 347 | 0.235 | -13.52 | 1.0 % PVA |
Table 1. Physical characteristics of nanoART Table displays potential representative values for the physical characteristics of nanoART formulations manufactured using the indicated surfactants. Values include the mean diameter based upon the intensity of scattered light, the polydispersity index (PDI, an estimate of the distribution of particle size), and the zeta potential values obtained for various nanoformulation samples. Abbreviations used in the table: IDV: indinavir; RTV: ritonavir; ATV: atazanavir; EFV: effavirenz; PVA: polyvinylalcohol; SDS sodium dodecyl sulfate; P188: poloxamer 188 (also termed Pluronic F68); mPEG 2000-DSPE: methyl-poly(ethylene-glycol)1,2-distearoyl-phosphatidyl-ethanolamine; DOTAP: (1-oleoyl-2-[6-[(7-nitro-2-1,3-benzoxadiazol-4-yl) amino]hexanoyl]-3-trimethylammonium propane.
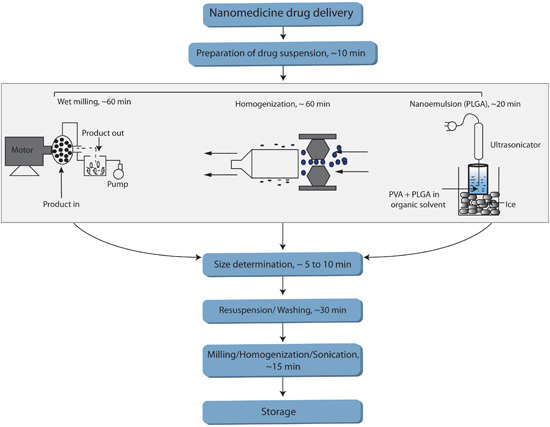 FIGURE 1. Flow chart summarizing various methods used to manufacture nanoART. Figure 1 summarizes various methods used to manufacture nanoART. The flowchart includes an anticipated time-allotment for each of the critical phases of the respective methods.
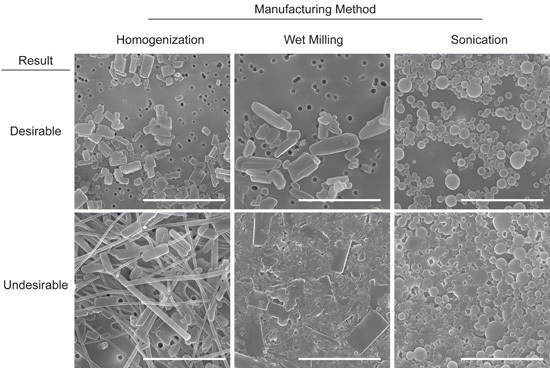 FIGURE 2. Representative images of desirable and undesirable NanoART morphology. Scanning electron microscopy analysis (magnification, 15,000X) of RTV nanoART produced by homogenization, wet milling, and sonication on top of a 0.2 μm polycarbonate filtration membrane. Measure bar equals 2.0 μm in all frames. Desirable nanoART consist, on average, of small (≤ 2 μm) self-contained particles with smooth edges that tend to have the same or similar shape. Undesirable nanoART vary greatly in both size and shape and can fuse and/or stick to one another.
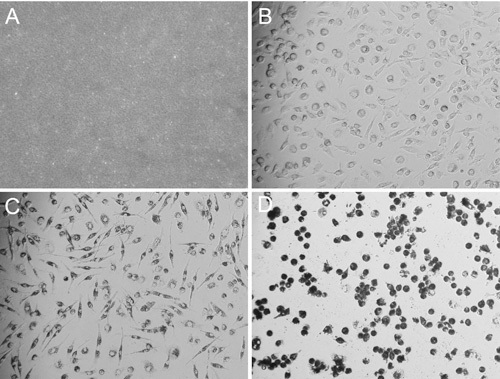 FIGURE 3. Images of desirable nanoART solution and of MDM taking up nanoART. Bright field microscopy images (all acquired using a 20x objective) of homogenized RTV-NP and MDM taking up nanoART. After combining 10 μL of RTV-NP solution with 100 μL of PBS on top of a glass cover slip, the particles are visible and resemble sand with only a few of the larger particles being individually identifiable (A). Image of fully differentiated and spindle shaped MDM before nanoART treatment (B). After the cells have taken up nanoART, they become darker and their nuclei become more apparent due to perinuclear distribution of nanoART; however, they still maintain their spindle shaped cell body (C). Once the cells become overloaded with nanoART, the nuclei become obscured; and the cells become rounded, losing their spindle shaped structure and potentially detaching from the bottom of the well (D).
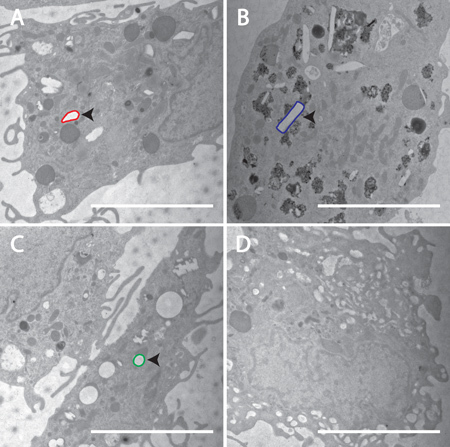 FIGURE 4. Confirmation of cellular incorporation of nanoART into MDM. Transmission electron microscopy (magnification, 15,000x) demonstrates uptake of nanoART into MDM exposed to RTV-NP from homogenization (A), RTV-NP from wet milling (B), RTV-NP from sonication (C), and untreated cells (D). Within the cells, the nanoART should be readily identifiable by their geometric shape. Note the lack of any obvious geometric structures in the control cell (D). An example of each particle has been outlined: red for homogenization (A), blue for wet milling (B), green for sonication (C). Particle structure should resemble that which was seen using SEM. Measure bar equals 5.0 μm in all frames.
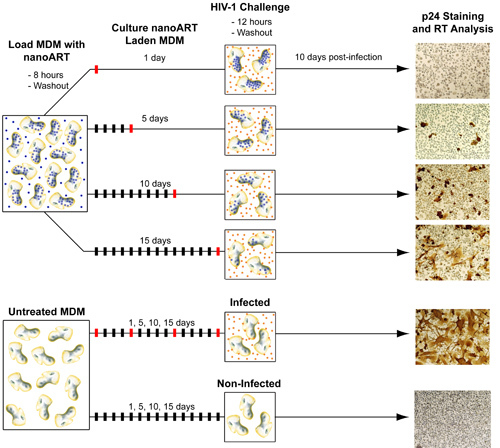 FIGURE 5. Diagram of method for testing antiretroviral efficacy of nanoART. In order to test the ability of nanoART to inhibit viral replication MDM must be first treated with nanoART and then exposed to HIV-1ADA. Similar to the ART release studies, MDM are loaded with nanoART and then washed to remove any particles that have not been internalized. NanoART laden MDM are then cultured up to 15 days with one half medium exchange every other day. During this time (generally on days 1, 5, 10, and 15) MDM are challenged with HIV-1ADA. After each viral exposure cells are cultured for another 10 days in order to allow the infection to progress. On day 10 post-infection media samples are collected for RT analysis and cells fixed and stained for p24 antigen. Non-nanoART treated MDM, both infected and uninfected, are also cultured in parallel and tested for presence of p24 antigen and RT activity.
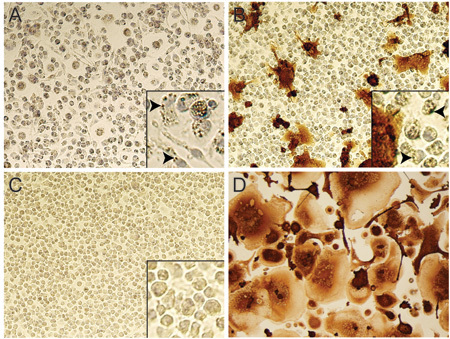 FIGURE 6. Testing of nanoART efficacy in HIV-1 infected MDM by p24 staining. Bright field images (20x objective) of RTV-NP treated MDM 10 days after being challenged with HIV-1ADA. No infection was present when cells were challenged with virus1 day post-nanoART treatment (A); note the presence of NP within the cytoplasm of most cells (A inset indicated by arrows). Infection was present when cells were exposed to virus 10 days after nanoART treatment (B), although much less so than cells not treated with nanoART (D); note the maintained presence of NP in some cells (B inset indicated by arrows), but fewer than at day 1 post-nanoART treatment (A inset). Image of cells that were neither treated with nanoART nor infected (C); note lack of NP within cell cytoplasm (C inset). Image of cells that were not treated with nanoART but exposed to HIV-1ADA (D).
VIDEO 1. Live cell confocal microscopy of poor RTV-NP uptake by MDM. Fluorescent microscopy of MDM labeled green with Vybrant DiO cell-labeling solution and treated with red-labeled RTV-NP. One image was taken every 30 seconds for 4 hour at 60x magnification. Click here to watch video
VIDEO 2. Live cell confocal microscopy of successful RTV-NP uptake by MDM. Fluorescent microscopy of MDM labeled green with Vybrant DiO cell-labeling solution and treated with red-labeled RTV-NP. One image was taken every 30 seconds for 4 hour at 60x magnification. Click here to watch video
Discussion
NanoART are designed to improve HIV-1 therapeutics. We have proposed a monocyte-macrophage based drug delivery system as a first step to develop such technologies for clinical use and as a laboratory testing system for nanoformulated drug development. Our past works have shown that the system is viable for such an application5,6.
In the current report, we have illustrated methods for synthesizing NP of commonly used HIV-1 medications (indinavir, IDV; ritonovir, RTV; efavirenz, EFV and atazanavir, ATV). This was achieved by wet milling, homogenization and ultrasonication. Importantly, our approach allows for modifications of nanoART physical characteristics such as size, shape and charge 5,6. By careful selection of surfactants, one can control the charge of the particle from highly negative to neutral to highly positive. By altering the processing time and intensity, one can control the size and render particles as small as ≤ 200 nm or as large as ≥ 3 μm. The shape of the particle can also be controlled, but to a lesser extent than the other physical characteristics. For example, spherical particles can be made via sonication with polymers while multi-sided geometric shapes can be produced via wet milling or homogenization. Wet milling and homogenization produce differently shaped particles, but this process is dependent on the fractionation method and cannot be directly controlled for. These properties of the manufacturing methods can enable researches to easily produce nanoART to exact design specifications. This is vitally important since the physicochemical properties of nanoART have a powerful effect upon both their stability and how they interact with cells. For example, we have shown that nanoART that are approximately 1 μm in size, have a strong positive charge, and have a multisided geometric shape are more rapidly taken up by macrophages, more stable once inside the cells, and released over a longer period of time 6.
A method for testing nanoART was developed that allows for simple screening of the particles' ability to be taken up, retained, and released by macrophages, one of the principle target cells of HIV-1, in addition to their capacity to inhibit viral replication. This allows one to easily differentiate nanoART based on performance and identify those that have the best chance of succeeding in an in vivo model, thus, increasing both the efficiency and speed of developing nanoART for human use.
It has been shown that mouse bone marrow macrophages when loaded ex vivo with nanoART and adoptively transferred by intravenous injection into humanized HIV-1 infected mice can travel to sites of active infection, including the central nervous system, and release drugs for up to 2 weeks to inhibit viral replication2-4. In addition, these nanoART loaded cells were also able to effectively reduce the numbers of virus-infected cells in plasma, lymph nodes, spleen, liver and lung as well as protect CD4+ cells2. These studies, although preliminary, demonstrate that a cell-mediated nanoART delivery system can distribute clinically significant amounts of drug to both blood and infected tissues. Because of the encouraging preliminary results from HIV-1 infected mouse studies, we are currently developing a simian immuno deficiency virus infected macaque model to further test the potential of nanoART for clinical use.
Disclosures
No conflicts of interest declared.
Acknowledgments
The work was supported by grants 1P01DA028555-01A1, 2R01 NS034239, 2R37 NS36126, P01 NS31492, P20RR 15635, P01MH64570, and P01 NS43985 (to H.E.G.) from the National Institutes of Health. The authors thank Ms. Robin Taylor for critical reading of the manuscript and outstanding graphic and literary support. We would like to thank Steve Grzelak for his wet-milling expertise. We would also like to thank Dr. Han Chen of the University of Nebraska-Lincoln electron microscopy core facility for supplying the scanning and transmission electron microscopy images. Finally, we would like to thank Megan Marquart for her expertise using live confocal microscopy.
References
- Gendelman HE. Efficient isolation and propagation of human immunodeficiency virus on recombinant colony-stimulating factor 1-treated monocytes. J Exp Med. 1988;167(4):1428–1441. doi: 10.1084/jem.167.4.1428. [DOI] [PMC free article] [PubMed] [Google Scholar]
- Dou H. Development of a macrophage-based nanoparticle platform for antiretroviral drug delivery. Blood. 2006;108(8):2827–2835. doi: 10.1182/blood-2006-03-012534. [DOI] [PMC free article] [PubMed] [Google Scholar]
- Dou H. Laboratory investigations for the morphologic, pharmacokinetic, and anti-retroviral properties of indinavir nanoparticles in human monocyte-derived macrophages. Virology. 2007;358:148–158. doi: 10.1016/j.virol.2006.08.012. [DOI] [PubMed] [Google Scholar]
- Dou H. Macrophage delivery of nanoformulated antiretroviral drug to the brain in a murine model of neuroAIDS. J Immunol. 2009;183(1):661–669. doi: 10.4049/jimmunol.0900274. [DOI] [PMC free article] [PubMed] [Google Scholar]
- Nowacek AS. Nanoformulated Antiretroviral Drug Combinations Extend Drug Release and Antiretroviral Responses in HIV-1-Infected Macrophages: Implications for NeuroAIDS Therapeutics. J Neuroimmune Pharmacol. 2010. [DOI] [PMC free article] [PubMed]
- Nowacek AS. NanoART synthesis, characterization, uptake, release and toxicology for human monocyte-macrophage drug delivery. Nanomed. 2009;4(8):903–917. doi: 10.2217/nnm.09.71. [DOI] [PMC free article] [PubMed] [Google Scholar]
- Kalter DC. Enhanced HIV replication in macrophage colony-stimulating factor-treated monocytes. J Immunol. 1991;146(1):298–306. [PubMed] [Google Scholar]


