Abstract
Objectives. We assessed the effect of social marketing incentives on dispositions toward retrofitting and retrofitting behavior among farmers whose tractors lacked rollover protective structures.
Methods. From 2006 to 2007, we conducted a quasi–randomized controlled trial with 391 farm owners in New York and Pennsylvania surveyed before and after exposure to 1 of 3 tractor retrofitting incentive combinations. These combinations were offered in 3 trial regions; region 1 received rebates; region 2 received rebates, messages, and promotion and was considered the social marketing region; and region 3 received messages and promotion. A fourth region served as a control.
Results. The social marketing region generated the greatest increases in readiness to retrofit, intentions to retrofit, and message recall. In addition, postintervention stage of change, intentions, attitudes, subjective norms, and perceived behavioral control levels were higher among farmers who had retrofitted tractors.
Conclusions. Our results showed that a social marketing approach (financial incentives, tailored messages, and promotion) had the greatest influence on message recall, readiness to retrofit tractors, and intentions to retrofit tractors and that behavioral measures were fairly good predictors of tractor retrofitting behaviors.
National Safety Council statistics show that farming has the highest fatality rate among US industries,1 with rates roughly 8 times the national average.2 Although state-to-state variation exists,3–5 it is estimated that more than one third of farm deaths in this country are tractor-related.6
Roughly half of tractor-related deaths result from overturns.7 Overturn fatalities occur when tractors lacking a roll bar or cab turn over, crushing the operator. Certified roll bars or cabs, referred to as rollover protective structures (ROPSs), have been shown to dramatically reduce injuries and fatalities.6 These devices limit the extent of the roll and hold the operator in a protective zone, provided seatbelts are used.
In 1985, ROPSs became standard equipment on new tractors.8 Before 1985, farmers frequently declined to purchase ROPSs to avoid the extra expense. Acquiring ROPSs for pre-1985 models entails locating, purchasing, and either self-installing or paying for installation.
Despite efforts to reduce US overturn fatalities, the percentage of tractors with ROPSs (30%–50% at the time the study was conducted) and annual rates of overturn fatalities (7/100 000 tractors) have improved more slowly than in other developed nations.7 Trends from 1960 to the late 1980s in Sweden (from 17 to 0.3 deaths/100 000 tractors),9 Denmark (from 30 to 2 deaths/100 000 tractors),9 West Germany (from 6.7 to 1.3 deaths/100 000 tractors),10 and Australia (reduction of unprotected tractors from 24% to 7%)11 have been more encouraging.
The lack of progress in the United States is likely attributable to several barriers. Installing a ROPS can be expensive and time consuming. A ROPS typically costs $600 to $1500, and several telephone calls may be required to locate the appropriate model.12 Lack of farmer interest has also been cited as a potential barrier.13 Successful programs in other countries have addressed these barriers by providing financial assistance and legislating mandatory installation. However, resistance to regulation from US farmers makes other approaches necessary.14
Recently, researchers have speculated that social marketing may be an effective means of increasing the percentage of ROPS-protected tractors.6 Social marketing identifies a population's needs, values, and barriers to change and designs interventions that address them. This approach differs from traditional interventions because it appeals to existing values and norms rather than trying to change them. Although the literature contains reports on the impact of financial assistance and messages on behavior,12,15 it lacks a scientific evaluation of which incentives or combination of incentives is most effective. No evaluation of the effect of social marketing on tractor retrofitting has been conducted.
The goals of the New York State ROPS Rebate Program are to increase the proportion of ROPS-equipped tractors and to increase farmers’ readiness to retrofit. We previously described the program design,16 target population identification,17 and identification of barriers to tractor retrofitting.18 We also reported data from the rebate program's hotline, along with inspections of self-installed ROPSs.19–21 Recently, we assessed the effect of retrofitting incentives and the overall efficacy of the rebate program.
METHODS
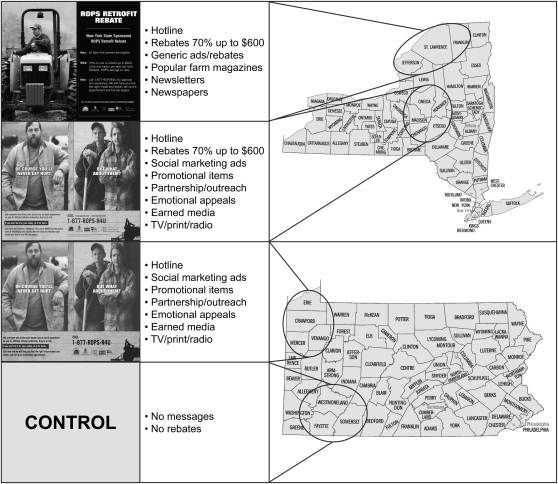
We defined 2 study regions in New York and 2 in Pennsylvania. The first, in northern New York, comprised Jefferson, St Lawrence, and Franklin counties, and the second, in central New York, comprised Otsego, Chenango, Madison, Herkimer, and Oneida counties. At random, the first region was selected to receive only the financial rebate; the second region received both the rebate and the social marketing messages and promotion (legislation stipulated that the rebate be offered throughout New York State). We designated region 2 as the social marketing region.
Our third region, in western Pennsylvania, consisted of Erie, Crawford, Mercer, and Venango counties; the fourth, in the south-central part of the state, covered Westmoreland, Somerset, and Fayette counties. At random, the third region received the messages and promotion, and the fourth received nothing (control). No rebates were offered in Pennsylvania.
We selected counties with high percentages of small crop and livestock farms, which accounted for 85% of New York farms with either no or only 1 tractor with a ROPS.17 The 4 regions were widely dispersed. Also, although Herkimer County shares a border with St Lawrence County, the Adirondack State Park provides a substantial natural barrier. To prevent cross-contamination of study regions, we distributed messages as inserts in popular farm periodicals that were circulated only in the social marketing and messages and promotion regions.
We selected a sampling frame of 4766 small crop and livestock farms from National Agricultural Statistics Service databases. Small farms fell in the lowest quartile of annual sales for their respective commodity (crop or livestock). Farms with annual sales less than $1000 were excluded. Crop farmers produced oilseeds, grains, other crops, and hay. Livestock farms raised pigs, cattle, calves, sheep, goats, horses, poultry, fish, and other animals. We had to contact 1848 farms from our list of 4766 to identify 1284 with at least 1 non-ROPS tractor.
Surveys
We collected baseline and follow-up survey data from June 2006 to May 2007. The survey instruments measured outcome variables associated with the theory of planned behavior22 and the stages of change–transtheoretical model (TTM).23 We derived the planned behavior questions from a previously tested survey.24 Respondents were contacted by telephone to complete the baseline and follow-up surveys. We conducted the baseline survey 5 months before the intervention was launched and the follow-up survey at the end of the 6-month intervention period. Incentives in each of the 3 intervention regions were made available for the duration of the 6-month period. We assessed demographic data at both baseline and follow-up.
We designed the planned behavior questions to provide direct measures of opinions about retrofitting (attitudes), retrofitting attitudes of influential others (subjective norms), perceived ability to retrofit (perceived behavioral control), and intentions to retrofit (behavioral intention). We used the TTM questions to assign respondents to 1 of 7 levels of readiness to retrofit (precontemplation–knowledge, precontemplation motivation, early contemplation, late contemplation, decision–determination, action 1, and action 2).
Only respondents who completed a baseline survey were contacted for follow-up. The follow-up survey involved completing 1 of 3 versions of the original survey according to respondents' circumstances: the respondent had not retrofitted since baseline and still had at least 1 tractor lacking a ROPS, the respondent had retrofitted since baseline, or the respondent had no tractors to retrofit because unprotected tractors had been eliminated. The 4 TTM questions that assessed steps taken to retrofit (questions 4–7) were removed for respondents who had retrofitted or no longer had tractors to retrofit. The planned behavior questions in the follow-up survey were reworded accordingly. Respondents were also asked whether they had seen tractor retrofitting advertisements in the previous 6 months. To assess bias, we compared baseline data of the 391 respondents (farm owners who completed baseline and follow-up surveys) with data from the 352 dropouts (farm owners who completed the baseline survey only).
To measure attitudes, respondents were asked to respond to 5 statements. Each statement was prefaced with “Installing a roll-over protective structure on at least one of my unprotected tractors is …”
bad farm practice or good farm practice,
not cost-effective or very cost-effective,
inconvenient or convenient,
unnecessary or necessary, and
irresponsible or responsible.
Respondents rated each statement on a 10-point scale, with the highest number indicating favorable retrofitting attitudes. For example, a participant would be asked, “On a scale of one to ten, how would you rate the following statement, ‘Installing a roll-over protective structure on at least one of my unprotected tractors is … bad farm practice or good farm practice,’ one being very bad and 10 being very good.” Responses were averaged to provide an overall attitude score.
The subjective norms score was the averaged response to 3 statements about perceived pressure from significant others to retrofit. The 5 potential responses were scored from 1 to 5, with 1 indicating strongly disagree (1 point) and 5 indicating strongly agree (5 points).
Four statements regarding perceived behavioral control were similarly scored. The behavioral intention score was the average response to 3 questions about intention to retrofit. This score was then multiplied by a factor indicating when the individual intended to retrofit: next year (multiplied by 5), in 2 years (4), in 3 years (3), in 4 years (2), or in 5 to 10 years (1).
We derived a TTM level from responses to 7 questions:
TTM level 1—respondents felt ROPSs were unimportant and had not considered retrofitting (precontemplation–knowledge).
TTM level 2—respondents felt ROPSs were important but had not considered retrofitting (precontemplation–motivation).
TTM level 3—respondents had considered retrofitting but had not talked to a dealer (early contemplation).
TTM level 4—respondents had talked to a dealer but had not set a date to retrofit (late contemplation).
TTM level 5—respondents had set a date but had not yet retrofitted (decision–determination).
TTM level 6—respondents had retrofitted a tractor but still had 1 or more unprotected tractors (action 1).
TTM level 7—respondents had retrofitted a tractor and had ROPS protection on all tractors (action 2).
For analytic purposes, we combined levels 3 and 4 into a single category called contemplation.
Interventions
A financial incentive was available to all farms in study region 1 (rebate only) and study region 2 (the social marketing region). This incentive consisted of a 70% rebate of the entire cost to retrofit, with a maximum of $600. We publicized the rebate via advertisements in newspapers, newsletters, and popular farm magazines. We also distributed poster advertisements for display in showrooms of equipment dealers, veterinary offices, and cooperative extension offices. Toll-free hotline assistance in locating the appropriate ROPS kit and comparing pricing was available in the rebate-only region, the social marketing region, and region 3 (messages and promotion).
For the social marketing region and the messages and promotion region, we developed advertisements through social marketing research and distributed them as inserts in newspapers, newsletters, and popular farm magazines. The advertisements were also displayed on 8- by 10-foot banners on farms located in high-traffic areas, and we distributed them in poster form to veterinarians, cooperative extension offices, and tractor dealers. Farm equipment dealers in these 2 regions also received promotional items such as note pads and coffee mugs to encourage their promotion of the program. Figure 1 illustrates the 4 treatment groups.
FIGURE 1.
Incentives provided in each study region to encourage farmers to install rollover protective structures on unprotected tractors, New York and Pennsylvania, 2006–2007.
Note. ROPS = rollover protective structure.
We telephoned respondents who completed the baseline and follow-up questionnaires after 3 years to ask whether they had retrofitted a tractor. We compared these responses with the scores for the 5 behavioral variables measured in the postintervention survey.
RESULTS
The response rate for the baseline survey was 81.5% (1046/1284). Of these 1046, 214 respondents were from region 1 (the rebate-only region), 227 from region 2 (the social marketing region), 282 from region 3 (the messages and promotion region), and 323 from region 4 (the control region). We discarded 303 questionnaires because of interviewer errors. Of the 743 remaining respondents, 391 completed a follow-up survey (52.6%). Of these, 350 (89.5%) completed the 3-year retrofitting assessment survey. Eighteen of these 350 respondents (5.1%) reported retrofitting a tractor since the start of the intervention.
The average age of the 391 respondents who completed both baseline and follow-up surveys was 60 years. The average number of tractors per farm was 3. Respondents reported an average of 464 hours of tractor use annually for all farm tractors. The average age of the 352 study dropouts was 59 years. Among dropouts, the average hours of annual tractor usage for all tractors was 362, and the number of tractors was 3. Statistical comparisons between respondents and dropouts did not reveal significant differences in age (P = .3), number of tractors (P = .999), or total annual hours of tractor usage for all tractors (P = .14). Comparisons of preintervention TTM and planned behavior scores between respondents and dropouts also detected no significant differences.
The proportion who reported seeing advertisements differed significantly by region (P < .001). Among respondents in the rebate-only region, 25% reported seeing the ads; in the social marketing region, 39%; in the region that received only the messages and promotion, 21%; and in the control region, 10%. Although data were available for only 81 respondents, we noted a marked difference in the proportion who reported talking to a dealer between those who had seen advertisements (19.1%) and those who had not (8.3%).
The analysis of variance model for the change in TTM level showed a significant main effect between regions (P = .004) but no significant effect for having seen the advertisements or the interaction of advertisement exposure and region. Post hoc comparisons found the largest differences between the social marketing region and the messages and promotion region (+0.37 vs −0.12; P = .04) and between the social marketing region and the control region (+0.37 vs −0.12; P = .04).
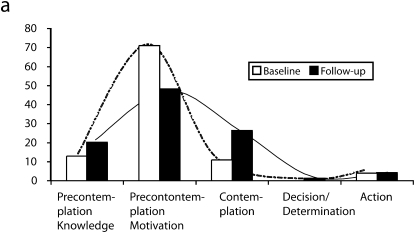
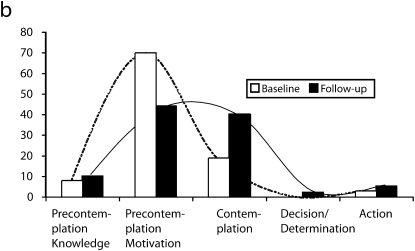
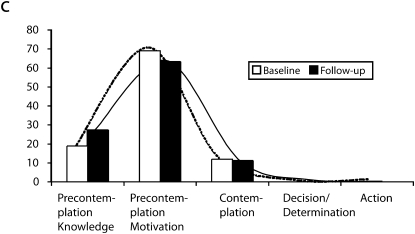
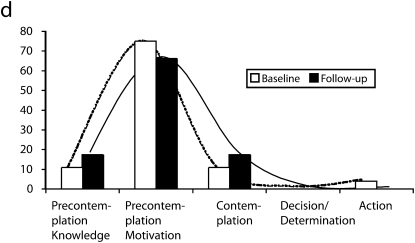
In addition to comparing mean changes, we compared the distribution of baseline and follow-up TTM scores (Figure 2). In the 2 regions that received rebate offers (the rebate-only and social marketing regions), we detected a general pattern of movement from precontemplation to contemplation. The most significant increase in follow-up TTM score occurred in the social marketing region, where we found a 21% increase in individuals in the contemplation phase.
FIGURE 2.
Changes in farmers' transtheoretical model distribution after exposure to incentives designed to encourage the installation of rollover protective structures on unprotected tractors in the (a) rebate only, (b) social marketing, (c) messages and promotion, and (d) control regions of the study: New York and Pennsylvania, 2006–2007.
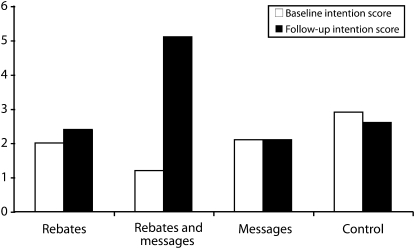
The most significant increase in the mean behavioral intention score occurred in the social marketing region, where the mean behavioral intention score after the intervention was roughly 4 times the baseline value. Figure 3 provides a comparison of baseline and follow-up intention scores for each region. We detected no significant increases in the rebate-only and messages and promotion regions. Mean intention scores in the control region decreased from baseline to follow-up. Analysis of variance comparisons of changes in baseline and follow-up scores for the 4 study regions indicated significant differences (P = .003), with the most pronounced differences occurring between the social marketing region and the messages and promotion region (4.3 vs 0.2; P = .009).
FIGURE 3.
Changes in farmers' intentions to install rollover protective structures after exposure to incentives in study regions, New York and Pennsylvania, 2006–2007.
The correlation of behavioral intention with attitudes (r = 0.16; P = .006), subjective norms (r = 0.42; P < .001), and perceived behavioral control (r = 0.2; P < .001) established that the subjective norms measure was the most highly correlated of the 3. When we used multiple regression modeling of these 3 variables to predict behavioral intention, only subjective norms and perceived behavioral control were independently predictive.
Comparisons of changes in subjective norms scores following the intervention found the most notable increase in the social marketing region (0.22), followed by the rebate-only region (0.09), the messages and promotion region (0.01), and the control region (−0.02). However, changes between baseline and follow-up subjective norm scores for each region were not statistically significant (P = .08).
As shown in Table 1, the postintervention levels of the 5 behavioral variables (TTM, intentions, attitudes, subjective norms, perceived behavioral control) were all higher for the retrofitters. Three of these 5 differences, TTM (P = .053), subjective norms (P = .005), and attitudes (P = .022), were significant. None of the pre- to postintervention changes in these 5 variables were significant between retrofitters and nonretrofitters.
TABLE 1.
Comparison of 5 Behavioral Measures in the Postintervention Condition Between Retrofitters and Nonretrofitters of Tractor Rollover Protective Structures: New York and Pennsylvania, 2006–2007
| Behavioral Measures | Retrofitters, Mean | Nonretrofitters, Mean | P |
| TTM level | 3.06 | 2.17 | .053 |
| Intention | 6.17 | 3.06 | .227 |
| Subjective norms | 3.02 | 2.48 | .005 |
| Behavioral control | 3.69 | 3.67 | .883 |
| Attitudes | 7.38 | 6.18 | .022 |
Note. TTM = transtheoretical model.
DISCUSSION
Social marketing incorporates incentives and marketing activities to convince individuals that the benefits of a recommended behavior exceed the costs.25 Successful marketing requires a clear understanding of the barriers to change and the development of strategies to address them. In the case of ROPS retrofitting, substantial barriers have been identified.18 Prominent among these blocks are the cost and complexity of retrofitting tractors. The impact of rebates was studied in New York, where farmers were offered varying percentages of the total cost to retrofit.12 That study noted that 20% of farmers wouldn't retrofit, even if the entire cost was rebated. The author concluded that retrofitting logistics provided a significant barrier to retrofitting beyond cost. Among the most substantial barriers to retrofitting is optimistic bias,26 wherein farmers consistently deny personal risk from a hazard they readily acknowledge.18
Although social marketing campaigns and various ROPS incentives have been proposed,6 no comprehensive assessment of these was previously conducted. We systematically assessed the effect of different combinations of retrofitting incentives and the role that social marketing might play in enhancing readiness to retrofit. The campaign elements in this trial consisted of financial incentives, an ROPS hotline, and a series of tested promotional messages. Although an assessment of the hotline's independent effect would have been valuable, this evaluation would have required offering it in only 1 region, making it impossible to collect valuable demographic and tractor information that could be used for future comparisons between the study regions.
Our results indicated that although rebates increased farmers’ readiness and intentions to retrofit, the combination of rebates with social marketing messages and promotion holds the most promise for increasing retrofitting activity. The most significant shift in baseline and follow-up TTM scores was found in the social marketing region, with a greater than 20% increase in the proportion considering retrofitting. By contrast, the rebate-only region saw an increase of roughly 15%. Social marketing messages without rebates did not appear to generate any significant changes. This finding may indicate that although messages address the perceptual barriers to retrofitting, cost is the most influential barrier.
We observed the largest increase in intention to retrofit in the social marketing region. The difference between this region and the rebate-only region was much larger for this endpoint than for TTM level. Although the rebate-only region showed some increase in intention scores, the postintervention score in the social marketing region was 4 times as high as the preintervention score.
Because all 5 behavioral measures assessed in the postintervention follow-up (TTM, behavioral intentions, attitudes, subjective norms, and perceived behavioral control) were higher among retrofitters, we can reasonably conclude that these are valid predictors of retrofitting behavior. That retrofitting was not shown to be related to pre- to postintervention changes in these 5 variables is also informative. These 2 results together imply that unless the intervention can move respondents to some threshold level, they are unlikely to retrofit. Thus, a relatively modest change of half a point in TTM may result in retrofitting for a respondent who starts at TTM level 3 or 4 (early contemplation or late contemplation). Conversely, a considerably larger change of 1.5 points in TTM level may do little to change behavior in a respondent who starts at level 1 (precontemplation–knowledge).
Another interesting finding was the role that social norms could play in encouraging retrofitting. In the analysis of correlations between behavioral precedents and intentions, increases in subjective norms were most highly correlated with increases in behavioral intention. Strong correlations between subjective norms and health behaviors have been noted in the public health literature27–29 and in agricultural health and safety research.30,31 These correlations have also been found for binge drinking among college students.32,33 A New York Times article that highlights several research studies, along with comments from university administrators, indicates that successful campaigns aimed at reducing college binge drinking emphasized that most students do not drink excessively.34 Some schools have reported a 20% drop in reported drinking in response to subjective norms marketing campaigns.
Comparisons of the proportion of individuals who remembered seeing advertisements in the different regions indicated that the combination of rebates and social marketing messages and promotion also increased message recall. A search of the public health literature did not identify studies comparing the effects of messages and incentives combined with the independent effects of these components. However, our study indicated that messages were more visible when they focused on making targeted behaviors more appealing as well as easier.
Limitations
A review of the errors that rendered 303 of the baseline surveys unusable indicated that 3 of the interviewers had not correctly completed the second half of a question tree. These errors appeared to be related to the surveyors’ abilities, not the participants’ characteristics.
The follow-up survey's 53% response rate may also have introduced bias and reduced the representativeness of our sample. However, a comparison of baseline survey measures between respondents who completed the follow-up and those who did not indicated that these 2 groups did not differ significantly.
Rebate funding was provided by the New York State legislature and was thus not available to Pennsylvania farmers. For this reason, we could not completely randomize interventions. However, farmers targeted in Pennsylvania had personal and farm demographics indistinguishable from those of their New York neighbors. Although outcomes may have been affected by regional differences as opposed to actual intervention exposures, our data did not indicate this. Because we made comparisons by calculating intraindividual differences in baseline and follow-up survey scores, a bias related to geography would have had to occur in relation to the intervention response, which appears unlikely.
Conclusions
Our results showed that a social marketing approach combining financial incentives, tailored messages, and promotion had the greatest influence on message recall, readiness to retrofit tractors, and intentions to retrofit tractors. This finding indicates that cost is not the only barrier farmers experience in retrofitting tractors and that building interest in tractor retrofitting will likely involve more than providing money. Our results also provide evidence that behavioral variables are valid predictors of tractor retrofitting behaviors and that subjective norms are particularly influential in a farmer's decision to retrofit.
Acknowledgments
This research was supported by the National Institute for Occupational Safety and Health (grant 5U50 0H007542-06). Research was conducted in partnership with faculty members from the Centre for Global Health at Umeå University, with support from FAS, the Swedish Council for Working Life and Social Research (grant 2006-1512).
The authors thank Steve Ropel and the other staff from the New York State office of the National Agricultural Statistics Service for assisting with this study. Their participation was invaluable and considerably appreciated.
Human Participant Protection
This study was approved by the Mary Imogene Bassett Hospital institutional review board. Verbal consent was obtained from all survey participants, and all study personnel were institutional review board certified.
References
- 1.Unintentional injuries at work by industry United States, 2005 [figure]. : Injury Facts. Itasca, IL: National Safety Council; 2007:48 [Google Scholar]
- 2.Bureau of Labor Statistics Number and rate of fatal occupational injuries by private industry sector, 2005 [figure]. Available at: http://www.bls.gov/iif/oshwc/cfoi/cfch0004.pdf. Accessed December 13, 2010
- 3.Murphy D. Pennsylvania farm and agricultural fatalities 2000–2004. Penn State Cooperative Extension Agric Saf Health New. 2006;18:1–2 [Google Scholar]
- 4.Goodman RA, Smith JD, Sikes RK, Rogers DL, Mickey JL. Fatalities associated with farm tractor injuries: an epidemiologic study. Public Health Rep. 1985;100(3):329–333 [PMC free article] [PubMed] [Google Scholar]
- 5.Karlson T, Noren J. Farm tractor fatalities: the failure of voluntary safety standards. Am J Public Health. 1979;69(2):146–149 [DOI] [PMC free article] [PubMed] [Google Scholar]
- 6.NIOSH Center Directors National Agricultural Tractor Safety Initiative. Swenson E, Seattle: University of Washington; 2004:3 [Google Scholar]
- 7.Myers JR, Snyder KA, Hard DL, et al. Statistics and epidemiology of tractor fatalities—a historical perspective. J Agric Saf Health. 1998;4(2):95–108 [Google Scholar]
- 8.Sanderson WT, Madsen MD, Rautiainen R, et al. Tractor overturn concerns in Iowa: perspectives from the Keokuk County Rural Health Study. J Agric Saf Health. 2006;12(1):71–81 [DOI] [PubMed] [Google Scholar]
- 9.Thelin A. Rollover fatalities—Nordic perspectives. J Agric Saf Health. 1998;4(3):157–160 [Google Scholar]
- 10.Springfeldt B. Rollover of tractors—international experiences. Saf Sci. 1996;24(2):95–110 [Google Scholar]
- 11.Day L, Rechnitzer G, Lough J. An Australian experience with tractor rollover protective structure rebate programs: process, impact and outcome evaluation. Accid Anal Prev. 2004;36(5):861–867 [DOI] [PubMed] [Google Scholar]
- 12.Hallman EM. ROPS retrofitting: measuring effectiveness of incentives and uncovering inherent barriers to success. J Agric Saf Health. 2005;11(1):75–84 [DOI] [PubMed] [Google Scholar]
- 13.Kelsey TW, Jenkins PL, May J. Factors influencing tractor owners’ potential demands for rollover protective structures. J Agric Saf Health. 1996;2(2):35–42 [Google Scholar]
- 14.National Agricultural Tractor Safety Initiative presentation, Keystone, CO, June 23, 2004. Available at: http://depts.washington.edu/pnash/files/KeystoneNotes/pdf. Accessed November 1, 2008.
- 15.Morgan SE, Cole HP, Struttman T, Piercy L. Stories or statistics? Farmers’ attitudes toward messages in an agricultural safety campaign. J Agric Saf Health. 2001;8(2):225–239 [DOI] [PubMed] [Google Scholar]
- 16.Sorensen JA, May J, Ostby-Malling R, et al. Encouraging the installation of rollover protective structures in New York State: the design of a social marketing intervention. Scand J Public Health. 2008;36(8):859–869 [DOI] [PubMed] [Google Scholar]
- 17.May JJ, Sorenson JA, Burdick PA, Earle-Richardson GB, Jenkins PL. Rollover protection on New York tractors and farmers’ readiness for change. J Agric Saf Health. 2006;12(3):199–213 [DOI] [PubMed] [Google Scholar]
- 18.Sorensen JA, May JJ, Paap K, Purschwitz MA, Emmelin M. Encouraging farmers to retrofit tractors: a qualitative analysis of risk perceptions amongst a group of high risk farmers in New York. J Agric Saf Health. 2008;14(1):105–117 [DOI] [PubMed] [Google Scholar]
- 19.National Institute for Occupational Safety and Health NIOSH protecting workers in agriculture. Insight Data Sheets. Available at: http://www.cdc.gov/niosh/programs/agff/insights/insightsagrops.pdf. Accessed January 11, 2011
- 20.Viebrock S, Earle-Richardson G, Sorensen JA, Westenbroek T, O'Hara P, May JJ. The New York State ROPS Retrofit Promotion Program utilizing a retrofit rebate and farmer's hotline—observations from a social marketing intervention. Paper presented at: National Institute for Farm Safety Conference; June 24–28, 2007; Penticton, British Columbia, Canada [Google Scholar]
- 21.Sorensen JA, McKenzie EA, Jr, Purschwitz M, Jenkins PL, O'Hara P, May JJ. Results from inspections of farmer-installed rollover protective structures. J Agromedicine. 2001;16(1):19–29 [DOI] [PubMed] [Google Scholar]
- 22.Ajzen I. The theory of planned behavior. Organ Behav Hum Decis Process. 1991;50(2):179–211 [Google Scholar]
- 23.Prochaska JO, DiClemente CC. Stages and processes of self-change of smoking: toward an integrative model of change. J Consult Clin Psychol. 1983;51(3):390–395 [DOI] [PubMed] [Google Scholar]
- 24.Francis JJ, Eccles MP, Johnston M, et al. Constructing Questionnaires Based on the Theory of Planned Behaviour: A Manual for Health Services Researchers. Newcastle Upon Tyne, UK: Centre for Health Services Research; 2004 [Google Scholar]
- 25.Andreasen AR. Marketing Social Change. San Francisco, CA: Jossey-Bass; 1995 [Google Scholar]
- 26.Weinstein ND. Why it won't happen to me: perceptions of risk factors and susceptibility. Health Psychol. 1984;3(5):431–457 [DOI] [PubMed] [Google Scholar]
- 27.Olds RS, Thombs DL. The relationship of adolescent perceptions of peer norms and parent involvement to cigarette and alcohol use. J Sch Health. 2001;71(6):223–228 [DOI] [PubMed] [Google Scholar]
- 28.Ahern J, Galea S, Hubbard A, Syme SL. Neighborhood smoking norms modify the relation between collective efficacy and smoking behavior. Drug Alcohol Depend. 2009;100(1–2):138–145 [DOI] [PMC free article] [PubMed] [Google Scholar]
- 29.Nolan JM, Schultz PW, Cialdini RB, Goldstein NJ, Griskevicius V. Normative social influence is underdetected. Pers Soc Psychol Bull. 2008;34(7):913–923 [DOI] [PubMed] [Google Scholar]
- 30.Pratt PD. Application of the Theory of Planned Behavior to Farm Kit Usage Among Farmers in Six Illinois Counties [master's thesis] Urbana: University of Illinois at Urbana–Champaign; 2001 [Google Scholar]
- 31.Colémont A, Van den Broucke S. Measuring determinants of occupational health related behavior in Flemish farmers: an application of the theory of planned behavior. J Safety Res. 2008;39(1):55–64 [DOI] [PubMed] [Google Scholar]
- 32.Broadwater K, Curtin L, Martz DM, Zrull MC. College student drinking: perception of the norm and behavioral intentions. Addict Behav. 2006;31(4):632–640 [DOI] [PubMed] [Google Scholar]
- 33.Meltzer H. Review of Social Norms and the Behavior of College Students. J Educ Psychol. 1942;33(3):236–238 [Google Scholar]
- 34.Zernike K. New tactic on college drinking: play it down. New York Times. October 3, 2000. Available at: http://www.nytimes.com/2000/10/03/us/new-tactic-on-college-drinking-play-it-down.html. Accessed September 26, 2008


