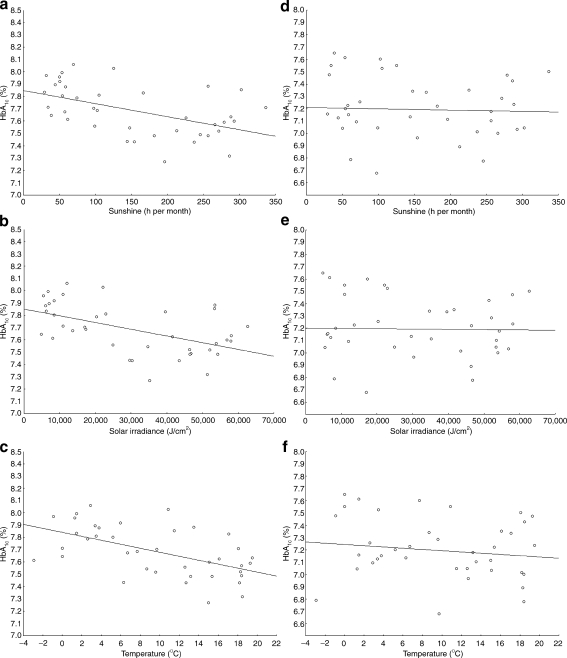
Fig. 3.
Correlation of meteorological data, i.e. (a, d) h of sunshine per month, (b, e) solar irradiance and (c, f) ambient temperature, with HbA1c levels in schoolchildren (a–c) and preschool children (d–f). a R = −0.52, p = 0.0007; (b) R = −0.52, p = 0.0006; (c) R = −0.56, p = 0.0002; (d) R = −0.10, p = 0.52; (e) R = −0.06, p = 0.69; (f) R = −0.18, p = 0.29

