Abstract
With the increasing prevalence of diabetes mellitus and metabolic syndrome worldwide, experimental models are required to better understand the pathophysiology and therapeutic approaches to preserve pancreatic beta cells, attenuate atherosclerosis and protect target organs. The aims of this study were to develop an experimental model of impaired glucose tolerance combined with hypercholesterolaemia induced by diet and assess metabolic alterations and target organ lesions. New Zealand male rabbits were fed high-fat/high-sucrose (10/40%) and cholesterol-enriched diet for 24 weeks, when they were sacrificed. Biochemistry, fundus photographs with fluorescein angiography and pathological analyses were performed. Cholesterol-fed and normal animals of same age were compared. Results: The animals with diet-induced impaired glucose tolerance combined with hypercholesterolaemia gained weight, increased blood glucose, total cholesterol, LDL-C and triglycerides and decreased HDL-C (P<0.05 vs. baseline). Fructosamine levels and the homeostasis model assessment of insulin resistance (HOMA-IR) index were increased, while there was a reduction in the HOMA-β (P<0.05 for all vs. baseline). Histomorphologic findings of this model were aortic atherosclerosis, hepatic steatofibrosis and glomerular macrophage infiltration. Early clinical features of diabetic retinopathy with hyperfluorescent dots consistent with presence of retina microaneurysms were seen since week 12, progressing up to the end of the experiment (P<0.0005 vs. baseline and 12 weeks). Our model reproduced several metabolic characteristics of human diabetes mellitus and promoted early signs of retinopathy. This non-expensive model is suitable for studying mechanistic pathways and allowing novel strategic approaches.
Keywords: animal models, diet, impaired glucose tolerance, insulin resistance, retinopathy
Type 2 diabetes mellitus is a complex disorder with a worldwide prevalence estimated to be in the range of 1–5%, with greatest impact in developing nations (King et al. 1998). According to the latest report from the National Health and Nutrition Examination Survey (NHANES), type 2 diabetes has a 12.9% prevalence among individuals aged 20 years or more, and over 40% of the adult population may present any hyperglycemic disorder (prediabetes plus diabetes) (Cowie et al. 2009). Micro- and macrovascular complications account for the disease-related morbidity and mortality of type 2 diabetes (Stirban & Tschoepe 2008), and diabetic retinopathy has been reported as the most common cause of blindness in adults (King et al. 1998).
In experimental animals, diabetes occurs either spontaneously or by chemical, surgical, genetic or combined techniques, and these models share many clinical characteristics of the human disease (Srinivasan & Ramarao 2007; Chatzigeorgiou et al. 2009). However, there are limitations to the use of such models in research, including animal availability, costs, long periods of induction, heterogeneity in the degree of glucose disturbances and high mortality rates. Chemically induced diabetes obtained using alloxan or streptozotocin promotes irreversible toxic effects on beta cells, with insulin deficiency. However, the increment in blood glucose may not be uniform (Rees & Alcolado 2005; Lenzen 2008; Szkudelski 2001). Non-rodent animal models (swine and non-human primates) have been used to depict spontaneous type 2 diabetes, but they are expensive and require sophisticated animal facilities (Wagner et al. 2006).
Models of diet-induced impaired glucose tolerance or type 2 diabetes in rodents are scarce in the literature. Yin et al. (2002) induced hyperglycaemia in rabbits by adding sucrose 37% and lard 10% to the standard laboratory chow and showed mild hyperglycaemia, hyperinsulinaemia and dyslipidaemia, increased lipid peroxidation, decreased NO/NOS levels and aortic atherosclerosis. However, involvement of other target organs was not assessed.
Most of what is known about diabetes complications in rabbits derives from models of alloxan-induced diabetes. Oxidative stress and non-enzymatic glycosylation are considered major factors contributing to the extent of chronic complications of diabetes in the kidneys, liver and pancreas (Szkudelski 2001; Griesmacher et al. 1995; Bulut et al. 2001; Sochor et al. 1979; Mir & Darzi 2009). Retinopathy seems to be a consequence of glucose toxicity and increased oxidative stress. Early cellular and molecular changes in the retinal vasculature have been related to glucose-associated mechanisms of toxicity, alterations in vascular permeability and capillary obliteration (Kvanta 2006).
The United Kingdom Prospective Diabetes Study (UKPDS) has shown that LDL-cholesterol, followed by HDL-cholesterol, is the main risk factor for cardiovascular events (Turner et al. 1998). To assess initial complications of hyperglycaemia, we modified the protocol of Yin et al. (2002) by adding cholesterol to the diet given chronically to rabbits. To obtain a more comprehensive model, we evaluated these animals 24 weeks after diet-induced hyperglycaemia/hypercholesterolaemia for early functional and/or morphologic alterations in the kidneys, pancreas, liver, aortas and, particularly, to examine retinopathy.
Materials and methods
Animals
Twelve male New Zealand white rabbits aged 3 months and weighing 2200–2300 g were housed individually. All animals received proper care in compliance with the guidelines of the Brazilian College of Experimental Animals, and the study protocol was approved by the local Ethics Committee (Federal University of Sao Paulo, UNIFESP, SP, Brazil). The animals were individually housed and provided with light/dark cycle and water ad libitum. The cages were cleaned, and the chow and water were changed daily. All animals were weighted at the beginning of the study and thereafter at 12 and 24 weeks. Before sacrifice, the animals were anesthetized with xylazine (5 mg/kg, Rompun®, BayerAG, São Paulo, SP, Brazil) and ketamine (35 mg/kg, Vetaset®, Fordodge, São Paulo, SP, Brazil).
Diet
After an adaptation period of 15 days, the animals initiated the study protocol. To the standard chow (Purina, Canoas, RS, Brazil), we added lard 10% (Sadia, Concordia, SC, Brazil), sucrose 40% (União, Piedade, RJ, Brazil) and cholesterol (0.5% during the first 12 weeks, and 0.1% thereafter) (Sigma-Aldrich, San Diego, CA, USA). These components were hydrated, mixed and dried (60 °C). One hundred grams of the mixture was offered to the animals daily for 24 weeks. We ran parallel experiments with rabbits receiving 0.5% cholesterol-enriched diet (n = 10) and control animals fed standard laboratory chow (n = 9).
Blood lipids and biochemical parameters
After a 12-h fast, blood samples were collected from the central ear artery of the animals at baseline, 12 and 24 weeks and were assayed in the Central Laboratory of UNIFESP. Samples were stored at −80 °C, defrosted at room temperature for 2 h prior analysis.
Clinical chemistry was assayed by automated techniques in the Olympus AU 640 system (Olympus, Nagano, Japan). Serum lipids were determined by enzymatic colorimetric methods using the appropriate reagents (Olympus) for total cholesterol (TC), HDL-cholesterol (HDL-C) and triglycerides (TG). The level of low-density lipoprotein cholesterol (LDL-C) was calculated by the Friedewald equation. Determination of fructosamine levels was chosen to evaluate the blood overall glucose levels for the duration of the protocol and was assayed by kinetic method, while serum albumin was performed by colorimetric technique.
Blood glucose was measured by a calibrated glucometer (OneTouch® Ultra®, LifeScan Inc., Johnson & Johnson, Sao Jose dos Campos SP, Brazil), using test strips from the same supplier. Inter-assay coefficient for glucose was <5%. Insulin was assayed by chemiluminescence in the IMMULITE Analyzer with L2KIN2 reagents (Diagnostic Products Corporation, Siemens, CA, USA).
Homeostasis model assessment for insulin resistance (HOMA-IR) and beta cells (HOMA-β) was calculated by the following equations: [basal insulin (in mU/l) × (glucose (in mg/dl)/18)]/22.5 and [20 × basal insulin (in mU/l)]/[(glucose (in mg/dl)/18) − 3.5], respectively. To assess the first phase of insulin secretion, a bolus of hypertonic glucose (50%, Ariston, SP, Brazil) (1 g/kg) was infused intraperitoneally in anesthetized animals before sacrifice. Intracardiac samples for glucose and insulin measurements were collected before, 2, 5, 10 and 15 min after glucose infusion. The areas under the curves (AUC) for glucose and insulin were determined.
Urinalysis
At sacrifice, cystocentesis was performed for the assessment of albumin and creatinine, with estimates of the albumin/creatinine ratio in isolated urine sample (mg/g of protein). Urinary nitrites were assayed by dry chemistry using Multistix reagent strips, which allow semiquantitative measures (Siemens Healthcare Diagnostics).
Fundus photographs and fluorescein angiography
Fundus photographs and fluorescein angiography were performed at baseline, 12 and 24 weeks for detection of retinopathy. The procedures were performed under intramuscular anaesthesia using xylazine (5 mg/kg, Rompun®, BayerAG) and ketamine (35 mg/kg, Vetaset®, Fordodge). Pupils were dilated prior to the procedure by instillation of 1% tropicamide and 5% phenylephrine hydrochloride (Bausch & Lomb Pharmaceuticals Inc., Rochester, NY, USA) in the conjunctival sac. The angiographic technique for contrast examination consisted of an intravenous injection of sodium fluorescein (10%, 0.1 ml; Ophthalmos, São Paulo, SP, Brazil) into the marginal ear vein. Fundus photographs were obtained with a fundus camera (TRC 50X; Topcon Inc., Tokyo, Japan). After the injection, the animal was positioned and the camera unit was aligned with the eye. Photographs were taken at intervals between 10 and 15 s and, sequentially, each 10 s up to 1 min and also after 5 min of the injection to analyse the late phase.
Rabbit retina exhibits limited intraretinal vasculature and is very different from that of a human retina. The side-branching type of retinal vessels seen in rabbits differs from the vasculature of the human eye and those of most mammals, in which it is known to occur dichotomously (Antonetti et al. 2006). Therefore, we determined the prevalence of microaneurysms based on standard photographs, with radius equivalent to the diameter of the average optic disc (1500 μ), considering the area within 1500 μ diameter of the border of the optic disc. The number of microaneurysms was categorized into 4 levels with I < 10, II 11–30, III 31–50, IV >50 microaneurysms, respectively. All analyses were performed in a blinded fashion.
Histopathology and immunohistochemistry
Specimens of the aortas were excised from the ascending part of the arch to the iliac bifurcation. The aortas were cut longitudinally, fixed in 10% buffered formalin (pH = 7.4) (Labsynth, Diadema, SP, Brazil), and the 1-[4-(Phenylazo) Phenilazo]-2-Naphthol (Sudan red III) dye (Science Lab, Houston, TX, USA) was used to identify the lipid-enriched areas. The extension of the aortas covered by plaques was estimated by computerized planimetry, using the Image Tool® software 3.0 version (University of Texas Health Science Center in San Antonio, UTHSCSA, TX, USA).
Fragments from the arch, thoracic and abdominal aortas were processed for histology with hematoxylin and eosin (Nuclear, Allkimia, Campinas, SP, Brazil) stains. Sections of these specimens (4-mm diameter) stained with the elastic fibre Verhoeff (Nuclear, Allkimia) stain were used for the determination of the intimal plaque (I) and media (M) areas. The I/M ratio was assessed using the Image Tool® 3.0 version software. Anti-rabbit monoclonal antibodies were used to determine macrophages (RAM- 11, DAKO Corp., Carpinteria, CA, USA) and α-smooth muscle actin (HHF-35, DAKO Corp.). The avidin–biotin immunoperoxidase (C-004, DAKO Corp.) procedure was used, and the sections were counterstained with Harris hematoxylin (Nuclear, Allkimia). For quantification of macrophages and smooth muscle cells in the intima layer, the maximal lesion observed in the histological section was analysed. Images of two atherosclerotic plaque sections (magnification: 400×) including the most stained areas were captured, digitalized and processed by the Corel Photo-paint software (Corel Corporation, Mountain View, CA, USA). The positive stained areas were determined by the morphometric Image Tool 3.0 software. Results were expressed as immunostained and fractional areas of the intima layer.
Sections from the kidney, liver, pancreas and eyes were obtained for histopathology, using the hematoxylin and eosin stains. Picrosirius stain was used for the aorta, liver and kidney specimens. Periodic acid-Schiff (PAS, Nuclear, Alkimia) was used to stain the basement membrane in the kidney, and the number of macrophages (stained by RAM-11) was counted in 10 glomeruli. In the liver, the degree of steatosis, balloonization, fibrosis and inflammation were evaluated semiquantitatively. In the pancreas, insulin goat polyclonal IgG antibodies (Santa Cruz Biotechnology, Inc., Santa Cruz, CA, USA) were used. To assess the total area occupied by beta cells, three transversal sections from each animal and 25 islets randomly selected were used. The total area of beta cells was estimated in sections stained by insulin using the equation: area of beta cells (in μm2) = Σ islet areas (in μm2). The islet area and the number of cells per islet were determined, and the staining density was analysed automatically by the Image J software (Image Processing and Analysis in Java, downloaded from http://rsbweb.nih.gov/ij/features.html). In this software, the sum of the values of pixels in the selection is calibrated to be equivalent to the plots of areas of mean grey values. The eyes were excised, fixed in buffered formalin (pH = 7.4) for histopathological analysis (hematoxylin and eosin stains and periodic acid-Schiff), and immunohistochemistry for perlecan antibodies was used to evaluate early signs of retinopathy.
Statistical analysis
All results are expressed as means (SE). Differences between time points were compared by means of the paired Student’s t-test or anova repeated measures, using Tukey’s multiple comparisons. For pathology results, descriptive analyses were used. The level of statistical significance was set at P<0.05.
Results
Body weight and general appearance of the animals
The diet was well tolerated and the animals gained weight as observed at weeks 12 and 24 (P<0.0005 vs. baseline) (Table 1) and showed signs of visceral obesity with fat infiltration in abdominal organs. Weight gain was similar in control animals and in cholesterol-fed rabbits during experimental protocol.
Table 1.
Distribution of body weight, lipid profile and glucose levels during study protocol
| Diet-induced diabetes and hypercholesterolaemia (n = 12) | Controls (n = 9) | Cholesterol-fed animals (n = 10) | |||||||||
|---|---|---|---|---|---|---|---|---|---|---|---|
| Variables | Baseline | 12 weeks | 24 weeks | P (wg) | Baseline | 12 weeks | 24 weeks | Baseline | 12 weeks | P (wg) | P (bg) |
| Body weight (g) | 2600 (44) | 3473 (71) | 3652 (131) | <0.0001* | 2713 (78) | 3500 (127) | 3750 (120) | 2662 (163) | 3159 (112) | 0.002** | NS |
| TC (mmol/l) | 1.11 (0.10) | 23.73 (3.67) | 11.45 (2.52) | <0.0001† | 0.81(0.08) | 0.89 (0.11) | 1.14 (0.10) | 1.12 (0.10) | 31.89 (4.86) | <0.0001** | NS |
| HDL-C (mmol/l) | 0.81 (0.06) | 0.99 (0.14) | 0.43 (0.05) | <0.0001‡ | – | – | – | 0.83 (0.10) | 0.88 (0.10) | 0.111 | NS |
| LDL-C (mmol/l) | 0.05 (0.04) | 22.28 (3.56) | 10.58 (2.45) | <0.0001† | – | – | – | 0.05 (0.05) | 30.36 (4.73) | <0.0001** | NS |
| TG (mmol/l) | 0.55 (0.03) | 1.00 (0.13) | 0.95 (0.16) | 0.017* | – | – | – | 0.52 (0.04) | 1.45 (0.39) | 0.044 | NS |
| Glucose (mmol/l) | 5.79 (0.26) | 6.66 (0.25) | 16.07 (2.14) | <0.0001§ | 4.44 (0.33) | 4.89 (0.26) | 5.57 (0.29) | 4.89 (0.27) | 5.22 (0.23) | NS | NS |
Values are means (SE). TC, total cholesterol; TG, Triglycerides; wg, within-group comparisons: P<0.05, anova-Tukey.
Baseline <12 and 24 weeks.
12 weeks > baseline and 24 weeks, 24 weeks > baseline.
24 weeks <baseline and 12 weeks.
24 weeks > baseline and 12 weeks; bg: between-group comparisons: P<0.05, Student’s t-test.
12 weeks > baseline.
Lipids and biochemistry
Laboratory findings are presented in Tables 1 and 2. For diet-induced hyperglycaemia/hypercholesterolaemia, TC and LDL-C were markedly increased at week 12 (P<0.0005), with a decrease at week 24 (P<0.0005), because of reduction in cholesterol content of the diet from week 12 on. At week 24, decrease in HDL-C (P<0.0005 vs. baseline) and increase in triglycerides (P <0.05) were observed. Blood glucose levels showed elevation only at week 24 (P<0.0005), whereas insulin levels did not change over time. Increase in the HOMA-IR and decrease in HOMA-β indexes (P<0.005, for both) were observed, when compared with baseline. Fructosamine was shown to be increased at week 12 and further at week 24 (P<0.0005). Control animals did not change lipids or glucose over time, whereas cholesterol-fed rabbits presented, as expected, higher TC and LDL-C at week 12, without significant modification in blood glucose (Table 1).
Table 2.
Distribution of metabolic variables during study protocol
| Diet-induced diabetes and hypercholesterolaemia (n = 12) | ||||
|---|---|---|---|---|
| Variables | Baseline | 12 weeks | 24 weeks | P (wg) |
| Insulin (pmol/l) | 19.24 (4.17) | 11.95 (0.76) | 13.26 (6.11) | 0.112 |
| Fructosamine (mmol/l)* | 0.287 (0.025) | 0.412 (0.012) | 0.540 (0.039) | <0.0001 |
| Serum albumin (g/l)** | 44.8 (0.7) | 46.7 (0.9) | 37.9 (6.9) | <0.0001 |
| HOMA-IR† | 0.66 (0.20) | 0.50 (0.02) | 1.39 (0.20) | 0.001 |
| HOMA-ↆ | 49.8 (14.6) | 12.2 (1.3) | 4.0 (0.6) | 0.002 |
| Urine albumin (g/l) | – | – | 0.278 (0.007) | NA |
| Urine creatinine (μmol/l) | – | – | 18,564 (2652) | NA |
| Albumin/creatinine (mg/mmol) | – | – | 14.97 (2.75) | NA |
| Urinary nitrites | – | – | Negative | NA |
Values are means (SE). HOMA-IR, homeostasis model assessment insulin resistance; HOMA-β, homeostasis model assessment beta cells; NA, not applicable. Within-group comparisons: P<0.05, anova-Tukey.
24 weeks > baseline and 12 weeks, 12 weeks > baseline.
*24 weeks < baseline and 12 weeks.
24 weeks > baseline and 12 weeks.
24 weeks < baseline and 12 weeks; 12 weeks < baseline.
The liver enzymes and serum creatinine levels were not affected by induction of hyperglycaemia/hypercholesterolaemia (data not shown).
Serum albumin was shown to be lower at week 24 (P<0.005), the albumin/creatinine ratio was <30 mg/g of protein and in addition, presence of nitrites was not detected (Table 2).
Interestingly, in this model, not only glucose levels were enhanced but also insulin secretion was impaired, after challenge with glucose (1 g/kg) intraperitoneal injection, as shown by plots of glucose and insulin (Figure 1) at week 24 (descriptive data only). GlucoseAUC (mg/dl/min) and insulinAUC (mU/l/min) after intraperitoneal infusion of glucose (1 g/kg) in hyperglycemic/hypercholesterolemic rabbits at sacrifice are shown. Glucose mean values (SE) were 203 (64), 264 (10), 258 (11), 391 (131) and 419 (107) mg/dl for fasting, 2, 5, 10 and 15 min, respectively. Glucoseauc (SE) after glucose infusion was 105,9 (38,3) mg/dl/min. Insulin mean values (SE) were 1.4 (0.3), 1.1 (0.8), 1.1 (0.4), 1.2 (0.3) and 1.1 (0.2) mU/l for fasting, 2, 5, 10 and 15 min, respectively. InsulinAUC (SE) after glucose infusion was 3.1 (0.4) U/l/min.
Figure 1.
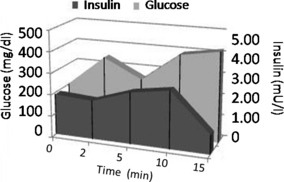
Plots of glucose (mg/dl) and insulin (mU/l) after intraperitoneal infusion of a bolus of hypertonic glucose (50%, 1 g/kg of body weight) in diabetic rabbits at sacrifice. Mean values for glucose (mg/dl) are in the left axis, whereas insulin values (mU/l) are in the right axis. Areas under the curves (AUC) are presented for glucose (light grey) and insulin (dark grey). Mean values (SE) for glucose are 203 (64), 264 (10), 258 (11), 391 (131) and 419 (107) mg/dl for fasting, and 2, 5, 10 and 15 min, respectively. GlucoseAUC = 105,930 (38,297) mg/dl/min. Mean values for insulin (SE) are 1.4 (0.3), 1.1 (0.8), 1.1 (0.4), 1.2 (0.3) and 1.1 (0.2) mU/l for fasting, and 2, 5, 10 and 15 min, respectively. InsulinAUC = 3.1 (0.4) U/l/min.
Detection of retinopathy
Study of hyperglycemic/hypercholesterolemic animals revealed early clinical features of diabetic retinopathy including hyperfluorescent dots consistent with microaneurysms. Figure 2 represents fundus photography (a) and fluorescein angiographies (b–e) of rabbit retinas 12 and 24 weeks after induction of hyperglycaemia/hypercholesterolaemia by diet with details (arrows) of microaneurysms. The mean number of hyperfluorescent dots (SE) at baseline was 9.8 (1.0) and classified as level 1.4 (0.2). After 12 weeks of diet-induced hyperglycaemia/hypercholesterolaemia, increased number of microaneurysms [32.6 (1.8); P<0.0001] and higher level [2.6 (0.2); P=0.012] were observed. The number of microaneurysms showed progression [51.0 (1.4); P<0.0001] and a trend to higher level [3.4 (0.2); P=0.093] at week 24 (Figure 3). Figure 4 shows that 12-week cholesterol-fed animals (a) and 24-week rabbits fed laboratory chow (b) and did not present significant number of microaneurysms over time.
Figure 2.
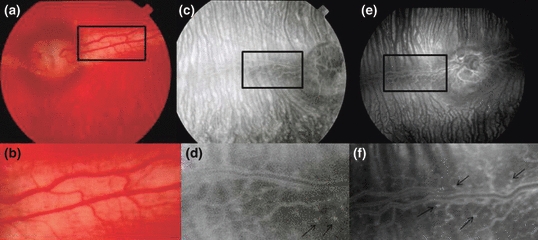
Fundus photography (a and b) and fluorescein angiographies (c–f) representative of retinas from rabbits with diet-induced diabetes at 12 (c and d) or 24 weeks (e and f), showing hyperfluorescent dots consistent with microaneurysms. Magnification of microaneurysms is shown in (d) and (f) (arrows).
Figure 3.
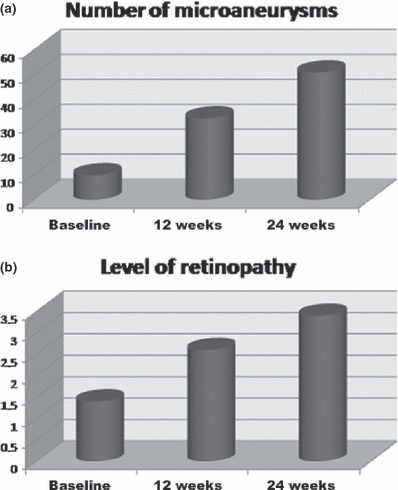
Means plots showing number of microaneurysms (a) and the level of retinopathy (b) in diabetic animals at baseline, 12 and 24 weeks. P<0.0001, anova repeated measures; 24 weeks > 12 weeks and baseline; 12 weeks > baseline.
Figure 4.
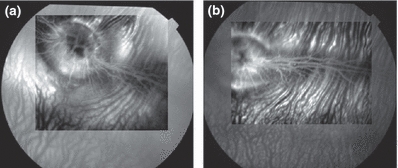
Fluorescein angiographies of a 12-week cholesterol-fed rabbit (a) and a 24-week control rabbit (b) exhibiting few microaneurysms.
Histopathology and immunohistochemistry
In our model of diet-induced hyperglycaemia combined with hypercholesterolaemia, the classic atherosclerosis, characterized by presence of plaque (SE) in 33.0 (7.7) % of the aorta, increased intimal area and I/M ratio, with highest values in the arch, was observed. The total I/M ratio was 0.7 (0.1). The percentage value of intimal area occupied by macrophages was 41.3 (6.8), and the percentage value of smooth muscle cells was 10.0 (2.0) (Table 3). In cholesterol-fed animals, the mean (SE) percentage of aortas occupied by plaque was 64.3 (8.8) % and the I/M ratio was 0.73 (0.09) (Figure 5).
Table 3.
Assessment of atherosclerotic parameters in the aorta after diet-induced hyperglycaemia plus hypercholesterolaemia in rabbits at week 24 and in hypercholesterolemic animals
| Variables | Hyperglycaemia/hypercholesterolaemia | Hypercholesterolaemia |
|---|---|---|
| Total intima area (mm2) | 1160 (50) | 1351 (92) |
| Plaque area (mm2) | 340 (90) | 924 (156) |
| Plaque (%) | 33.0 (7.7) | 64.3 (8.8) |
| I/M total | 0.70 (0.10) | 0.73 (0.09) |
| Integrated density of collagen | 156 × 106 (10 × 106) | NA |
| Macrophage (%) | 41.3 (6.8) | 36.9 (9.1) |
| SMC (%) | 10.0 (2.0) | NA |
I/M, intima media ratio; NA, not available; SMC, smooth muscle cells. Integrated density of collagen is the sum of the values for pixels in the selection, equivalent to the plots of areas of mean grey values, obtained with the Image J software.
Figure 5.
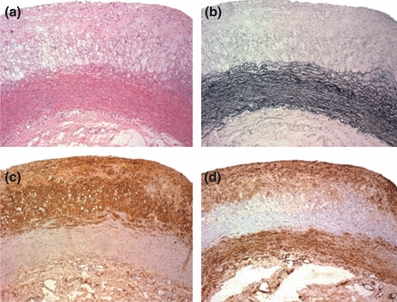
Photomicrographs of aortas from rabbits with diet-induced hyperglycaemia and hypercholesterolaemia. HE (a) and Verhoeff stain (b), Immunohistochemistry for macrophage (c) and for smooth muscle actin (d) (×100).
In our model of hyperglycaemia/hypercholesterolaemia, the liver showed areas with normal parenchyma, among areas showing balloonization (in 91% of the animals), steatosis (73%), mononuclear inflammatory foci (18%), collagen substitution and fibrosis (91%) (Figure 6).
Figure 6.
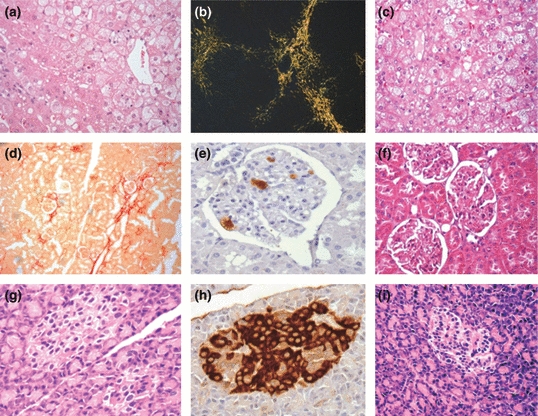
Photomicrographs of the liver (a–c), kidney (d–f) and pancreas (g–i) from rabbits with diet-induced hyperglycaemia and hypercholesterolaemia (a, b, d, e, g, h) or in cholesterol-enriched diet (c, e, f). Ballonization and steatosis in liver stained with HE (a, e) (×400) and fibrosis in picrosirius stain under polarized light (b) (×100). Kidney stained with picrosirius showing focal fibrosis (c) (×100), macrophages in glomerulus (d) (×400) and stained with HE (f) (×400). Pancreas showing preserved islet (g, i) (HE ×400) and immunohistochemistry with insulin antibody (h) (×400).
In the kidneys, we observed glomerular architecture preservation, mild thickening of the basement membrane, interstitial focal fibrosis and infiltration of macrophages. The number of macrophages counted per glomerulus (SE) was 13.0 (3.0) (Figure 6).
The pancreas architecture was relatively preserved, with mean islet area (SE) of 9001 (730) μm2 and a percentage number of beta cells stained with insulin of 87.9 (3.3) % cells (Figure 6).
Cholesterol-fed animals presented the same abnormalities in liver, pancreas and kidney (Figure 5 and 6).
Ocular histopathology with hematoxylin and eosin did not show significant alterations (data not shown). Immunohistochemistry with perlecan showed mild basement membrane thickening (Figure 7).
Figure 7.
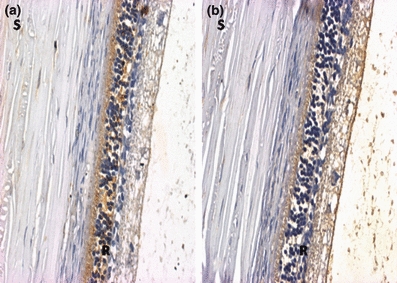
Representative photomicrographs of retina of normal (a) and hyperglycaemia/hypercholesterolaemia (b) rabbits. Immunohistochemistry with perlecan antibody (20×). S = sclera; R = retina.
Discussion
Documentation of diet-induced impaired glucose tolerance plus hyperlipidaemia in rabbits with characteristics of human disease was the major contribution of our study. Indeed, not only glucometabolic alterations but also target organ lesions were observed in the 24-week period of induction of impaired glucose tolerance and hyperlipidaemia. Worthy of note, we reproduced the early findings of diabetic retinopathy, thus reinforcing the usefulness of this simple and non-expensive model.
Our group developed a model of hyperglycaemia and atherogenic dyslipidaemia, characterized by low HDL-C and mild increase in TG levels associated with hypercholesterolaemia, induced by a diet enriched in lard (10%), sucrose (40%) and cholesterol. The animals consumed an average of 100 g/day of this diet, which was well tolerated, and the animals had weight gain throughout the study protocol, and this weight gain was similar in controls and in cholesterol-fed animals. Dyslipidaemia appeared early and it was consistent with diabetic dyslipidaemia at week 24. However, hyperglycaemia only appeared at week 24. In the rabbit model with alloxan-induced diabetes, laboratory diagnosis is based on blood glucose ≥250 mg/dl (≥13.9 mmol/l) (Vogel & Apstein 1988). There is no certainty criterion for diagnosing type 2 diabetes in rabbits; however, Yin et al., considered the animals “mildly diabetic” when plasma levels of glucose were >160 mg/dl (>8.9 mmol/l). In humans, type 2 diabetes is currently diagnosed on basis of fasting blood glucose levels ≥126 mg/dl (≥7.0 mmol/l) or when glycated haemoglobin is >6.5%; impaired glucose tolerance is considered when fasting blood glucose levels are between 100 and 125 mg/dl (5.56–7.0 mmol/l) or when glycated haemoglobin is between 5.7% and 6.4% (ADA 2010).
In our model, progressive increase in fructosamine and HOMA-IR index and decrease in HOMA-β were observed. These aspects are very interesting, as some authors (Song et al. 2007; Abdul-Ghani et al. 2006) argue that in type 2 diabetes both phenomena, insulin resistance and insufficient insulin secretion, are present simultaneously at the onset of hyperglycaemia. Thus, when fasting hyperglycaemia is present, even with mild degree of glucose intolerance, initial signs of β-cell dysfunction are observed. On the other hand, when fasting glucose is normal, glucose intolerance seems related to insulin resistance (Davies et al. 2000). At sacrifice, the early phase of insulin secretion, triggered by intra peritoneal glucose administration, was not modified while glucose levels increased further, thus showing a combined model of insulin resistance and deficient secretion, occurring simultaneously. We observed decrease in albumin serum levels in parallel with hepatic dysfunction. In fact, liver pathology showed moderate to severe alterations: steatosis, inflammation and fibrosis. Diabetic hepatosclerosis, as it has been termed, is a recently described form of microangiopathy in humans (Hudacko et al. 2009). In the kidney, inflammation with increased macrophage infiltration was observed, with mild fibrosis and basement membrane thickening. Lewko and Stepinski (2009) described that podocytes covering the outer surface of glomerular basement membrane are subjected to the filtered glucose load and other mechanical forces that lead to inflammation, necrosis and apoptosis of these cells. This seems to be the earliest feature of diabetic nephropathy. Parenchyma architecture was shown to be preserved in the pancreas, where the areas stained with insulin showing β-cells and H&E were comparable. We did not quantify the total mass of pancreatic islets because the organ was covered by large amounts of fat tissue, which also reinforces the visceral adiposity pattern in this model. Indeed, fat infiltration was observed in all abdominal organs.
In the retina, general aspects were normal. Ijubimov et al. (1996) proposed that thickening of the diabetic basement membranes appears to involve qualitative changes in specific basement membrane markers at advanced disease stage, when diabetic retinopathy is present. We reproduced early signs of diabetic retinopathy and showed only mild basement membrane thickening; therefore, those advanced alterations could not be found in our model.
Alloxan-induced type 1 diabetes model is the only description of diabetes complications in rabbits. Mir & Darzi (2009) reported long-term effects of alloxan at 26 weeks and showed inflammatory lesions in many target organs. Glucotoxicity and increased oxidative stress were the mechanisms proposed to explain these abnormalities. Reports of type 2 diabetes in rabbits are scarce (Yin et al. 2002) and are focused mainly on glucose levels and aortic atherosclerosis. In our model of diet-induced hyperglycaemia, we hypothesized that diabetic complications in target organs could appear earlier with addition of cholesterol to the diet. However, some of these complications could be attributed to increased cholesterol. We tested for possible age-related effects and also the addition of cholesterol to the diet (Silva et al. 2002; Relvas et al. 2010) to verify whether microaneurysms could be related to these factors. Significant number of microaneurysms was not found (Figure 4a,b).
It has been known for years that some types of astrocytes are located around or between the vitreous blood vessels that run on the inner surface of the medullated nerve fibres of the rabbit retina. These anatomical structures are referred to as glial tufts and are located between the blood vessels and the inner limiting membrane of the rabbit retina, appearing as early hyperfluorescent dots in the fluorescein angiography (Haddad et al. 2003). It could explain the hyperfluorescent dots observed in the retina of normal rabbits, at baseline. After the induction of diabetes, the increases in these dots were consistent with diabetic microangiopathy: the microaneurysms. However, the rabbit retinal vessels display individual variation in the tortuousness and structure of the network, and the connection of the deep capillaries to the main vessels, as well as other differences, that might be a limitation in the study of the rabbit retina (Antonetti et al. 2006).
Interestingly, significant number of microaneurysms was developed even before hyperglycaemia onset, thus supporting the observations that microvascular complications appear in the prediabetes state and hyperglycaemia is a late phenomenon (Hanley et al. 2009). In addition, we showed some heterogeneity between the stages of organ lesions in response to diet-induced hyperglycaemia; some organs are more preserved than others and/or need longer periods of induction to show more advanced abnormalities.
The diet was very well tolerated, and all the animals survived the study protocol and did not show infectious disease. In the alloxan model, besides producing type 1 diabetes, there is a high mortality rate because of acute pancreatic insufficiency (Srinivasan and Ramarao, 2007; Pomaro et al. 2005). Other models of type 2 diabetes are either transgenic or require larger animals such as primates and swine, which are expensive and need sophisticated animal facilities. Models of diabetic retinopathy in the alloxan-diabetic or galactose-fed rodents (Kern & Engerman 1995, 1996) have been extensively studied. Although Yin et al. (2002) induced type 2 diabetes in rabbits, and Xi et al. (2004) in minipigs using a similar high-sucrose/high-fat diet, none of them assessed diabetic retinopathy. Roy et al. (1994) proposed that basement membrane thickening in diabetes results from enhanced synthesis of specialized component molecules sustained by hyperglycaemia. Barber et al. (2001) described that diabetes progressively impairs the constitutive retinal insulin receptor signalling pathway through Akt (serine/threonine protein kinase) and suggested that loss of this survival pathway may contribute to the initial stages of diabetic retinopathy, which is reversed by insulin. We were able to non-invasively detect early signs of diabetic microvascular complications, and this finding may contribute to clinical and experimental research in diabetes. More advanced lesions may be obtained with longer periods of exposure to this diet.
Summarizing, our model reproduced several metabolic characteristics of human diabetes and promoted target organ lesions, mainly diabetic retinopathy. This non-expensive model can be suitable for studying mechanistic pathways and novel strategic approaches to refrain diabetes complications.
Acknowledgments
The authors acknowledge Dr Paulo Boschcov, former professor at Federal University of Sao Paulo, whose suggestions contributed to improve the quality of the final version of the manuscript. This study was financially supported by a research grant from FAPESP (The State of São Paulo Research Foundation). Dr. Helfenstein was a recipient of a grant from CAPES (National Counsel of Technological and Scientific Development).
Conflict of interest
The authors have no conflict to disclose.
Institutional approval
This research was conducted in accordance with the guidelines of the Brazilian College of Experimental Animals, and the study protocol was approved by the Ethics Committee of the Federal University of Sao Paulo, UNIFESP, SP, Brazil.
References
- Abdul-Ghani MA, Jenkinson CP, Richardson DK, Tripathy D, DeFronzo RA. Insulin secretion and action in subjects with impaired fasting glucose and impaired glucose tolerance: results from the Veterans Administration Genetic Epidemiology Study. Diabetes. 2006;55:1430–1435. doi: 10.2337/db05-1200. [DOI] [PubMed] [Google Scholar]
- American Diabetes Association. Standards of medical care in diabetes-2010. Diabetes Care. 2010;33:S11–S61. doi: 10.2337/dc10-S011. [DOI] [PMC free article] [PubMed] [Google Scholar]
- Antonetti DA, Barber AJ, Bronson SK, et al. Diabetic retinopathy: seeing beyond glucose-induced microvascular disease. Diabetes. 2006;55:2401–2411. doi: 10.2337/db05-1635. [DOI] [PubMed] [Google Scholar]
- Barber AJ, Nakamura M, Wolpert EB, et al. Insulin rescues retinal neurons from apoptosis by a phosphatidylinositol 3-kinase/Akt-mediated mechanism that reduces the activation of caspase-3. J. Biol. Chem. 2001;276:32814–32821. doi: 10.1074/jbc.M104738200. [DOI] [PubMed] [Google Scholar]
- Bulut HE, Onarlioglu B, Kaloglu C, Ozdemir O, Ayan S. Effects of experimental diabetes and insulin treatment on rabbit renal morphology: a quantitative and qualitative study. Turk. J. Med. Sci. 2001;31:209–216. [Google Scholar]
- Chatzigeorgiou A, Halapas A, Kalafatakis K, Kamper E. The use of animal models in the study of diabetes mellitus. In Vivo. 2009;23:245–258. [PubMed] [Google Scholar]
- Cowie CC, Rust KF, Ford ES, et al. Full accounting of diabetes and pre-diabetes in the U.S. population in 1988–1994 and 2005–2006. Diabetes Care. 2009;32:287–294. doi: 10.2337/dc08-1296. [DOI] [PMC free article] [PubMed] [Google Scholar]
- Davies MJ, Raymond NT, Day JL, Hales CN, Burden AC. Impaired glucose tolerance and fasting hyperglycaemia have different characteristics. Diabet. Med. 2000;17:433–440. doi: 10.1046/j.1464-5491.2000.00246.x. [DOI] [PubMed] [Google Scholar]
- Griesmacher A, Kindhauser M, Andert SE, et al. Enhanced serum levels of thiobarbituric-acid-reactive substances in diabetes mellitus. Am. J. Med. 1995;98:469–475. doi: 10.1016/s0002-9343(99)80347-7. [DOI] [PubMed] [Google Scholar]
- Haddad A, Salazar JJ, Laicine EM, Ramírez AI, Ramírez JM, Triviño A. A direct contact between astrocyte and vitreous body is possible in the rabbit eye due to discontinuities in the basement membrane of the retinal inner limiting membrane. Braz. J. Med. Biol. Res. 2003;36:207–211. doi: 10.1590/s0100-879x2003000200007. [DOI] [PubMed] [Google Scholar]
- Hanley AJ, Wagenknecht LE, Norris JM, et al. Insulin resistance, beta cell dysfunction and visceral adiposity as predictors of incident diabetes: the Insulin Resistance Atherosclerosis Study (IRAS) Family study. Diabetologia. 2009;52:2079–2086. doi: 10.1007/s00125-009-1464-y. [DOI] [PMC free article] [PubMed] [Google Scholar]
- Hudacko RM, Sciancalepore JP, Fyfe BS. Diabetic microangiopathy in the liver: an autopsy study of incidence and association with other diabetic complications. Am. J. Clin. Pathol. 2009;132:494–499. doi: 10.1309/AJCPQBFF42ZZXXRQ. [DOI] [PubMed] [Google Scholar]
- Ijubimov AV, Burgeson RE, Butkowski RJ, et al. Basement membrane abnormalities in human eyes with diabetic retinopathy. J. Histochem. Cytochem. 1996;44:1469–1479. doi: 10.1177/44.12.8985139. [DOI] [PubMed] [Google Scholar]
- Kern TS, Engerman RL. Galactose-induced retinal microangiopathy in rats. Invest. Ophthalmol. Vis. Sci. 1995;36:490–496. [PubMed] [Google Scholar]
- Kern TS, Engerman RL. A mouse model of diabetic retinopathy. Arch. Ophthalmol. 1996;114:986–990. doi: 10.1001/archopht.1996.01100140194013. [DOI] [PubMed] [Google Scholar]
- King H, Aubert RE, Herman WH. Global burden of diabetes, 1995–2025: prevalence, numerical estimates, and projections. Diabetes Care. 1998;21:1414–1431. doi: 10.2337/diacare.21.9.1414. [DOI] [PubMed] [Google Scholar]
- Kvanta A. Ocular angiogenesis: the role of growth factors. Acta Ophthalmol. Scand. 2006;84:282–288. doi: 10.1111/j.1600-0420.2006.00659.x. [DOI] [PubMed] [Google Scholar]
- Lenzen S. The mechanisms of alloxan- and streptozotocin-induced diabetes. Diabetologia. 2008;51:216–226. doi: 10.1007/s00125-007-0886-7. [DOI] [PubMed] [Google Scholar]
- Lewko B, Stepinski J. Hyperglycemia and mechanical stress: targeting the renal podocyte. J. Cell. Physiol. 2009;221:288–295. doi: 10.1002/jcp.21856. [DOI] [PubMed] [Google Scholar]
- Mir SH, Darzi MM. Histopathological abnormalities of prolonged alloxan-induced diabetes mellitus in rabbits. Int. J. Exp. Pathol. 2009;90:66–73. doi: 10.1111/j.1365-2613.2008.00615.x. [DOI] [PMC free article] [PubMed] [Google Scholar]
- Pomaro DR, Ihara SS, Pinto LE, et al. High glucose levels abolish antiatherosclerotic benefits of ACE inhibition in alloxan-induced diabetes in rabbits. J. Cardiovasc. Pharmacol. 2005;45:295–300. doi: 10.1097/01.fjc.0000155384.64350.45. [DOI] [PubMed] [Google Scholar]
- Rees DA, Alcolado JC. Animal models of diabetes mellitus. Diabet. Med. 2005;22:359–370. doi: 10.1111/j.1464-5491.2005.01499.x. [DOI] [PubMed] [Google Scholar]
- Relvas WG, Izar MC, Segreto HR, et al. Resident peritoneal inflammatory cells are pivotal in the development of experimental atherosclerosis. J. Atheroscler. Thromb. 2010;17:378–385. doi: 10.5551/jat.3418. [DOI] [PubMed] [Google Scholar]
- Roy S, Maiello M, Lorenzi M. Increased expression of basement membrane collagen in human diabetic retinopathy. J. Clin. Invest. 1994;93:438–442. doi: 10.1172/JCI116979. [DOI] [PMC free article] [PubMed] [Google Scholar]
- Silva EP, Fonseca FA, Ihara SS, et al. Early benefits of pravastatin to experimentally induced atherosclerosis. J. Cardiovasc. Pharmacol. 2002;39:389–395. doi: 10.1097/00005344-200203000-00010. [DOI] [PubMed] [Google Scholar]
- Sochor M, Baquer NZ, McLean P. Glucose overutilization in diabetes: evidence from studies on the changes in hexokinase, the pentose phosphate pathway and glucuronate-xylulose pathway in rat kidney cortex in diabetes. Biochem. Biophys. Res. Commun. 1979;86:32–39. doi: 10.1016/0006-291x(79)90378-4. [DOI] [PubMed] [Google Scholar]
- Song Y, Manson JE, Tinker L, et al. Insulin sensitivity and insulin secretion determined by homeostasis model assessment and risk of diabetes in a multiethnic cohort of women: the Women’s Health Initiative Observational Study. Diabetes Care. 2007;30:1747–1752. doi: 10.2337/dc07-0358. [DOI] [PMC free article] [PubMed] [Google Scholar]
- Srinivasan K, Ramarao P. Animal models in type 2 diabetes research: an overview. Indian J. Med. Res. 2007;125:451–472. [PubMed] [Google Scholar]
- Stirban AO, Tschoepe D. Cardiovascular complications in diabetes: targets and interventions. Diabetes Care. 2008;31:S215–S221. doi: 10.2337/dc08-s257. [DOI] [PubMed] [Google Scholar]
- Szkudelski T. The mechanism of alloxan and streptozotocin action in β cells of the rat pancreas. Physiol. Res. 2001;50:537–546. [PubMed] [Google Scholar]
- Turner RC, Millns H, Neil HA, et al. Risk factors for coronary artery disease in non-insulin dependent diabetes mellitus: United Kingdom Prospective Diabetes Study (UKPDS: 23) BMJ. 1998;316:823–828. doi: 10.1136/bmj.316.7134.823. [DOI] [PMC free article] [PubMed] [Google Scholar]
- Vogel WM, Apstein CS. Effects of alloxan-induced diabetes on ischemia-reperfusion injury in rabbit hearts. Circ. Res. 1988;62:975–982. doi: 10.1161/01.res.62.5.975. [DOI] [PubMed] [Google Scholar]
- Wagner JE, Kavanagh K, Ward GM, Auerbach BJ, Harwood HJ, Jr, Kaplan JR. Old world nonhuman primate models of type 2 diabetes mellitus. ILAR J. 2006;47:259–271. doi: 10.1093/ilar.47.3.259. [DOI] [PubMed] [Google Scholar]
- Xi S, Yin W, Wang Z, et al. A minipig model of high-fat/high-sucrose diet-induced diabetes and atherosclerosis. Int. J. Exp. Pathol. 2004;85:223–231. doi: 10.1111/j.0959-9673.2004.00394.x. [DOI] [PMC free article] [PubMed] [Google Scholar]
- Yin W, Yuan Z, Wang Z, Yang B, Yang Y. A diet high in saturated fat and sucrose alters glucoregulation and induces aortic fatty streaks in New Zealand white rabbits. Int. J. Exp. Diabetes Res. 2002;3:179–184. doi: 10.1080/15604280214274. [DOI] [PMC free article] [PubMed] [Google Scholar]


