

Abstract
Background
Protease-activated receptors (PARs), a family member of G-protein coupled receptors, are present and functionally active in a wide variety of cells. The object of this study was to demonstrate the presence and function of PAR-1 and PAR-2 in the dorsal motor nucleus of the vagus (DMV).
Methods
DMNV neurons were isolated from neonatal rat brainstems using micro-dissection and enzymatic digestion. Neurons were cultured in Neurobasal medium A containing 2% B27 supplement. Intracellular calcium concentration ([Ca2 + ]i) was measured using fura-2 based microspectrometry. Expression of PARs was detected by RT-PCR and immunofluorescent staining.
Key Result
Thrombin and PAR-1 agonist peptide activate PAR-1 with a maximum change in [Ca2 + ]i expressed as ΔF/F0 of 229 ± 14% and 137 ± 7%, respectively. Trypsin and PAR-2 agonist peptide activate PAR-2 with a maximum ΔF/F0 change of 258 ± 12% and 242 ± 10%, respectively. Inhibition of phospholipase C (PLC) by U73312 (1 μm) decreased the maximal change in ΔF/F0 induced by PAR-1 activation from 140 ± 17% to 21 ± 3%, while the PAR-2-mediated maximal change in ΔF/F0 decreased from 185 ± 21% to 19 ± 6%. Blockade of IP3 receptor with 2APB inhibited the maximal change in ΔF/F0 due to PAR-1 and PAR-2 activation by 72 ± 13% and 71 ± 20% respectively. PAR-1 immnuoreactivity was present in DMV neurons. Increase in transcripts for PAR-1 and PAR-2 were detected in DMV tissues derived from IBD rats relative to control animals.
Conclusions & Inferences
Our results indicate that PAR-1 and PAR-2 are present in the DMV neurons, and their activation leads to increases in intracellular calcium via signal transduction mechanism that involves activation of PLC and the production of IP3.
Keywords: inflammatory bowel disease; inositol 1,4,5-trisphosphate; intracellular calcium signalling; phospholipase C; protease-activated receptors; the dorsal motor nucleus of the vagus
INTRODUCTION
Inflammatory bowel diseases (IBD), including ulcerative colitis and Crohn’s disease, are major public health problems in the United States. Although gastrointestinal dysfunction complicates the management of IBD, relatively little is known of the underlying mechanisms. Disruption in the structure and function of the intrinsic enteric nervous system has been described.1 Extrinsic nerves, mainly from the dorsal motor nucleus of the vagus (DMV), provide innervation to the gastrointestinal tract and control almost every aspect of the gastrointestinal functions. Little is known of the role of the extrinsic nervous system in the development of gastrointestinal dysfunction associated with the IBD.
The dorsal vagal complex consists of three components: DMV, the nucleus of the solitary tract (NST) and area postrema (AP). Area postrema borders the fourth ventricle and senses chemical changes in the blood and cerebrospinal fluid. The nucleus of the solitary tract receives gastrointestinal stimuli through primary vagal afferents. Dorsal motor nucleus of the vagus integrates both peripheral and central signals from several different sources including from the AP and afferent neurons of the visceral organs, either directly or via interneurons in NST.2 Dorsal motor nucleus of the vagus neurons provide parasympathetic efferents to the gastrointestinal system to influence gastrointestinal activities such as swallowing, gut responses to distension and acidity, absorption of nutrient composition and gallbladder contraction.3,4
Synthesis of inflammatory mediators occurs in the enteric nervous system and in immune cells of the gut-associated lymphoid tissue. These inflammatory mediators, including cytokines, thrombin and trypsin, are potentially important in the development of IBD-induced gastrointestinal dysfunction. Protease-activated receptors (PARs) are members of a G-protein-coupled family of receptors. Protease-activated receptors have been related to cellular responses to injury and inflammation.5 Protease-activated receptors are activated through a unique mechanism that involves proteolytic cleavage of the extracellular N-terminal domain, exposing a new N-terminus that acts as a tethered ligand, binding and activating the receptor itself. Four different PARs have been cloned. Protease-activated receptor 1 and PAR-3 are activated by thrombin, while PAR-2 is activated by trypsin and mast cell tryptase, and PAR-4 is activated by both trypsin and thrombin.6–9 Protease-activatedreceptorsarepresentina variety of tissues and cell types, including the CNS and the enteric nervous system.10–12 Whether PARs are present in the DMV is currently unknown.
Previous studies have shown that the DMV may respond to systemic endotoxin,13 suggesting that the DMV may possess the characteristics of a circumventricular organ with a highly permeable blood–brain barrier.14–16 Furthermore, the permeability of the blood-brain barrier has been reported to be increased by TNBS-induced colitis in both rats and rabbits.17,18 Our previous studies demonstrated the structural and functional alterations of DMV neurons in response to pro-inflammatory cytokines in the setting of intestinal inflammation.19 In this study, we investigate the presence of PAR-1 and PAR-2 in DMV neurons, and to elucidate the cellular mechanisms that are triggered upon PAR activation. We report here that PAR-1 and PAR-2 are expressed and are functionally active in cultured DMV neurons of the rat. The current study demonstrates the existence of receptor-specific signal transduction mechanisms that involve activation of phospholipase C (PLC) and inositol 1,4,5-trisphosphate (IP3) following PAR occupation in DMV neurons.
MATERIALS AND METHODS
Chemicals and solutions
Neurobasal medium A, phosphate buffer solution (PBS), B27 supplement, L-glutamine, penicillin and streptomycin were purchased from Gibco (Grand Island, NY, USA). β fibroblast growth factor (βFGF) was from Invitrogen (Carlsbad, CA, USA). Poly-D-lysine, Triton X-100, thrombin, collagenase type V and 2,4,6-trinitrobenzene sulphonic acid (TNBS) were purchased from Sigma-Aldrich (St. Louis, MO, USA). Trypsin was purchased from Worthington Biochemicals (Lakewood, NJ, USA). U-73343 and U-73122 were from RBI (Natick, MA, USA). Fura-2 acetoxymethyl ester and fura-2 free acid were purchased from Molecular Probes (Eugene, OR, USA). Protease-activated receptor peptides (PARP-1 and PARP-2) were purchased from Peptides International (Louisville, KY, USA).
DMV cell culture
Dorsal motor nucleus of the vagus neurons were isolated from 2 to 5 days old Sprague–Dawley rats as previously described.20 Neonatal rats were euthanized by decapitation. The brainstem was rapidly removed and chilled at 0 °C in a dissection solution containing: NaCl 138 mmol L−1, KCl 4 mmol L−1, MgCl2 1 mmol L−1, CaCl2 2 mmol L−1, glucose 20 mmol L−1, HEPES 10 mmol L−1. Tissue blocks were prepared and sectioned transversely into 400 μm slices at the level of the obex using a Vibratome 3000 (Redding, CA, USA). The DMVarea was identified under a dissecting microscope as the area immediately ventral to the nuclei of the solitary tract and dorsal to the XII nuclei. Dorsal motor nucleus of the vagus tissue was excised and then digested in an enzyme solution containing protease type XIV (0.6 mg mL−1) and trypsin type I (0.4 mg mL−1) at 32 °C for 30–60 min. The tissue was then dissociated by gentle trituration with pipettes. Cells were plated onto poly-D-lysine coated 25 mm slides in 35 mm culture dishes. Neurons were maintained at 37 °C in an atmosphere of 5% CO2 in serum-free culture media containing Neurobasal medium A containing 2% B27 supplement, 2 mmol L−1 glutamine, 1% penicillin and streptomycin, and 5 ng mL−1 βFGF. After 4 days, one-half of the medium was replaced and experiments were conducted at 7 days. NTS neurons which typically are smaller and demonstrate a smaller membrane capacity in whole cell patch clamping were excluded. This protocol used to isolate and culture DMV neurons from neonatal rats was approved by the University of Michigan Committee on Use and Care of Animals.
[Ca2+]i measurement
Four μmol mL−1 of the fura-2-AM was added to cultured DMV neurons in fresh warm serum-free growth media and incubated at 37 °C for 30 min prior to experimentation. Cells were washed and maintained in HBSS. Coverslips were then placed in a perfusion chamber mounted on the stage of a Nikon inverted fluorescence microscope (Mager Scientific Inc., Dexter, MI, USA). The rate of superfusion of buffer and reagents was kept constant at 1 mL min−1. For Ca2+-free conditions, HBSS without CaCl2 was used.
A Nikon inverted microscope with a × 40 oil immersion objective and TILLvision digital imaging system (TILL Photonics, Pleasanton, CA, USA) were used. Single-cell cytoplasmic calcium ([Ca2+]i) was determined from the ratio of fluorescence intensity of fura-2-AM at 340 and 380 nm, monitored by an intensified charge-couple device camera, and subsequently digitized. Background intensity at each emission wavelength was corrected. The ratio of fluorescence intensities at 340 and 380 nm was plotted as the change in fluorescence (ΔF/F0), expressed as a percentage of the basal fluorescence ratio observed in the absence of stimulus. Cells were considered responsive if maximal ΔF/F0 increment was equal to or greater than 15% above the baseline for each experimental condition. Coverslips were superfused with KCl (55 mmol L−1) at the end of each experiment, and cells were excluded if intracellular Ca2+ did not increase.
RT-PCR
Total RNA was isolated from rat DMV tissues. Single-strand cDNA synthesis was performed as follows: 30 μL of reverse transcription mixture contained 1 μg of DNase I pre-treated total RNA, 0.75 μg of oligo d(T) primer, 6 μL of 5x RT buffer, 10 mmol L−1 dithiothreitol, 0.5 mmol L−1 deoxynucleotides, 50 units of RNase inhibitor, and 240 units of reverse transcriptase (Invitrogen). The RT reaction was carried out at 40 °C for 70 min followed by heat inactivation at 95 °C for 3 min. PCR primers were deduced from published rat sequences. PCR was performed in a total 25 μL volume, containing 2.5 μL cDNA, 5 mmol L−1 MgCl2, 0.2 mmol L−1 dNTPs, 0.25 μmol L−1 each primer, 1.25 U Ampli Taq Polymerase (Roche Diagnostics, Indianapolis, IN, USA). The PCR program was: hold 95 °C for 5 min; 95 °C for 15 s, 60 °C for 30 s, and 72 °C for 1 min. Melt curve analysis was from 60 °C to 95 °C at 0.2 °C/second with Optics Ch1 On. PCR products were also visualized by 1.5% agarose gel electrophoresis. The PCR bands were isolated from the gel, sequenced, and confirmed with known sequences. mRNA expression was quantified using the comparative cross threshold (CT) method. The CT value of the housekeeping gene glyceraldehyde 3-phosphate dehydrogenase (GAPDH) was subtracted from the CT value of the target gene to obtain ΔCT. The normalized fold changes of PARs mRNA expression were expressed as 2-ΔΔCT, where ΔΔCT equals to ΔCT sample–ΔCT control.
The primers used for PCR were as follows:
Induction of IBD
Animal studies were approved by the University of Michigan Committee on the Use and Care of Animals. Adult male Sprague–Dawley rats (Harlan, Indianapolis, IN, USA) weighing 200–220 g were kept in individual cages with 12 h light/dark cycles and were given food and water ad libitum. Intestinal inflammation was induced by 0.5 mL enemas of TNBS solution at a dose of 30 mg in 50% ethanol. Control animals were given 0.5 mL enemas of 50% ethanol. Animals were killed humanely 1 week after enemas. Colonic weight and length were measured as indicators of colitis. Macroscopic assessment of the colitis severity was scored as follows: 0, no ulcer and no inflammation; 1, local hyperaemia without ulceration; 2, ulceration without hyperaemia; 3, ulceration and inflammation at one site only; 4, two or more sites of ulceration and inflammation; and 5, ulceration extending more than 2 cm. Histological changes were graded as follows: 0, no sign of inflammation; 1, very low level of leucocyte infiltration; 2, low level of leucocyte infiltration; 3, high level of leucocyte infiltration, high vascular density, and thickening of the colon wall; and 4, transmural infiltration, loss of goblet cells, high vascular density, and thickening of the colon wall.
The brainstem was removed and the medulla oblongata containing the DMV was sectioned into 400-μm slices at the interaural level of −4.24 mm to −5.08 mm, according to the atlas of Paxinos and Watson using a cryostat (Leica CM 1850; Leica Microsystems, Wetzlar, Germany). Dorsal motor nucleus of the vagus nuclei were then harvested as described before and total RNA was extracted using Trizon (Invitrogen).
Immunofluorescent staining
Dorsal motor nucleus of the vagus neurons grown on glass coverslips were fixed with 4% paraformaldehyde for 30 min at 4 °C, and then permeabilized with 0.1% saponin in phosphate-buffered saline for 20 min at room temperature (22 °C). To block non-specific binding, cultures were treated with 10% serum for 30 min at room temperature. Fixed neuronal cells were incubated with antibodies against PAR-1 and the neuronal marker Hu for 1 h at room temperature, followed by incubation with Alexa Fluor 594 and FITC conjugated secondary antibodies for 60 min at room temperature. Control staining used IgG.
Data analysis
Results are expressed as mean ± SEM. Data were analysed using ANOVA and Student’s t-test as appropriate. Significance was accepted as P < 0.05.
Techniques for primary cell culture and maintenance, media, and reagent vendors remained constant throughout all experiments. To exclude any potential contamination by glia cells, coverslips were superfused with 55 mmol L−1 KCl at the end of each experiment, and cells were excluded if maximal ΔF/F0 increment was less than 15%. In this study, n represents the number of neurons examined. At least four coverslips were used for each experimental condition.
RESULTS
Activation of PAR-1 and PAR-2 increases [Ca2+]i in DMV neurons
We have previously described primary culture of DMV neuronal cells.20 DMV cultures were found to be composed primarily of neurons with less than one per cent contamination with glial cells. Less than one percent of cultured cells were fibroblasts as assessed by Thy-1 immunostaining. Using in vitro primary DMV neuronal cell culture, the effects of PAR-1 and PAR-2 activation on the intracellular calcium levels in DMV neuronal cells were examined. To determine working concentrations, dose–response curves were generated using both the physiological agonist (thrombin or trypsin) and the corresponding specific synthetic peptide (PARP-1 or PARP-2), and the increase in [Ca2+]i was quantified with respect to basal levels by measuring the maximal change in ΔF/F0 (F0 is defined by the average of fluorescent intensity at the basal level, whereas ΔF equals to F1–F0. The results were normalized to 100% of basal line and expressed as percentage change). All these experiments were conducted in cultured DMV neurons only exposed to single dose of individual agonist. Data were analysed with ANOVA with Bonferroni post tests comparing each dose to the 10−9 M dose. Statistically significant difference was denoted as P < 0.05.
Thrombin in a range from 1 nmol L−1 to 1 μmol L−1 produced dose-dependent increments in maximal ΔF/F0 (Fig. 1A). Intracellular calcium concentration increased rapidly after exposure to thrombin, with calcium levels returning gradually to baseline upon withdrawal of agonist. A maximum increment in ΔF/F0 of 229 ± 14% was elicited in DMV neuronal cells by 1 μmol L−1 of thrombin, with a maximum of 89 ± 3% of cells responding (Fig. 1A). Exposure of cultured DMV cells to PARP-1 also caused dose-dependent increases in [Ca2+]i over a concentration range from 1 nmol L−1 to 1 μmol L−1 (Fig. 1B). PARP-1 (1 μmol L−1) caused increases in ΔF/F0 of 137 ± 7%, with a maximum of 87 ± 2% of cells responding.
Figure 1.

Effect of protease-activated receptors (PARs) activation on [Ca2+]i i in dorsal motor nucleus of the vagus (DMV) neurons. (A) Effect of increasing concentrations of thrombin on the Δ[Ca2+]i and percentage of cells responding to the treatment. (B) Effect of increasing concentrations of PARP-1 on the Δ[Ca2+]i and percentage of cells responding to the treatment. (C) Effect of increasing concentrations of trypsin on the Δ[Ca2+]I and percentage of cells responding to the treatment. (D) Effect of increasing concentrations of PARP2 on the Δ[Ca2+]i and percentage of cells responding to the treatment. Values are mean ± SEM.
Treatment of DMV neurons with trypsin caused an increase in [Ca2+]i, with a maximum ΔF/F0 of 258 ± 12% at 1 μmol L−1 concentration (Fig. 1C). At 1 μmol L−1 of trypsin, 86 ± 2% of cells responded with increases in [Ca2+]i. Similar to trypsin, PARP-2 (1 μmol L−1) resulted in a maximum ΔF/F0 of 242 ± 10% with 83% ± 2% of cultured DMV neuronal cells demonstrating [Ca2+]i increments (Fig. 1D).
Based on dose–response studies, concentrations of agonists that exerted a submaximal ΔF/F0 were chosen for subsequent experiments. The concentrations of thrombin and PARP-1 used were 100 nmol L−1 and 100 nmol L−1 respectively. To study PAR-2 activation, trypsin and PARP-2 concentrations of 100 nmol L−1 were used.
To characterize responsiveness after trypsin and thrombin exposure, cultured DMV neuronal cells were repeatedly exposed to these agonists. As shown in Fig. 2A, repetitive exposure to thrombin produced a significant decrement in peak ΔF/F0 responses (n = 69). Peak ΔF/F0 for the two exposures was 148 ± 17% and 90 ± 10% respectively. Similar inhibition in peak ΔF/F0 responses was also observed when cells were exposed to repetitive perfusion of trypsin (Fig. 2B). Peak ΔF/F0 for the two exposures was 173 ± 21% and 76 ± 9% respectively.
Figure 2.
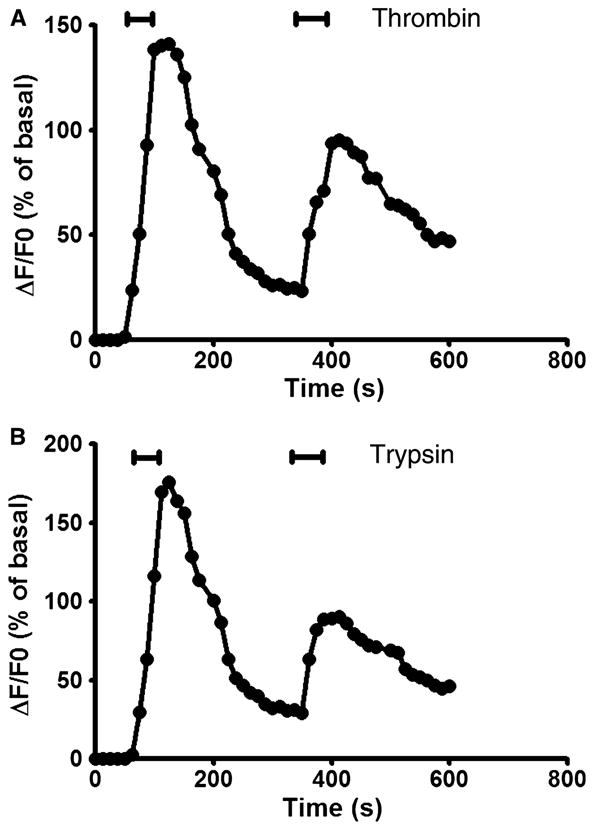
Receptor desensitization caused by initial activation with thrombin (100 nmol L−1) (A) or trypsin (100 nmol L−1) (B), and subsequent exposure to thrombin (100 nmol L−1) or trypsin (100 nmol L−1) respectively.
In the control experiment, subsequent exposure to thapsigargin (1 μmol L−1) applied at the same intervals as used in the second application of thrombin induced an elevation in the intracellular calcium concentration of an amplitude similar to those elicited by the single exposure to thapsigargin (peak ΔF/F0 was 181 ± 15% vs 190 ± 20% respectively, P > 0.05).
Mechanism on PARs-induced [Ca2+]i signalling
The next series of experiments sought to determine the sources of calcium and signalling pathways responsible for the increase in intracellular calcium concentration upon activation of PAR-1 and PAR-2. We firstly determined whether extracellular stores of Ca2+are involved in the [Ca2+]i transients. Dorsal motor nucleus of the vagus cells were perfused with thrombin or trypsin in a Ca2+-free buffer. As shown in Fig. 3A,B, both thrombin and trypsin increased intracellular calcium levels in absence of extracellular calcium, consistent with release from internal stores.
Figure 3.
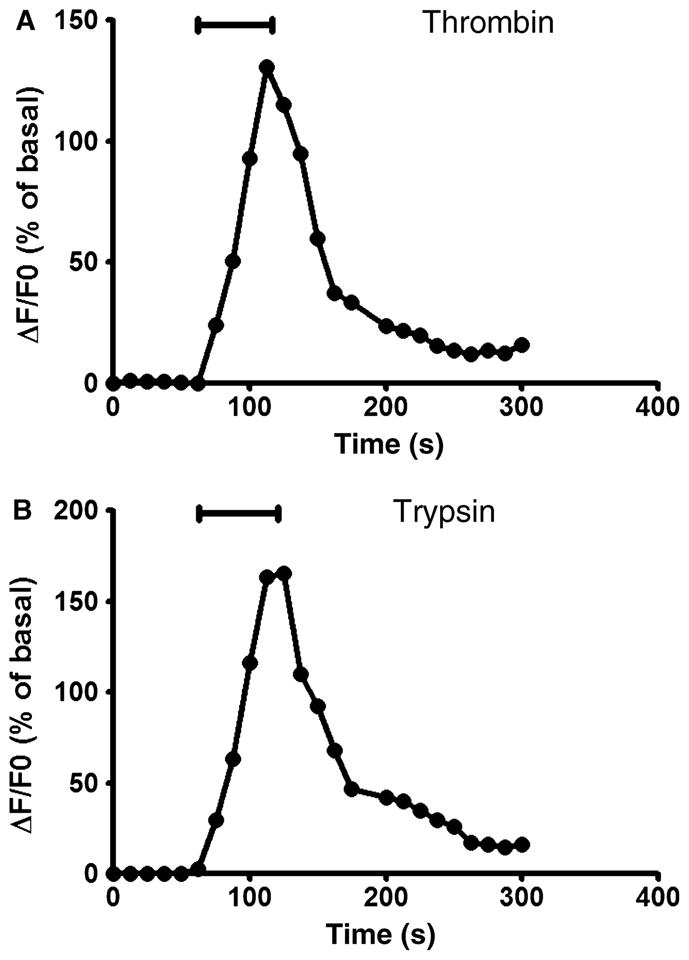
Exposure of cultured dorsal motor nucleus of the vagus (DMV) neurons to 100 nmol L−1 of thrombin (A) or trypsin (B) in a Ca2+-free buffer produced a transient increase in [Ca2+]i.
We next examined the effects of PLC inhibition on [Ca2+]i elicited by activation of PAR-1 and PAR-2. To inhibit PLC activity, the aminosteroid U73122 (1 μmol L−1) was added 60 s prior to the perfusion buffer before addition of the corresponding agonist peptide. This compound has been shown to inhibit PLC activity in a variety of cell types. As a negative control, U73343 (1 μmol L−1), an inactive analogue of U73122, was used 60 s prior to exposure to agonist. Neither U73122 nor U73343 alone demonstrated any effect on baseline [Ca2+]i in cultured DMV neurons (ΔF/F0 of 1 ± 0.2% for U73122 and 1.5 ± 0.3% for U73343 relative to 1.6 ± 0.4% for control, P > 0.05). Pretreatment DMV neurons with U73122 significantly attenuated the thrombin-induced increases in maximal ΔF/F0, while U73343 did not demonstrate any effect (Fig. 4A). Thrombin-mediated increases in peak ΔF/F0 were significantly attenuated by pretreatment with U73122 from 140 ± 17% to 21 ± 3% (P < 0.05) (Fig. 4A). Exposure of DMV neuronal cells to 1 μmol L−1 U73122 also significantly decreased trypsin-mediated increment in peak ΔF/F0 from 185 ± 21% to 19 ± 6% (P < 0.05), while U73343 did not have any significant effect (148 ± 5% vs 158 ± 5% for control, P > 0.05) (Fig. 4B).
Figure 4.

Effect of PLC inhibition on [Ca2+]i signalling. Dorsal motor nucleus of the vagus (DMV) neuronss were exposed to the PLC inhibitor U73122 (1 μmol L−1) or its inactive analogue U73122 (1 μmol L−1) 1 min before treatment with 100 nmol L−1 of thrombin (A) or trypsin (B).
Phospholipase C has been well characterized to catalize the production of IP3, which in turn activates the IP3 receptor on the endoplasmic reticulum to mobilize the release of calcium from the intracellular calcium stores. To determine whether activation of PAR-1 or PAR-2 leads to the release of IP3 sensitive intracellular calcium stores, we used 2APB to inhibit IP3 receptor in cultured DMV neurons. 2APB alone did not alter baseline [Ca2+]i (ΔF/F0 of 1.4 ± 0.3%, P > 0.05). Pretreatment of DMV neurons significantly inhibited the peak ΔF/F0 responses induced by thrombin (an inhibition of 72 ± 13%, P < 0.05) (Fig. 5A). Similar to these observation, either trypsin-induced increases in maximal increment of ΔF/F0 were significantly decreased by 71 ± 10% (P < 0.05) when DMV cells were pre-exposed to 2APB (Fig. 5B).
Figure 5.

Involvement of IP3 sensitive calcium store. Treatment of cultured dorsal motor nucleus of the vagus (DMV) neurons with the cell-permeant IP3 receptor inhibitor 2APB (100 μmol L−1) reduced the [Ca2+]i responses to thrombin (100 nmol L−1) or trypsin (100 nmol L−1).
Presence of PAR1 and PAR2 in DMV
RT-PCR was performed using primers specific for the PAR-1 or PAR-2 for DMV tissues from rats. The presence of transcripts for PAR-1 and PAR-2 in the rat dorsal motor nucleus was demonstrated in Fig. 6. Sequence analysis confirmed that these PCR products match the published sequences for rat PAR1 and PAR2. Negative control detected no signal. The transcripts for PAR-1 or PAR-2 were demonstrated to be significantly elevated in DMV tissues derived from the rats with IBD as compared to the control animals (Fig. 6). Double immunofluorescent staining using specific antibodies against PAR1 and Hu, a neuronal marker, demonstrated the co-localization of PAR1 and Hu in cultured DMV neurons, suggesting the expression of PAR receptor in DMV neuronal cells (Fig. 6C). Negative control using control IgG detected no signal.
Figure 6.

Expression of protease-activated receptor 1 (PAR-1) and PAR-2 mRNA. mRNA levels of PAR-1 (A) and PAR2 (B) in the dorsal motor nucleus of the vagus (DMV) tissues derived from control or TNBS-induced IBD rats were examined by real time RT-PCR as described in the text. Data was expressed as mean ± SEM. * indicates P < 0.05 vs. control. n = 10 for each group. Double immunofluorescent staining using specific antibodies against PAR1 and Hu, a neuronal marker, demonstrated the co-localization of PAR1 and Hu in cultured DMV neurons (C). Negative control using control IgG detected no signal.
DISCUSSION
Our study demonstrates the presence of functionally active PAR-1 and PAR-2 in DMV neuronal cells. Five distinct observations support this conclusion: (i) DMV neuronal cells respond dose-dependently with increments in [Ca2+]i to both thrombin and trypsin; (ii) Dose-dependent increases in [Ca2+]i and in the percentage of cells responding were observed with exposure to synthetic PARP-1 and PARP-2; (iii) Receptor desensitization typical of PARs was noted with repetitive exposure; (iv) Activation of PAR-1 or PAR-2 leads to the mobilization of IP3 sensitive intracellular calcium store by a mechanism involving PLC; (v) Transcripts for PAR1 or PAR2 receptors are present in the rat DMV tissues.
Inflammatory bowel disease is histologically characterized by the infiltration of a large number of neutrophils, macrophages, lymphocytes and mast cells in the mucosa and submucosa of intestine, in particular the large intestine. The infiltration of these immune cells, as in TNBS-induced colitis activated CD4 helper T cell, promote an exaggerated autoimmune activation, giving rise to a prolonged severe transmural inflamed intestinal mucosa, characterized by uncontrolled production of inflammatory cytokines and chemokines.21 These inflammatory cytokines and chemokines have been proposed to contribute to the changes in neurochemical coding and the hyperexcitability of the enteric neurons, accounting for the inappropriate sensing and motility of the gastrointestinal tract due to IBD. Our findings extend these observations to include the DMV neurons and challenge the classical notion that DMV is a well protected nucleus and inert to change. Several recent studies also support the idea that DMV may be subject to systemic stimulation. The DMV directly responds to systemic endotoxin,13 suggesting that the DMV may possess the characteristics of a circumventricular organ, which may be devoid of a blood–brain barrier.14–16 In addition, dendrites from neurons of the DVC have been observed to penetrate the ependymal layer and enter the floor of the fourth ventricle, suggesting that the DMV may monitor either the blood or ventricular fluids.22,23 Furthermore, increase in permeability through the blood-brain barrier has been reported in TNBS-induced colitis rats and rabbits.17,18 Moreover, specific saturable transport systems for the entry of both TNF-α and IL-1β into the CNS have been described.24,25 Thus, it is possible that the DMV is exposed to pro-inflammatory cytokines circulating in blood, particularly in the setting of acute intestinal inflammation, potentially contributing to changes in gastrointestinal functions such as motility. Our previous studies suggest the structural change in DMV neurons following TNBS-induced colitis, likely due to the apoptosis caused by the systemic cytokines such as TNF1α and IL1β.19 Our current observations demonstrate the presence of PAR-1 and PAR-2 in the DMV neurons, suggesting that proteases such as thrombin and trypsin may have an impact on DMV neurons during intestinal inflammation. As neither thrombin nor trypsin transcripts were detected in the DMV tissues (data not shown), it is most likely that the agonists responsive for activation of PARs in DMV derive from the circulation which carries the PAR agonists from the inflammatory intestine. However, the probability that vagal afferent nerves and NTS neurons are affected by circulating inflammatory mediators and will thus affect DMV neurons and the vagal efferent outflow can not be ruled out.
Activation of both PAR-1 and PAR-2 has been reported to increase [Ca2+]i in different cell types, through G-protein-mediated activation of different calcium signalling cascades.10,12,26,27 The intracellular origin of the initial calcium increase has been demonstrated in epithelial cell, myenteric neurons and glial cells, where activation of these receptors induces increased [Ca2+]i in the absence of extracellular calcium. 10,12,28 The specificity of agonist peptides PARP-1 and PARP-2 has been demonstrated in different models, mimicking thrombin and trypsin actions respectively. 10,29–31 PARs demonstrate a unique mechanism of receptor activation through cleavage of the N-terminus. This receptor cleavage is believed to contribute to receptor desensitization, making the cleaved receptor molecule non-responsive to a second exposure to protease. This desensitization has been noted in previous reports in which primary exposure to trypsin or thrombin abolished subsequent responsiveness to the proteases. In contrast, primary exposure to PARP-1 or PARP-2 results in diminished, but still present, responsiveness to repetitive exposure to the synthetic peptides.28,32 Study of PAR-1 and PAR-2 signalling in DMV neuronal cells indicates that receptor activation may lead to rapid release of calcium from intracellular stores, followed by secondary influx of calcium from extracellular sources. Moreover, the current investigation indicates that IP3 is the cellular intermediate that participates in PAR-1 and PAR-2 calcium signalling in DMV neurons. PAR-1-induced Ca2+transients were significantly diminished by PLC inhibition and the IP3 receptor antagonism. These observations are consistent with previous studies in which PARs have been reported to couple to PLC, stimulating IP3 production, and release of calcium from IP3-sensitive intracellular stores.10,12,28,33
The physiological and pathological role of PAR signalling in DMV neurons is currently unknown. The recent finding of a thrombin-generating system in the brain and the presence of PAR-1 in neurons and glia suggest that PAR-1 may have functions in addition to revascularization.34 PAR-2 activation has been related to release of proteinases in inflammatory and allergic conditions, vasodilatation of cerebral arteries, release of prostaglandins, and regulation of cytokine production in enterocytes.35,36 Mobilization of intracellular calcium stores upon activation of PARs in DMV neurons suggests that PARs may play an important role in the physiological functions of DMV neurons and their pathological responses to systemic inflammation. Whether the intracellular calcium signalling induced by PAR activation in DMV neurons affects the secretion of neuronal transmitters or contributes to mitochondria-mediated apoptosis as observed during inflammation requires further investigation. The effects of intestinal inflammation include injury to the local cells located in the intestinal wall and the systemic inflammatory responsiveness such as anorexia, diarrhoea, and weight loss. It is likely that intestinal inflammation affects the structure and function of the DMV, potentially contributing to the pathophysiology of IBD. Our study suggests that circulating inflammatory mediators such as thrombin released as a consequence of inflammatory bowel disease affect DMV neurons innervating gastrointestinal organs such as the stomach and intestine. Whether this effect accounts for the high reported incidence of gastritis and gastric/duodenal lesions in patients with IBD is an interesting area remaining to be explored.
Acknowledgments
This study was supported by National Institutes of Health Grant 4R37DK043225-19.
Footnotes
DISCLOSURES
The authors have no other relevant disclosures or conflicts of interests.
References
- 1.Marlow SL, Blennerhassett MG. Deficient innervation characterizes intestinal strictures in a rat model of colitis. Exp Mol Pathol. 2006;80:54–66. doi: 10.1016/j.yexmp.2005.04.006. [DOI] [PubMed] [Google Scholar]
- 2.Rogers RC, McTigue DM, Hermann GE. Vagovagal reflex control of digestion: afferent modulation by neural and “endoneurocrine” factors. Am J Physiol. 1995;268:1–10. doi: 10.1152/ajpgi.1995.268.1.G1. [DOI] [PubMed] [Google Scholar]
- 3.Travagli RA, Hermann GE, Browning KN, Rogers RC. Brainstem circuits regulating gastric function. Annu Rev Physiol. 2006;68:279–305. doi: 10.1146/annurev.physiol.68.040504.094635. [DOI] [PMC free article] [PubMed] [Google Scholar]
- 4.Chang HY, Mashimo H, Goyal RK. Musings on the wanderer: what’s new in our understanding of vago-vagal reflex? IV. Current concepts of vagal efferent projections to the gut. Am J Physiol Gastrointest Liver Physiol. 2003;284:G357–66. doi: 10.1152/ajpgi.00478.2002. [DOI] [PubMed] [Google Scholar]
- 5.Fiorucci S, Mencarelli A, Palazzetti B, et al. Proteinase-activated receptor 2 is an anti-inflammatory signal for colonic lamina propria lymphocytes in a mouse model of colitis. Proc Natl Acad Sci USA. 2001;98:13936–41. doi: 10.1073/pnas.241377298. [DOI] [PMC free article] [PubMed] [Google Scholar]
- 6.Nystedt S, Larsson AK, Aberg H, Sundelin J. The mouse proteinase-activated receptor-2 cDNA and gene. Molecular cloning and functional expression. J Biol Chem. 1995;270:5950–5. doi: 10.1074/jbc.270.11.5950. [DOI] [PubMed] [Google Scholar]
- 7.Vu TK, Wheaton VI, Hung DT, Charo I, Coughlin SR. Domains specifying thrombin-receptor interaction. Nature. 1991;353:674–7. doi: 10.1038/353674a0. [DOI] [PubMed] [Google Scholar]
- 8.Ishihara H, Connolly AJ, Zeng D, et al. Protease-activated receptor 3 is a second thrombin receptor in humans. Nature. 1997;386:502–6. doi: 10.1038/386502a0. [DOI] [PubMed] [Google Scholar]
- 9.Xu WF, Andersen H, Whitmore TE, et al. Cloning and characterization of human protease-activated receptor 4. Proc Natl Acad Sci USA. 1998;95:6642–6. doi: 10.1073/pnas.95.12.6642. [DOI] [PMC free article] [PubMed] [Google Scholar]
- 10.Corvera CU, Déry O, McConalogue K, et al. Thrombin and mast cell tryptase regulate guinea-pig myenteric neurons through proteinase-activated receptors-1 and -2. J Physiol. 1999;517:741–56. doi: 10.1111/j.1469-7793.1999.0741s.x. [DOI] [PMC free article] [PubMed] [Google Scholar]
- 11.Green BT, Bunnett NW, Kulkarni-Narla A, Steinhoff M, Brown DR. Intestinal type 2 proteinase-activated receptors: expression in opioid-sensitive secretomotor neural circuits that mediate epithelial ion transport. J Pharmacol Exp Ther. 2000;295:410–6. [PubMed] [Google Scholar]
- 12.Garrido R, Segura B, Zhang W, Mulholland M. Presence of functionally active protease-activated receptors 1 and 2 in myenteric glia. J Neurochem. 2002;83:556–64. doi: 10.1046/j.1471-4159.2002.01119.x. [DOI] [PubMed] [Google Scholar]
- 13.Elmquist JK, Scammell TE, Jacobson CD, Saper CB. Distribution of Fos-like immunoreactivity in the rat brain following intravenous lipopolysaccharide administration. J Comp Neurol. 1996;371:85–103. doi: 10.1002/(SICI)1096-9861(19960715)371:1<85::AID-CNE5>3.0.CO;2-H. [DOI] [PubMed] [Google Scholar]
- 14.Broadwell RD, Sofroniew MV. Serum proteins bypass the blood-brain fluid barriers for extracellular entry to the central nervous system. Exp Neurol. 1993;120:245–63. doi: 10.1006/exnr.1993.1059. [DOI] [PubMed] [Google Scholar]
- 15.Whitcomb DC, Taylor IL, Vigna SR. Characterization of saturable binding sites for circulating pancreatic polypeptide in rat brain. Am J Physiol. 1990;259:687–91. doi: 10.1152/ajpgi.1990.259.4.G687. [DOI] [PubMed] [Google Scholar]
- 16.Gross PM, Wall KM, Pang JJ, Shaver SW, Wainman DS. Microvascular specializations promoting rapid interstitial solute dispersion in nucleus tractus solitarius. Am J Physiol. 1990;259:1131–8. doi: 10.1152/ajpregu.1990.259.6.R1131. [DOI] [PubMed] [Google Scholar]
- 17.Hathaway CA, Percy WH, Williams JL. Effects of free radicals and leukocytes on increases in blood-brain barrier permeability during colitis. Dig Dis Sci. 2000;45:967–75. doi: 10.1023/a:1005585327173. [DOI] [PubMed] [Google Scholar]
- 18.Natah SS, Mouihate A, Pittman QJ, Sharkey KA. Disruption of the blood-brain barrier during TNBS colitis. Neurogastroenterol Motil. 2005;17:433–46. doi: 10.1111/j.1365-2982.2005.00654.x. [DOI] [PubMed] [Google Scholar]
- 19.Ammori JB, Zhang WZ, Li JY, Chai BX, Mulholland MW. Effect of intestinal inflammation on neuronal survival and function in the dorsal motor nucleus of the vagus. Surgery. 2008;144:149–58. doi: 10.1016/j.surg.2008.03.042. [DOI] [PubMed] [Google Scholar]
- 20.Zhang W, Hu Y, Newman EA, Mulholland MW. Serum-free culture of rat postnatal neurons derived from the dorsal motor nucleus of the vagus. J Neurosci Methods. 2006;150:1–7. doi: 10.1016/j.jneumeth.2005.03.015. [DOI] [PubMed] [Google Scholar]
- 21.Strober W, Fuss IJ, Blumberg RS. The immunology of mucosal models of inflammation. Annu Rev Immunol. 2002;20:495–549. doi: 10.1146/annurev.immunol.20.100301.064816. [DOI] [PubMed] [Google Scholar]
- 22.Rogers RC, McCann MJ. Intramedullary connections of the gastric region in the solitary nucleus: a biocytin histochemical tracing study in the rat. J Auton Nerv Syst. 1993;42:119–30. doi: 10.1016/0165-1838(93)90043-t. [DOI] [PubMed] [Google Scholar]
- 23.Shapiro RE, Miselis RR. The central organization of the vagus nerve innervating the stomach of the rat. J Comp Neurol. 1985;238:473–88. doi: 10.1002/cne.902380411. [DOI] [PubMed] [Google Scholar]
- 24.Banks WA, Kastin AJ, Gutierrez EG. Interleukin-1 alpha in blood has direct access to cortical brain cells. Neurosci Lett. 1993;163:41–4. doi: 10.1016/0304-3940(93)90224-9. [DOI] [PubMed] [Google Scholar]
- 25.Gutierrez EG, Banks WA, Kastin AJ. Murine tumor necrosis factor alpha is transported from blood to brain in the mouse. J Neuroimmunol. 1993;47:169–76. doi: 10.1016/0165-5728(93)90027-v. [DOI] [PubMed] [Google Scholar]
- 26.Wang JL, Kalyanaraman S, Vivo MD, Gautam N. Bombesin and thrombin affect discrete pools of intracellular calcium through different G-proteins. Biochem J. 1996;320:87–91. doi: 10.1042/bj3200087. [DOI] [PMC free article] [PubMed] [Google Scholar]
- 27.Brass LF, Hoxie JA, Manning DR. Signaling through G proteins and G protein-coupled receptors during platelet activation. Thromb Haemost. 1993;70:217–23. [PubMed] [Google Scholar]
- 28.Böhm SK, Khitin LM, Grady EF, Aponte G, Payan DG, Bunnett NW. Mechanisms of desensitization and resensitization of proteinase-activated receptor-2. J Biol Chem. 1996;271:22003–16. doi: 10.1074/jbc.271.36.22003. [DOI] [PubMed] [Google Scholar]
- 29.Chao BH, Kalkunte S, Maraganore JM, Stone SR. Essential groups in synthetic agonist peptides for activation of the platelet thrombin receptor. Biochemistry. 1992;31:6175–8. doi: 10.1021/bi00142a001. [DOI] [PubMed] [Google Scholar]
- 30.Hollenberg MD, Saifeddine M, al-Ani B, Kawabata A. Proteinase-activated receptors: structural requirements for activity, receptor cross-reactivity, and receptor selectivity of receptor-activating peptides. Can J Physiol Pharmacol. 1997;75:832–41. [PubMed] [Google Scholar]
- 31.Vergnolle N, Macnaughton WK, Al-Ani B, Saifeddine M, Wallace JL, Hollenberg MD. Proteinase-activated receptor 2 (PAR2)-activating peptides: identification of a receptor distinct from PAR2 that regulates intestinal transport. Proc Natl Acad Sci USA. 1998;95:7766–71. doi: 10.1073/pnas.95.13.7766. [DOI] [PMC free article] [PubMed] [Google Scholar]
- 32.Hammes SR, Coughlin SR. Protease-activated receptor-1 can mediate responses to SFLLRN in thrombin-desensitized cells: evidence for a novel mechanism for preventing or terminating signaling by PAR1’s tethered ligand. Biochemistry. 1999;38:2486–93. doi: 10.1021/bi982527i. [DOI] [PubMed] [Google Scholar]
- 33.Babich M, King KL, Nissenson RA. Thrombin stimulates inositol phosphate production and intracellular free calcium by a pertussis toxinin-sensitive mechanism in osteosarcoma cells. Endocrinology. 1990;126:948–54. doi: 10.1210/endo-126-2-948. [DOI] [PubMed] [Google Scholar]
- 34.Ubl JJ, Vöhringer C, Reiser G. Co-existence of two types of [Ca2+]i -inducing protease-activated receptors (PAR-1 and PAR-2) in rat astrocytes and C6 glioma cells. Neuroscience. 1998;86:597–609. doi: 10.1016/s0306-4522(97)00686-6. [DOI] [PubMed] [Google Scholar]
- 35.Wakita H, Furukawa F, Takigawa M. Thrombin and trypsin induce granulocyte-macrophage colony-stimulating factor and interleukin-6 gene expression in cultured normal human keratinocytes. Proc Assoc Am Physicians. 1997;109:190–207. [PubMed] [Google Scholar]
- 36.Sobey CG, Moffatt JD, Cocks TM. Evidence for selective effects of chronic hypertension on cerebral artery vasodilatation to protease-activated receptor-2 activation. Stroke. 1999;30:1933–41. doi: 10.1161/01.str.30.9.1933. [DOI] [PubMed] [Google Scholar]