

Abstract
Introduction
Absence of functional myostatin (MSTN) during fetal development results in adult skeletal muscle hypertrophy and hyperplasia.
Methods
To more fully characterize MSTN loss in hindlimb muscles, the morphology and contractile function of the soleus, plantaris, gastrocnemius, tibialis anterior and quadriceps muscles in male and female null (Mstn −/−), heterozygous (Mstn +/−) and wildtype (Mstn +/+) mice were investigated.
Results
Muscle weights of Mstn −/− mice were greater than Mstn +/+ and Mstn +/−. Fiber cross-sectional area (CSA) was increased in female Mstn −/− soleus and gastrocnemius muscles and in the quadriceps of male Mstn −/− mice; peak tetanic force in Mstn −/− mice did not parallel the increased muscle weight or CSA. Male Mstn −/− muscle exhibited moderate degeneration.
Discussion
Visible pathology in male mice and decreased contractile strength relative to increased muscle weight suggest MSTN loss results in muscle impairment which is dose, sex and muscle dependent.
Keywords: muscle weight, myostatin deficiency, peak tetanic force, muscle weakness, sex differences
INTRODUCTION
Myostatin (MSTN) is a highly conserved negative regulator of skeletal muscle mass and a member of the transforming growth factor - ß (TGF-ß) family 1. The Mstn gene is expressed in adult skeletal muscle, heart and adipose tissue 2. When functional MSTN is absent during fetal development, the resultant adult muscle mass is significantly increased due to both hypertrophy and hyperplasia of skeletal muscle fibers3,4. Though there is extensive evidence of muscle hypertrophy in response to MSTN deficiency, the impact on muscle function4,5 needs further clarification. The reported inconsistencies in skeletal muscle strength and pathology4,5 may reflect the impact of parental MSTN status on offspring skeletal muscle phenotype6, sex differences, and variation in mouse genetic background.
The homozygous null myostatin (Mstn −/−) murine model, first generated and described in 1997 by McPherron et al., was achieved by disrupting the GDF-8 gene by gene targeting 4. Mstn −/− animals are approximately 30% larger than their wildtype (Mstn +/+) littermates 4. Heterozygous (Mstn +/−) animals have been shown to have an intermediate phenotype between control and Mstn −/− animals, suggesting a dose-dependent effect of MSTN protein levels on skeletal muscle mass3,7. Alterations in muscle mass, fiber contractile properties and fiber type have been reported in the Mstn −/− model 5,8,9. Several studies have been performed on mice with the Mstn mutation on different background strains 1,5,10,11, using mice of different ages and sexes 1,4-6,9-11, different breeding strategies and variable amounts of backcrossing 1,5,6,9. Contractile function has been studied in only a few muscles 5,9,10. Thus, there is a clear need for a comprehensive evaluation of in situ skeletal muscle function in age-matched male and female Mstn +/− and Mstn −/− mice on a congenic background generated by a consistent breeding strategy.
The following study was performed to provide a comprehensive analysis of several hindlimb skeletal muscles with different fiber type compositions, functions and architectures including the soleus (S), plantaris (P), gastrocnemius (G), tibialis anterior (TA) and quadriceps (Q) muscles. We examined 4 month old male and female Mstn +/+, Mstn +/− and Mstn −/− mice, taking into account the documented maternal affect of MSTN6 while controlling carefully for genetic background. Our studies indicated that male and female Mstn −/− skeletal muscles had increased muscle wet weight and reductions in the strength of selected muscles. Mstn +/− mice had a similar but milder skeletal muscle phenotype. Frequently, male Mstn −/− mice had evidence of moderate muscle pathology, while male Mstn +/− mice had evidence of mild pathology and females appeared unaffected.
MATERIALS AND METHODS
Experimental Model
Mature male and female wildtype (Mstn +/+ m=11, f=11), heterozygous (Mstn +/− m=10, f=15) and homozygous (Mstn −/− m=12, f=11) mice maintained on a C57BL/6J (B6) background 12 were evaluated. The B6 background was verified to be > 99% congenic after 11 generations by microsatellite analysis (RADIL, Columbia, MO). B6 Mstn +/− animals were then bred to produce the congenic B6 Mstn +/+, Mstn +/− and Mstn −/−animals12. All mice used in the study were the result of Mstn +/− x Mstn +/− crosses so that maternal MSTN status remained constant6. Mice were 4 months of age at time of study to avoid characterizing animals in the rapid growth phase of development. The protocols used for this study comply with the guidelines of the American Physiological Society. All experimental manipulations were performed under an approved University of Missouri Animal Care and Use Protocol.
Contractile properties
The soleus (S), plantaris (P), gastrocnemius (G), tibialis anterior (TA), and quadriceps (Q) muscles were chosen based on their differing fiber type compositions, architecture and contribution to movement. Multiple muscles were studied, as there is evidence that selected muscles may respond differently to MSTN inhibition10. The S, P, G, TA and Q muscles are uni- or multi-pennate; span one or more joints and function as anti-gravity, postural or locomotor muscles. The S, P and G muscles serve as plantar flexors, the TA is a dorsal flexor in mice13 and the Q extends the knee and flexes the hip 14.
To determine in situ contractile properties of the S, P, G, and TA muscles in 4 month old Mstn +/+, Mstn +/− and Mstn −/− mice, animals were anesthetized with pentobarbital sodium (0.15ml pentobarbital with 0.85ml saline) with 0.15ml as first injection, and anesthesia was maintained with 0.05ml injection given as needed. Each mouse was placed laterally on a water-jacketed heating pad maintained at 37°C. The left S, P, G, and TA muscles were surgically exposed at their distal insertions. The distal tendon of each muscle was attached in turn to a Grass force transducer with 4.0 silk. The sciatic nerve was isolated and placed on a bipolar stimulating electrode. The exposed tendon of each muscle was bathed in saline solution, and the nerve was bathed in 37°C mineral oil.
For contractile testing the left hind-limb and mouse torso were firmly immobilized, and muscles were attached in the order of S→P→G→TA to a force transducer by the distal tendon and adjusted in length so that passive tension was zero grams15. A twitch was obtained at that position with parameters of 0.5ms, 0.3Hz, at 6V, and then the micromanipulator was used to progressively lengthen each muscle to the point where peak twitch was attained (Lo). At optimal length, a peak tetanic contraction (Po) was elicited by pulses delivered at 150Hz, 300ms duration, and an intensity of 6V for each type muscle. Preliminary studies revealed 6V to be supramaximal; the 300ms duration was greater than what was required to achieve Po. Force curves generated at 15, 50, 75, 100 and 125Hz revealed that all muscles were maximally recruited by the time 100Hz was reached. All data were collected using Power Lab® (ADInstruments). Contractile function testing lasted approximately 15 minutes.
In pilot studies, random testing of muscles was done as well as testing in the order TA→G→P→S, and no differences in tension were observed, regardless of stimulation order. Repeat testing of S and P during preliminary studies indicated that the protocol did not result in decreased force generation.
Tissue Harvest
After contractile properties were obtained, S, P, G, TA, and Q muscles were removed, cleaned, blotted, and weighed. Muscles were placed in 4% paraformaldehyde solution for 24 hours and then transferred to 70% ethanol for future staining with hematoxylin and eosin (H&E) for morphologic evaluation. Right sided muscles, those that were not electrically stimulated, were placed at their in situ length, embedded in OCT tissue-freezing medium, frozen slowly in chilled 2-methylbuterol, and then placed in liquid nitrogen and stored at −80°C until analysis for myofibrillar ATPase activity.
Histochemistry and cross-sectional myofiber measurements
Paraformaldehyde and ethanol prepared muscles from Mstn +/+, Mstn +/− and Mstn −/− mice were transversely sectioned at the middle of the muscle belly and then sectioned at 5μm and stained with H&E. Digital images were taken from the cross-section at 10x magnification in order to evaluate muscle fiber morphology and to determine fiber cross-sectional area (CSA) measures. Myofiber CSAs were used to measure evidence of atrophy or hypertrophy of discrete muscle fibers, as well as in the calculation of specific Po [peak tetanic force (Po) / CSA (μm2)] for each muscle. Six sections of 50 contiguous myofibers were circled for each muscle to obtain an average of 300 fibers for fiber cross-sectional area measures. Area determinations were done using a calibrated pen by circling each fiber. Image J software (NIH) was used to obtain area data which were subsequently transferred into an Excel spreadsheet (Microsoft Office, 2003).
Myofibrillar ATPase activity
Right-sided S, P, G, TA and Q muscles, which were harvested immediately after contractile studies and stored at −80°C, were thawed to −20°C in a microtome, oriented vertically, and sectioned at 10μm. Sections were stained using traditional acid-stable myofibrillar ATPase stain (4.2 pH acid preincubation) to reveal muscle fiber type16.
Statistical analysis
Statistical analyses were performed using SAS (SAS Institute Inc., Cary, NC). Data from the three groups were analyzed as a 3×2 factorial (3 genotypes, 2 sexes). Mean differences were determined using Fisher’s Least Significant Difference (LSD). When heterogeneous variations made it necessary, a log transformation was used to stabilize heterogeneous variation. If this log transformation failed to stabilize the variation, a non-parametric ranked analysis was performed as outlined by Conover et al.17. Results are presented as mean ± standard error (SE). Differences were considered to be statistically significant at a p value ≤ 0.05 unless stated otherwise.
RESULTS
Muscle weight
Both male and female whole muscle weights of S, P, G, TA and Q muscles in Mstn −/− mice were greater (p ≤ 0.05) than their Mstn +/+ and Mstn +/− counterparts (Table 1 A,B). Male and female Mstn −/− whole muscle weights were 29-47% and 34-50% greater, respectively than their same sex Mstn +/+ counterparts, respectively. Male Mstn +/− P and G muscles were 13% and 17% larger, respectively than male Mstn +/+ P and G muscles. Female Mstn +/− P, G and TA muscles were 11%, 10%, and 14% larger, respectively than female Mstn +/+ P, G and TA muscles. Relative weights (muscle weight / body weight) of male and female Mstn −/− muscles were 17-39% and 22-40% greater (p < 0.05), respectively than male and female Mstn +/+ muscles. Relative weights of male and female S, P, G, TA and Q Mstn −/− muscles were also larger (p < 0.05) than Mstn +/− muscles. In male Mstn +/− mice, relative weights of P and G muscles were 13% and 17% greater (p < 0.05), respectively than male Mstn +/+ mice. Female Mstn +/− mice had 8% and 7%, respectively greater relative P and G weights (p = 0.0573 for P) compared with relative P and G weights of Mstn +/+ female mice (Table 1 A,B). These findings suggest that MSTN deficiency and absence results in muscle hypertrophy rather than general body growth.
Table 1A.
Body and muscle weight of male 4 month old wildtype (Mstn +/+), heterozygous (Mstn +/−) and homozygous (Mstn −/−) mice
| PARAMETERS | MOUSE GENOTYPE | ||||
|---|---|---|---|---|---|
|
Mstn+/+ (n=12) |
Mstn+/− (n=10) |
% change from Mstn+/+ |
Mstn−/− (n=11) |
% change from Mstn+/+ |
|
| Body weight (g) | 33.67 ± 0.58 | 33.75 ± 1.00 | +0.2% | 38.80 ± 0.73*† | +13% |
|
| |||||
| Muscle wet weight (mg) | |||||
|
| |||||
| S | 11.31 ± 0.7 | 11.10 ± 0.60 | −2% | 15.94 ± 1.10*† | +29% |
| P | 21.02 ± 0.40 | 24.08 ± 0.66* | +13% | 39.46 ± 2.70*† | +47% |
| G | 142.79 ± 3.10 | 171.84 ± 5.60* | +17% | 268.30 ± 17.00*† | +47% |
| TA | 57.39 ± 2.7 | 61.46 ± 3.80 | +7% | 95.31 ± 5.50*† | +40% |
| Q | 229.00 ± 7.0 | 255.12 ± 13.2 | +10% | 386.73 ± 22.50*† | +41% |
|
| |||||
| Relative Wet Muscle Weight [Wet wt (mg)/ Body wt (g)] | |||||
|
| |||||
| S | 0.034 ± 0.002 | 0.033 ± 0.002 | −3% | 0.041 ± 0.002*† | +17% |
| P | 0.062 ± 0.001 | 0.071 ± 0.003* | +13% | 0.101 ± 0.006*† | +39% |
| G | 0.425 ± 0.010 | 0.513 ± 0.030* | +17% | 0.689 ± 0.040*† | +38% |
| TA | 0.170 ± 0.007 | 0.183 ± 0.010 | +7% | 0.246 ± 0.020*† | +31% |
| Q | 0.683 ± 0.030 | 0.761 ± 0.050 | +10% | 0.995 ± 0.060*† | +31% |
Values expressed as mean ± SE. S, soleus; P, plantaris; G, gastrocnemius; TA, tibialis anterior; Q, quadriceps; Mstn, myostatin
p < 0.05 compared to Mstn +/+
p < 0.05 compared to Mstn +/−
Table 1B.
Body and muscle weight of female 4 month old wildtype (Mstn +/+), heterozygous (Mstn +/−) and homozygous (Mstn −/−) mice
| PARAMETERS | MOUSE GENOTYPE | ||||
|---|---|---|---|---|---|
|
Mstn+/+ (n=11) |
Mstn+/− (n=15) |
% change from Mstn+/+ |
Mstn−/− (n=11) |
% change from Mstn+/+ |
|
| Body weight (g) | 24.52 ± 0.46 | 25.32 ± 0.57 | +3% | 29.32 ± 0.53‡§ | +16% |
|
| |||||
| Muscle wet weight (mg) | |||||
|
| |||||
| S | 8.64 ± 0.30 | 9.05 ± 0.50 | +5% | 13.14 ± 0.50‡§ | +34% |
| P | 14.55 ± 0.20 | 16.38 ± 0.50‡ | +11% | 29.24 ± 1.10‡§ | +50% |
| G | 115.44 ± 4.50 | 128.28 ± 2.90‡ | +10% | 192.13 ± 6.00‡§ | +40% |
| TA | 42.14 ± 1.10 | 48.77 ± 1.80‡ | +14% | 77.12 ± 3.50‡§ | +45% |
| Q | 172.74 ± 5.10 | 192.14 ± 5.60 | +10% | 280.73 ± 16.2‡§ | +38% |
|
| |||||
| Relative Wet Muscle Weight [Wet wt (mg)/ Body wt (g)] | |||||
|
| |||||
| S | 0.035 ± 0.001 | 0.036 ± 0.002 | +3% | 0.045 ± 0.001‡§ | +22% |
| P | 0.060 ± 0.001 | 0.065 ± 0.002‡ | +8% | 0.100 ± 0.003‡§ | +40% |
| G | 0.470 ± 0.010 | 0.507 ± 0.006‡ | +7% | 0.655 ± 0.010‡§ | +28% |
| TA | 0.163 ± 0.006 | 0.193 ± 0.007 | +16% | 0.264 ± 0.010‡§ | +38% |
| Q | 0.705 ± 0.020 | 0.761 ± 0.020 | +7% | 0.954 ± 0.040‡§ | +26% |
Values expressed as mean ± SE. S, soleus; P, plantaris; G, gastrocnemius; TA, tibialis anterior; Q, quadriceps; Mstn, myostatin
p < 0.05 compared to Mstn +/+
p < 0.05 compared to Mstn +/−
Histomorphometry
Evaluation of histology cross-sections of male and female Mstn +/+, Mstn +/− and Mstn −/− S, P, G, TA and Q muscles stained with hematoxylin and eosin (H&E) was performed. Histology cross-sections of male Mstn +/+ (Fig. 1A), Mstn +/− (Fig. 1B) and Mstn −/− (Fig. 1C) Q muscle are shown. Mstn −/− Q muscles showed varying degrees of segmental degeneration and regeneration (intracytoplasmic vacuoles, enlarged fibers and / or fibers with loss of eosin staining, and centralized nuclei) (Fig. 1C). Male Mstn −/− muscles were the most severely affected, particularly the Q muscle. The only lesions noted in male Mstn +/− mice were rare intracytoplasmic vacuoles, primarily in the P muscle (not shown). No lesions were detected in female Mstn −/− or Mstn +/− mice.
Figure 1.

Hematoxylin and eosin (H&E) stained cross-sections of the quadriceps (Q) muscle from 4 month old male (A) wildtype (Mstn +/+), (B) heterozygous (Mstn +/−) and (C) null (Mstn −/−) mice. Mstn −/− Q muscle showed evidence of regeneration, segmental degeneration [swollen fibers (crosses), multiple centralized nuclei (arrows), intracytoplasmic vacuoles (arrow heads), and loss of eosin staining (asterisks)], 10X magnification.
Myofiber Cross-sectional Area
In male mice, the S CSA was 20% larger (p < 0.05) in Mstn −/− compared to Mstn +/+ mice (Fig. 2A). In male Mstn −/− mice, Q CSA was 25% greater than the Q CSA in Mstn +/− mice. Q CSA in female mice was not significantly different between genotypes, though female Mstn −/− S, P and G had larger (p < 0.05) CSAs compared to Mstn +/+ (31%, 20%, and 30% larger, respectively) and Mstn +/− (21%, 28% and 38% larger, respectively) mice (Fig. 2B). In contrast, CSAs of TA muscles in male and female mice were not different between the genotypes (Fig. 2A,B).
Figure 2.

(A) Cross-sectional areas [CSAs (μm2)] of soleus (S), plantaris (P), gastrocnemius (G), tibialis anterior (TA) and quadriceps (Q) muscles of male Mstn +/+ (n=9-12; black solid), Mstn +/− (n=6-8; diagonal), Mstn −/− (n=7; open) mice (mean ± SE). S CSA was larger in Mstn −/− compared to Mstn +/+ (p < 0.05). Male Mstn −/− Q CSA was larger than Mstn +/− Q CSA (p < 0.05). (B) CSA of S, P, G, TA and Q muscles of female Mstn +/+ (n=8; black solid), Mstn +/− (n=10-14; diagonal), and Mstn −/− (n=7-11; open) mice (mean ± SE). In female Mstn −/− mice S, P and G CSAs were larger than Mstn +/+ and Mstn +/− S, P and G CSAs. * p < 0.05 compared to same sex Mstn +/+, † p < 0.05 compared to same sex Mstn +/−.
Contractile Force Generating Capacity
Absolute whole muscle contractile generating capacity [peak tetanic force (Po)] was not significantly different in the S, G or TA between genotypes in either sex (Fig. 3 A,B and 4 A,B). However, the relative muscle contractile generating capacity [peak tetanic force [(Po) / muscle weight in milligrams (mg)] of S, P, G and TA in Mstn −/− male mice was reduced relative to sex-matched Mstn +/+ and Mstn +/− mice (p < 0.05, except p = 0.0579 for P) (Fig. 3 C,D). G Po / mg was decreased in both male and female Mstn −/− by 39% and 30% compared to male and female Mstn +/+, respectively, and approximately 26% compared to sex-matched Mstn +/− mice (Fig. 3D and 4D). Specific Po [peak tetanic force [(Po) / CSA (μm2)] was impaired only in the S muscle of Mstn −/− males, where S Po / CSA was decreased by 28% compared to the S Po / CSA in Mstn +/+ mice (Fig. 3E).
Figure 3.

(A,B) In 4 month old male mice, there were no significant differences in the amount of absolute whole muscle contractile generating capacity (Po) generated by the soleus (S), plantaris (P), gastrocnemius (G), tibialis anterior (TA) muscles of Mstn +/+ (n=10; black solid), Mstn +/− (n=9; diagonal) and Mstn −/− (n=7; open) mice (mean ± SE). (C,D) Relative muscle contractile generating capacity (Po/mg) of the S, P, G and TA was impaired in male Mstn −/− compared to male Mstn +/+ and Mstn +/− mice (p = 0.0579 for P Po/mg). Male Mstn +/− G Po/mg was significantly reduced compared to Mstn +/+ mice (mean ± SE). (E) Specific tetanic force (Po/CSA) was significantly less in the S of male Mstn −/− mice compared to Mstn +/+ (mean ± SE). (F) There were no specific differences in G Po/CSA or TA Po/CSA between genotypes (mean ± SE). * p < 0.05 compared to Mstn +/+ mice, † p < 0.05 compared to Mstn +/− mice.
Figure 4.

(A,B) In 4 month old female mice, absolute tetanic force (Po) for the plantaris (P) muscle was increased in Mstn −/− (n=11; open) compared to Mstn +/+ (n=10; black solid) and Mstn +/− (n=13; diagonal) (mean ± SE). (C) Relative tetanic force (Po / mg) for the soleus (S) (p = 0.0577) and plantaris (P) muscles was impaired in female Mstn −/− compared to female Mstn +/− mice. (D) Female gastrocnemius (G) and tibialis anterior (TA) Po / mg was significantly reduced in Mstn −/− compared to female Mstn +/+ and Mstn +/− G and TA Po / mg. Mstn +/− TA Po / mg was impaired compared to Mstn +/+ TA Po / mg. (E,F) There were no significant differences in specific tetanic force (Po / CSA) generated by any of the female mouse muscles evaluated between genotypes. * p < 0.05 compared to Mstn +/+ mice, † p < 0.05 compared to Mstn +/− mice.
In contrast to male P Po, female P Po was 44% greater in Mstn −/− mice compared to Mstn +/+ and 35% greater compared to Mstn +/− mice (p < 0.05) (Fig. 4A). In female Mstn −/− mice, S Po / mg was 27% less than Mstn +/− S Po / mg (p = 0.057). P Po / mg was 16% less in female Mstn −/− compared to female Mstn +/− mice (Fig. 4C). Female Mstn −/− mice had 49% and 33% impairment of TA Po / mg compared to Mstn +/+ and Mstn +/− mice, respectively (Fig. 4D).
Myofibrillar ATPase
Fiber-type analysis of the S muscle of male Mstn +/+, Mstn +/− and Mstn −/− mice by histochemical staining for ATPase activity (acid preincubation) revealed significant (p < 0.05) differences in the absolute number of slow type I fibers in the S muscle in Mstn −/− mice as compared to Mstn +/+ S (Fig. 5 A,B). The P, G, TA and Q muscles were composed almost exclusively of type II fibers, and no differences were observed between the fiber type composition of Mstn +/+, Mstn +/− and Mstn −/− muscles (results not shown).
Figure 5.
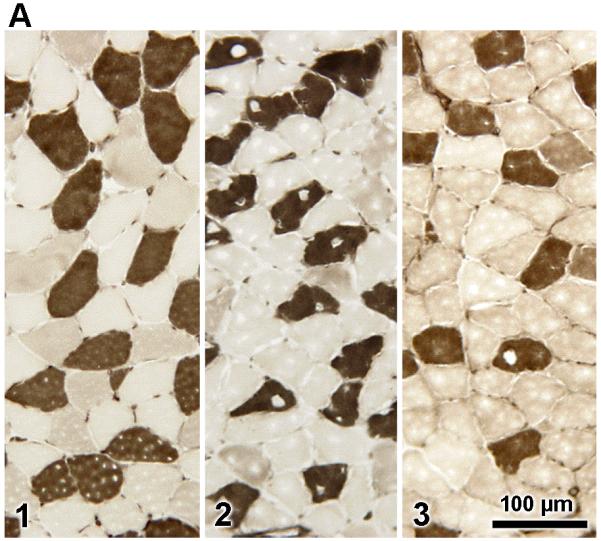

(A) Myofibrillar ATPase staining (acid preincubation) of the soleus (S) muscle in male Mstn +/+ (n=2; (1) left), Mstn +/− (n=2; (2) middle) and Mstn −/− (n=3; (3), right) revealed that Mstn −/− S had significantly (p < 0.05) fewer type I fibers and significantly more type II fibers compared to Mstn +/+ S muscle, 2.5X magnification. (B) Distribution of type I and type II fibers of the S muscle expressed as a percent of total muscle fiber number (mean ± SE).
Discussion
Male and female mice appear to be affected differently by MSTN deficiency. Absence of MSTN increases the CSA of the S and Q muscles in male mice but increases S, P and G CSA in female mice. In females, Po was greater in Mstn −/− P compared to female Mstn +/+ and Mstn +/−, while there were no significant differences between genotypes in males. Interestingly, there was no difference in amount of Po / CSA that could be generated in any of the muscles between female genotypes, but in males, Mstn −/− S Po / CSA was less than Mstn +/+ S Po / CSA. Perhaps the most striking difference between male and female Mstn −/− mice was the presence of moderate segmental degeneration in male Mstn −/− muscle which was non-existent in female Mstn −/− muscle.
Our data suggests that some of the muscles studied have fiber hypertrophy rather than hyperplasia. These findings are consistent with McPherron et al. who also found that the CSA of the G muscle in MSTN deficient animals was 49% larger compared to Mstn +/+4. Contrary to our findings, McPherron et al. found that the CSA of the tibialis cranialis in Mstn −/− mice was 14% larger than in Mstn +/+ mice.
We anticipated that increased CSA in Mstn −/− animals would be accompanied by a commensurate increase in force9, but this was not true for any of the hindlimb muscles in our study. Unlike exercise training, which stimulates an increase in both myofiber CSA and force generating capacity18, increases oxidative metabolism14, and reduces the percentage of type IIb fibers in favor of type IIa fibers19-23, MSTN deficiency causes increased myofiber CSA without parallel increases in muscle force. In addition, there are decreases in mitochondrial number and oxidative capacity5, and there is a reduction in type IIa fibers with a concomitant increase in type IIb fibers5. Amthor et al. looked at specific force generation by the EDL muscle and found that normalizing EDL Po to CSA showed a significant reduction in male Mstn −/− specific force generation compared to wildtype mice5. In further support, Byron et al. also found that, though MSTN deficiency increased muscle mass and bite force (when measured at 20Hz) of the temporalis muscle, when bite force was normalized to muscle CSA, there were no significant differences between Mstn +/+ and Mstn −/− mice24. In contrast to our study, Mendias et al. found that the S Po / CSA was not different in Mstn −/− compared to Mstn +/− and Mstn +/+ mice9. Differences between our study and the Mendias study may be due to the method for evaluating contractile force generation (in situ versus in vitro9) and the age of the animals used; as the mice in our study were 4 months old and those in the Mendias et al. study were 10-12 months of age. Alterations in fiber type, number and size in Mstn −/− mice as a result of the aging process25 could explain the subtle differences between contractile function in ours versus the Mendias et al. study.
In contrast to the report by McPherron et al. that Mstn −/− skeletal muscle appeared grossly normal without obvious signs of degeneration4, Amthor et al. observed cytoplasmic inclusions (determined to be tubular aggregates) in the superficial regions of male and female G, TA and EDL muscles in Mstn −/− male mice at 7 months of age and in females at 10 months of age. Inclusions were not noted in the S muscle, or in animals at 2 months of age5. In our study degenerative changes in muscles are visible at 4 months of age, and the greatest severity and number of lesions was observed in the Q muscle of male Mstn −/− mice. Discrepancies between the findings of McPherron et al. and our findings may be due to differences in background strain of mice, as F2 mice used in the McPherron study were generated on a mixed 129 SV/J, C57BL/6 background4. Amthor et al. noted that centralized nuclei were rarely reported in Mstn −/− mice5. We found evidence of many centralized nuclei, especially in the S and Q muscles. These were interpreted as evidence of myofiber regeneration. We saw no lesions in the skeletal muscle of female Mstn +/− or Mstn −/− mice. Amthor et al. found that females had far fewer lesions than males, though similar declines in the in situ forces were noted. Our results are consistent with Amthor et al., though we found the relative Po for all muscles examined and specific Po of the S were slightly more affected in male Mstn −/− than female Mstn −/− mice. Unfortunately, we were unable to record the contractile force-generating ability of the Q muscle, which had the most severe lesions in male Mstn −/− mice. The reported declines in contractile forces of Mstn −/− muscle in the Amthor et al. study did not correlate with the tubular aggregates and were attributed to mitochondrial depletion, loss of oxidative characteristics of the muscle, reduced capillary density, and problems in calcium handling5.
Rehfeldt et al.26 introduced the murine myostatin mutation Mstn (Cmpt-dl1Abc) (Compact; C) into an inbred mouse line with extreme growth (DUHi) by marker-assisted introgression in order to study the allelic effects on muscle fiber hyperplasia and hypertrophy, capillary density, and muscle fiber metabolism in wildtype, heterozygous (C/+), and homozygous (C/C) mice. They found that in the Mstn Cmpt-dl1Abc mouse the average number of capillaries per muscle fiber was 35% lower in homozygous C/C compared to wildtype animals26. Since capillaries serve as the means for gas, substrate and metabolite exchange27, the increased muscle bulk in Mstn −/− mice without a concomitant increase in capillary density could lead to a decrease in oxygen and nutrient exchange, thus making Mstn −/− animals (males in particular) susceptible to injury.
Another possible factor to consider is the role of muscle fiber type switching. MSTN deficient muscles demonstrate a switch toward type IIb myofibers5, which have been found to be damaged selectively after lengthening contractions28. Type IIb fibers are also preferentially affected in Duchene Muscular Dystrophy (DMD)29, where the absence of dystrophin leaves muscles extremely susceptible to contraction-induced injury30. When the muscle fiber is injured or torn, there is a subsequent influx of Ca+2, and degenerative pathways are activated in the dystrophic muscle31-33. In MSTN deficient muscle, though there is no loss of dystrophin, there may be selective contraction-induced injury in type IIb fibers, thus allowing influx of Ca+2 and subsequent activation of degenerative pathways. Degenerative lesions are most prominent in muscles that contain high percentages of type IIb fibers and would appear visually as segmental degeneration similar to what is seen in the Q muscle of male Mstn −/− mice. The S muscle, which has a higher proportion of type I fibers may have more of a regenerative response. Whereas in dystrophic muscles the degenerative pathways ultimately lead to muscle atrophy with infiltration of fibrous and fatty tissue, this does not appear to be the case in MSTN deficient muscle. Females may also be somewhat protected from this muscle damage and membrane instability by estrogen34,35, which has been shown to play a significant role in stimulating muscle repair and regenerative processes34.
By carefully controlling for the maternal influence and genetic background using a consistent breeding strategy and evaluating both male and female adult mice, we found that though Mstn −/− skeletal muscles had increased weights and reductions in muscle strength of specific muscles in comparison with Mstn +/− and Mstn +/+ mice. Our study further affirms muscle-specific responses to MSTN inhibition5,9-11,25, and it demonstrates sex-specific differences in fiber CSA and contractile force generation of MSTN deficient muscle.
Though complete inhibition of MSTN may not be warranted as a therapeutic intervention due to introduction of muscle degeneration, partial inhibition of MSTN may be considered, since there were increases in muscle weight with only mild lesions and no decreases in Po / CSA in male Mstn +/− mice. In support of this, Mosher et al. studied the effects of a 2-bp deletion in the third exon of the MSTN gene in whippet dogs and its affects on racing performance36. They found that whippets which were heterozygous for the mutation (mh/+) were among the fastest (grade A) racers, demonstrating that heterozygotes carried a performance-enhancing mutation36. It would be of interest to explore why mh/mh whippets do not dominate the racing scene if bigger muscles are supposedly better37, or if complete loss of MSTN would result in reduced performance37. Therefore, there may be a balance between muscle mass and muscular performance as well as therapeutic effectiveness which is optimal in heterozygous but not homozygous null animals3.
ACKNOWLEDGEMENTS
We would like to acknowledge and thank Drs. Stephanie Carleton and Mark Ellersieck for their contributions to this project as well as Jill Gruenkemeyer, Jan Adair and Bonita Cowan of the RADIL histology lab for their technical assistance in slide preparation. We also thank Dr. Gayle Johnson for her assistance with histological evaluation, Amanda McCambridge for her assistance with CSA determination, Hannah Korte for help with the ATPase assay and Dr. Se-Jin Lee for his kind gift of Mstn −/− mice.
Funding:
NIH grants: T32 RR007004 (CF), HD058834 (MB), Phi Zeta (BG), University of Missouri Research Board (CLP), Osteogenesis Imperfecta Foundation (CLP)
ABBREVIATIONS
- ATP
adenosine triphospahte
- C/+
heterozygous for the MstnCmpt-dl1Abc allele
- C/C
homozygous for the MstnCmpt-dl1Abc allele
- CSA
cross-sectional area
- DUHi
Dummerstorf high-inbred mouse line
- EDL
extensor digitorum longus
- G
gastrocnemius
- GDF-8
growth differentiation factor 8
- H&E
hematoxylin & eosin
- LSD
least significant difference
- MSTN
myostatin
- Mstn+/+
myostatin wildtype
- Mstn+/−
myostatin heterozygous
- Mstn−/−
myostatin homozygous null
- Mstn (Cmpt-dl1Abc)
compact murine myostatin allele
- P
plantaris
- Po
absolute whole muscle peak tetanic force
- Po/mg
relative muscle tetanic force
- Po/CSA
specific muscle tetanic force
- RADIL
research animal diagnostic laboratory
- S
soleus
- SE
standard error
- TA
tibialis anterior
- Q
quadriceps
- wt
wildtype
Footnotes
1List of presentations
1NASA/NSBRI Human Research Program Workshop (Houston, TX 2009), the 31st Annual Meeting of the American Society for Bone and Mineral Research (Denver, CO 2009) and the National Space and Biomedical Research Institute Introductory Workshop, (Houston, TX 2008)
REFERENCES
- 1.Girgenrath S, Song K, Whittemore LA. Loss of myostatin expression alters fiber-type distribution and expression of myosin heavy chain isoforms in slow- and fast-type skeletal muscle. Muscle Nerve. 2005;31(1):34–40. doi: 10.1002/mus.20175. [DOI] [PubMed] [Google Scholar]
- 2.Sharma M, Kambadur R, Matthews KG, Somers WG, Devlin GP, Conaglen JV, et al. Myostatin, a transforming growth factor-beta superfamily member, is expressed in heart muscle and is upregulated in cardiomyocytes after infarct. J Cell Physiol. 1999;180(1):1–9. doi: 10.1002/(SICI)1097-4652(199907)180:1<1::AID-JCP1>3.0.CO;2-V. [DOI] [PubMed] [Google Scholar]
- 3.Kollias HD, McDermott JC. Transforming growth factor-beta and myostatin signaling in skeletal muscle. J Appl Physiol. 2008;104(3):579–587. doi: 10.1152/japplphysiol.01091.2007. [DOI] [PubMed] [Google Scholar]
- 4.McPherron AC, Lawler AM, Lee SJ. Regulation of skeletal muscle mass in mice by a new TGF-beta superfamily member. Nature. 1997;387(6628):83–90. doi: 10.1038/387083a0. [DOI] [PubMed] [Google Scholar]
- 5.Amthor H, Macharia R, Navarrete R, Schuelke M, Brown SC, Otto A, et al. Lack of myostatin results in excessive muscle growth but impaired force generation. Proc Natl Acad Sci U S A. 2007;104(6):1835–1840. doi: 10.1073/pnas.0604893104. [DOI] [PMC free article] [PubMed] [Google Scholar]
- 6.Lee SJ. Quadrupling muscle mass in mice by targeting TGF-beta signaling pathways. PLoS One. 2007;2(8):e789. doi: 10.1371/journal.pone.0000789. [DOI] [PMC free article] [PubMed] [Google Scholar]
- 7.Lee SJ. Regulation of muscle mass by myostatin. Annu Rev Cell Dev Biol. 2004;20:61–86. doi: 10.1146/annurev.cellbio.20.012103.135836. [DOI] [PubMed] [Google Scholar]
- 8.Whittemore LA, Song K, Li X, Aghajanian J, Davies M, Girgenrath S, et al. Inhibition of myostatin in adult mice increases skeletal muscle mass and strength. Biochem Biophys Res Commun. 2003;300(4):965–971. doi: 10.1016/s0006-291x(02)02953-4. [DOI] [PubMed] [Google Scholar]
- 9.Mendias CL, Marcin JE, Calerdon DR, Faulkner JA. Contractile properties of EDL and soleus muscles of myostatin-deficient mice. J Appl Physiol. 2006;101(3):898–905. doi: 10.1152/japplphysiol.00126.2006. [DOI] [PMC free article] [PubMed] [Google Scholar]
- 10.Matsakas A, Foster K, Otto A, Macharia R, Elashry MI, Feist S, et al. Molecular, cellular and physiological investigation of myostatin propeptide-mediated muscle growth in adult mice. Neuromuscul Disord. 2009;19(7):489–499. doi: 10.1016/j.nmd.2009.06.367. [DOI] [PubMed] [Google Scholar]
- 11.Siriett V, Platt L, Salerno MS, Ling N, Kambadur R, Sharma M. Prolonged absence of myostatin reduces sarcopenia. J Cell Physiol. 2006;209(3):866–873. doi: 10.1002/jcp.20778. [DOI] [PubMed] [Google Scholar]
- 12.Carleton SM, McBride DJ, Carson WL, Huntington CE, Twenter KL, Rolwes KM, et al. Role of genetic background in determining phenotypic severity throughout postnatal development and at peak bone mass in Col1a2 deficient mice (oim) Bone. 2008;42(4):681–694. doi: 10.1016/j.bone.2007.12.215. [DOI] [PMC free article] [PubMed] [Google Scholar]
- 13.Hesselink RP, Gorselink M, Schaart G, Wagenmakers AJ, Kamphoven J, Reuser AJ, et al. Impaired performance of skeletal muscle in alpha-glucosidase knockout mice. Muscle Nerve. 2002;25(6):873–883. doi: 10.1002/mus.10125. [DOI] [PubMed] [Google Scholar]
- 14.Lieber RL. In: Skeletal muscle structure, function & plasticity : the physiological basis of rehabilitation. Julet T, editor. xii. Lippincott Williams & Wilkins; Philadelphia: 2002. p. 369. [Google Scholar]
- 15.Brown M, Ning J, Ferreira JA, Bogener JL, Lubahn DB. Estrogen receptor-alpha and -beta and aromatase knockout effects on lower limb muscle mass and contractile function in female mice. Am J Physiol Endocrinol Metab. 2009;296(4):E854–861. doi: 10.1152/ajpendo.90696.2008. [DOI] [PMC free article] [PubMed] [Google Scholar]
- 16.Carson FL. Histotechnology A Self-Instructional Text. ASCP Press; Chicago: 1997. p. 304. [Google Scholar]
- 17.Conover WJ, Iman RL. Analysis of covariance using the rank transformation. Biometrics. 1982;38(3):715–724. [PubMed] [Google Scholar]
- 18.Tang JE, Hartman JW, Phillips SM. Increased muscle oxidative potential following resistance training induced fibre hypertrophy in young men. Appl Physiol Nutr Metab. 2006;31(5):495–501. doi: 10.1139/h06-026. [DOI] [PubMed] [Google Scholar]
- 19.Esbjornsson M, Hellsten-Westing Y, Balsom PD, Sjodin B, Jansson E. Muscle fibre type changes with sprint training: effect of training pattern. Acta Physiol Scand. 1993;149(2):245–246. doi: 10.1111/j.1748-1716.1993.tb09618.x. [DOI] [PubMed] [Google Scholar]
- 20.Andersen JL, Klitgaard H, Saltin B. Myosin heavy chain isoforms in single fibres from m. vastus lateralis of sprinters: influence of training. Acta Physiol Scand. 1994;151(2):135–142. doi: 10.1111/j.1748-1716.1994.tb09730.x. [DOI] [PubMed] [Google Scholar]
- 21.Adams GR, Hather BM, Baldwin KM, Dudley GA. Skeletal muscle myosin heavy chain composition and resistance training. J Appl Physiol. 1993;74(2):911–915. doi: 10.1152/jappl.1993.74.2.911. [DOI] [PubMed] [Google Scholar]
- 22.Staron RS, Leonardi MJ, Karapondo DL, Malicky ES, Falkel JE, Hagerman FC, et al. Strength and skeletal muscle adaptations in heavy-resistance-trained women after detraining and retraining. J Appl Physiol. 1991;70(2):631–640. doi: 10.1152/jappl.1991.70.2.631. [DOI] [PubMed] [Google Scholar]
- 23.Fitts RH. Effects of regular exercise training on skeletal muscle contractile function. Am J Phys Med Rehabil. 2003;82(4):320–331. doi: 10.1097/01.PHM.0000059336.40487.9C. [DOI] [PubMed] [Google Scholar]
- 24.Byron CD, Hamrick MW, Wingard CJ. Alterations of temporalis muscle contractile force and histological content from the myostatin and Mdx deficient mouse. Arch Oral Biol. 2006;51(5):396–405. doi: 10.1016/j.archoralbio.2005.09.006. [DOI] [PubMed] [Google Scholar]
- 25.Elashry MI, Otto A, Matsakas A, El-Morsy SE, Patel K. Morphology and myofiber composition of skeletal musculature of the forelimb in young and aged wild type and myostatin null mice. Rejuvenation Res. 2009;12(4):269–281. doi: 10.1089/rej.2009.0870. [DOI] [PubMed] [Google Scholar]
- 26.Rehfeldt C, Ott G, Gerrard DE, Varga L, Schlote W, Williams JL, et al. Effects of the compact mutant myostatin allele Mstn (Cmpt-dl1Abc) introgressed into a high growth mouse line on skeletal muscle cellularity. J Muscle Res Cell Motil. 2005;26(2-3):103–112. doi: 10.1007/s10974-005-1099-7. [DOI] [PubMed] [Google Scholar]
- 27.Saltin B, Kiens B, Savard G, Pedersen PK. Role of hemoglobin and capillarization for oxygen delivery and extraction in muscular exercise. Acta Physiol Scand Suppl. 1986;556:21–32. [PubMed] [Google Scholar]
- 28.Lieber RL, Friden J. Selective damage of fast glycolytic muscle fibres with eccentric contraction of the rabbit tibialis anterior. Acta Physiol Scand. 1988;133(4):587–588. doi: 10.1111/j.1748-1716.1988.tb08446.x. [DOI] [PubMed] [Google Scholar]
- 29.Webster C, Silberstein L, Hays AP, Blau HM. Fast muscle fibers are preferentially affected in Duchenne muscular dystrophy. Cell. 1988;52(4):503–513. doi: 10.1016/0092-8674(88)90463-1. [DOI] [PubMed] [Google Scholar]
- 30.Lynch GS, Rafael JA, Chamberlain JS, Faulkner JA. Contraction-induced injury to single permeabilized muscle fibers from mdx, transgenic mdx, and control mice. Am J Physiol Cell Physiol. 2000;279(4):C1290–1294. doi: 10.1152/ajpcell.2000.279.4.C1290. [DOI] [PubMed] [Google Scholar]
- 31.Zhao X, Weisleder N, Thornton A, Oppong Y, Campbell R, Ma J, et al. Compromised store-operated Ca2+ entry in aged skeletal muscle. Aging Cell. 2008;7(4):561–568. doi: 10.1111/j.1474-9726.2008.00408.x. [DOI] [PMC free article] [PubMed] [Google Scholar]
- 32.Gehrig SM, Koopman R, Naim T, Tjoakarfa C, Lynch GS. Making fast-twitch dystrophic muscles bigger protects them from contraction injury and attenuates the dystrophic pathology. Am J Pathol. 176(1):29–33. doi: 10.2353/ajpath.2010.090760. [DOI] [PMC free article] [PubMed] [Google Scholar]
- 33.Blake DJ, Weir A, Newey SE, Davies KE. Function and genetics of dystrophin and dystrophin-related proteins in muscle. Physiol Rev. 2002;82(2):291–329. doi: 10.1152/physrev.00028.2001. [DOI] [PubMed] [Google Scholar]
- 34.Enns DL, Tiidus PM. The influence of estrogen on skeletal muscle: sex matters. Sports Med. 40(1):41–58. doi: 10.2165/11319760-000000000-00000. [DOI] [PubMed] [Google Scholar]
- 35.Kendall B, Eston R. Exercise-induced muscle damage and the potential protective role of estrogen. Sports Med. 2002;32(2):103–123. doi: 10.2165/00007256-200232020-00003. [DOI] [PubMed] [Google Scholar]
- 36.Mosher DS, Quignon P, Bustamante CD, Sutter NB, Mellersh CS, Parker HG, et al. A mutation in the myostatin gene increases muscle mass and enhances racing performance in heterozygote dogs. PLoS Genet. 2007;3(5):e79. doi: 10.1371/journal.pgen.0030079. [DOI] [PMC free article] [PubMed] [Google Scholar]
- 37.Lee SJ. Sprinting without myostatin: a genetic determinant of athletic prowess. Trends Genet. 2007;23(10):475–477. doi: 10.1016/j.tig.2007.08.008. [DOI] [PubMed] [Google Scholar]