

Abstract
Background and Objectives
Gold nanoparticles (GNPs) such as gold nanoshells (GNSs) and gold nanorods (GNRs) have been explored in a number of in vitro and in vivo studies as imaging contrast and cancer therapy agents due to their highly desirable spectral and molecular properties. While the organ-level biodistribution of these particles has been reported previously, little is known about the cellular level or intra-organ biodistribution. The objective of this study was to demonstrate the use of intrinsic two-photon induced photoluminescence (TPIP) to study the cellular level biodistribution of GNPs.
Study Design/Materials and Methods
Tumor xenografts were created in twenty-seven male nude mice (Swiss nu/nu) using HCT 116 cells (CCL-247, ATCC, human colorectal cancer cell line). GNSs and GNRs were systemically injected 24 hr. prior to tumor harvesting. A skin flap with the tumor was excised and sectioned as 8 μm thick tissues for imaging GNPs under a custom-built multiphoton microscope. For multiplexed imaging, nuclei, cytoplasm, and blood vessels were demonstrated by hematoxylin and eosin (H&E) staining, YOYO-1 iodide staining and CD31-immunofluorescence staining.
Results
Distribution features of GNPs at the tumor site were determined from TPIP images. GNSs and GNRs had a heterogeneous distribution with higher accumulation at the tumor cortex than tumor core. GNPs were also observed in unique patterns surrounding the perivascular region. While most GNSs were confined at the distance of approximately 400 μm inside the tumor edge, GNRs were shown up to 1.5 mm penetration inside the edge.
Conclusions
We have demonstrated the use of TPIP imaging in a multiplexed fashion to image both GNPs and nuclei, cytoplasm, or vasculature simultaneously. We also confirmed that TPIP imaging enabled visualization of GNP distribution patterns within the tumor and other critical organs. These results suggest that direct luminescence-based imaging of metal nanoparticles holds a valuable and promising position in understanding the accumulation kinetics of GNPs. In addition, these techniques will be increasingly important as the use of these particles progress to human clinical trials where standard histopathology techniques are used to analyze their effects.
Keywords: gold nanoshell, gold nanorod, two-photon induced photoluminescence
INTRODUCTION
“Nanovectors” have gained interest as combined technologies to incorporate mechanisms for targeting, imaging, and therapy into a single agent [1]. Gold nanoparticles (GNPs) such as gold nanoshells (GNSs) and gold nanorods (GNRs) have been introduced as a new class of materials with unique optical and molecular properties suitable for combining these three components. GNSs consist of a dielectric silica core covered with a gold shell, whereby the core/shell ratio can tune the surface plasmon resonance (SPR) to the near-infrared (NIR) where light penetration in tissue is optimal [2–5]. For GNRs, rod-shaped gold nanoparticles, it has been shown that the various aspect ratios enable tunabilityin the NIR region [6–8].
Current applications of GNPs as therapeutic agents have focused on laser induced photothermal therapy. Due to their large optical absorption cross sections, these nanoparticles can absorb large amounts of energy when irradiated with a NIR laser, and that energy is quickly converted to heat. Thermal therapy applications of GNSs have been demonstrated in both in vitro cell culture and in vivo murine models [9]. GNSs were known to accumulate at the tumor site via the enhanced permeability and retention (EPR) effect [10], a common drug delivery mechanism used for macromolecules. GNSs in solution delivered intravenously will preferentially accumulate at the tumor site by extravasating through leaky neo-vasculature. Subsequent NIR irradiation of the tumor site leads to photothermal ablation and eventual tumor clearance. Several studies have demonstrated the efficiency of this treatment in murine survival studies [11,12]. For GNR application, in vitro selective photothermal therapy [13,14] and hyperthermic effects of GNRs on tumor cells [15,16] have been investigated.
GNPs have also been widely used as scattering- and absorption-based imaging contrast agents. For GNS’s imaging applications, dark field microscopy [17,18], optical coherence tomography [11], NIR diffuse optical tomography [19], diffuse optical spectroscopy [20] and narrow-band imaging system [21] have benefitted from GNS’s scattering and absorption properties. For GNR’s imaging applications, dark field microscopy [13], photoacoustic imaging [22] and confocal reflectance microscopy [23] have been exploited. While dark field microscopy provides a good tool for imaging cellular level distribution of GNPs in vitro, its utility is limited for imaging sectioned and bulk tissue. Direct luminescence-based imaging of metal nanoparticles provides high background rejection and signal-to-noise ratios enabling imaging relatively deep within tissue in addition to multiplexing of various tissue components. Our previous works demonstrated the feasibility of using two-photon induced photoluminescence (TPIP) for imaging three-dimensional biodistribution of GNSs targeted to murine tumors [24].
As clinical applications of GNPs for cancer imaging and therapy have gained interest, efforts for understanding the kinetics of their delivery and targeting to tumors has become more important. Several studies have reported organ-level biodistribution demonstrating primary accumulation within the tumor, liver, lung and spleen [25,26]. Although these studies have demonstrated the organ-level biodistribution of GNPs, there are still limited reports available for explaining their intra-organ biodistribution. Understanding of these particles’ distributions and biotransport at the intra-organ level will provide guidance for dosimetry in photothermal therapy and aid design of nanovectors for drug delivery, diagnostics and biomedical imaging. For example, distribution patterns that are homogeneous versus localized at the tumor cortex would affect selection of the appropriate laser dosimetry to reduce normal tissue damage and improve thermal therapy efficacy. Given the recent demonstrations of the intrinsic TPIP contrast of GNSs and GNRs, multiphoton microscope is an ideal tool for studying the microscopic distribution of the GNPs in whole tissue. In this study, we used intrinsic TPIP imaging to image the microscopic distribution of GNPs at the intra-organ level. We demonstrate multiplexed, three dimensional imaging with high resolution of GNPs with other critical tissue features such as nuclei and vasculature. These techniques are compatible with standard hematoxylin and eosin (H&E) staining and immunohistochemistry (IHC). To illustrate the utility of these techniques, we demonstrate the effect of GNP morphology on intra-tumoral biodistribution and GNP microdistribution differences between organs.
MATERIALS AND METHODS
Preparation of GNS and GNR
GNSs were synthesized using the seed-mediated method which was described in our previous study [24]. Briefly, the core of the particle (120 nm diameter) was made of colloidal silica which was aged for 2 weeks at 4 °C. Then, aminated silica particles were added to the gold colloid suspension resulting in a silica particle covered with gold colloid. For in vivo applications, a layer of 5,000 MW poly-(ethylene glycol) was added to the exterior shell through a thiol bond, and the particles were transferred to an iso-osmotic solution of 10 % trehalose. GNS solution was sterilized by passing through a 0.45 μm filter (12993, Pall Corporation). For all the samples we have tested with a total bioburden assay (aerobic and anaerobic, and sporeformers), the 0.45um filter has removed all bioburden. GNS’s average core diameter and thickness were found to be 120 nm and 15 nm, respectively, by TEM measurement, and their excitation peak was measured at 780 nm by a UV-Vis spectrophotometer. For the GNR study, we purchased sterile poly-(ethylene glycol)-coated GNRs from Nanopartz (30-PM-808), and we used them without further sterilization procedures. Their average transverse diameter is 10 nm, and longitudinal size is 41 nm with an extinction peak at 808 nm.
Animal Subjects and Cell Lines
A subcutaneous xenograft tumor model in nude mice inoculated with the HCT 116 cells (CCL-247, ATCC, human colorectal cancer cell line) was used for this study. HCT 116 was cultured in McCoy’s 5A Medium (30-2007, ATCC) with 10 % fetal bovine serum (30-2020, ATCC) and at 37 °C under 5 % CO2. When culture reached confluency, the cells were detached from the flask by 0.25 % trypsin-EDTA (30-2101, ATCC), centrifuged, and resuspended in sterile phosphate-buffered saline (PBS). Approximately 2 × 10⁶ cells/50 μl were subcutaneously injected into the right flank of the mice. When tumors grew to 0.8 to 1 cm in diameter, trehalose, GNSs, and GNRs were injected through the tail vein. After 24 hr. following injection, a skin flap with the tumor was excised for TPIP imaging.
Tumor xenografts were created in 27 male nude mice (Swiss nu/nu) consisting of three groups. Group 1 (n=7) served as the control and received 7 μl/g of trehalose solution, and Group 2 (n=10) received 7 μl/g of GNS solution standardized to an optical density of 100 at 780 nm (2.7 × 10⁸ NS/μl). Group 3 (n=10) received 7 μl/g of GNR solution with an optical density of 100 at 808 nm (5.8 × 10¹⁰ NR/μl).
Imaging Device
Measurements of TPIP from GNPs were performed using the custom-built NIR laser scanning multiphoton microscope described in our previous study [24]. As the TPIP excitation source, a femtosecond Ti:Sapphire laser (Mira 900 with excitation wavelength of 800 nm, Coherent Inc.) was used, and the laser beam was raster scanned along the sample using a pair of galvanometric scanning mirrors (6215HB, Cambridge Technology Inc.) to produce 2D images. TPIP from the GNPs was detected by two photomultiplier tubes (PMT) (H7422P-40, H7422P-50, Hammamtsu) through a dichroic beam splitter (FF735-Di01, Semrock). To separate the dye’s fluorescence from the GNP’s luminescence, band-pass filters (BPF) with center wavelength of 510 nm and 700 nm (HQ510-2p with bandwidth of 80 nm and HQ700-2p with bandwidth of 75 nm, Chroma Technology) were placed in the path of separate PMTs. As it is possible to damage GNP at high incident powers, we applied incident laser powers of 0.8 mW, which is well below the GNS damage threshold (1.5 mW) reported in our previous work [24] and that reported by others [23].
Staining Protocol
For better understanding of tumor-GNP targeting, it was essential to demonstrate surrounding cellular structures as well as GNP distribution; therefore, we stained cytoplasm, nuclei and blood vessels using hematoxylin and eosin (H&E), YOYO-1 iodide and fluorescein-conjugated antibody, respectively. For cytoplasm staining, we used standard H&E staining method which has been described elsewhere [27]. Paraffin blocks of 10 % buffered formalin-fixed tissues were cut into 8 μm thick slices. Following deparaffination and rehydration with xylene and ethanol, the sections were stained with H&E. For nuclei staining, we used YOYO-1 iodide (Y3601, Invitrogen) following the method of Tekola et al. [28]. To visualize microvessels in tumor slices, we performed immunofluorescence staining on the 8 μm thick frozen tissue slices. The slices were fixed in ice-cold acetone for 5 min. and then blocked with protein blocking solution (559148, BD Pharmigen) for 30 min. at room temperature. For binding a primary antibody, sections were incubated overnight at 4 °C with rat monoclonal anti-CD31 antibody (1:200 diluted in antibody diluent) (553370, BD Pharmingen) and washed with 0.1% Tween-20 in PBS (10 min. × 3). Then, slides were incubated with fluorescein-conjugated AffiniPure goat anti-rat IgG (1:100 diluted in antibody diluent) (76748, Jackson ImmunoResearch) for 1 hr. at room temperature and washed with 0.1% Tween-20 in PBS (10 min. × 3). After washing, the sections were covered with a coverslip following addition of an anti-fade fluorescence mounting medium.
RESULTS
Multiplexed Imaging
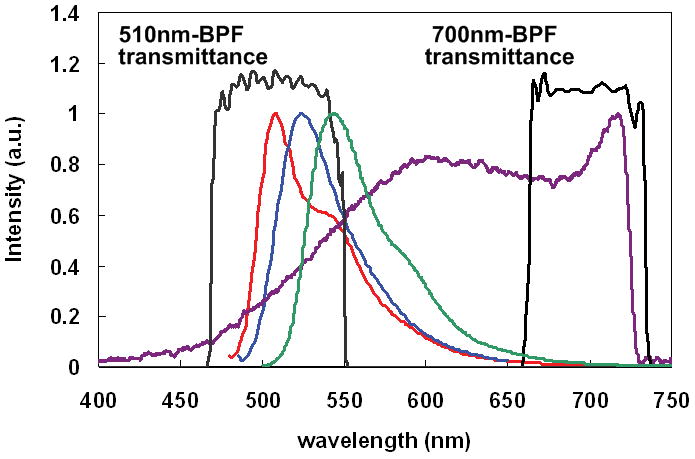
For multiplexed imaging, cytoplasm, nuclei and blood vessels were stained with eosin, YOYO-1 iodide and fluorescein-conjugated antibody. As those dyes’ fluorescence emission peaks were around 500–550 nm, these fluorescence signals and GNS luminescence were separated by two BPFs with center wavelength of 510 nm/bandwidth of 80 nm and 700 nm/bandwidth of 75 nm. Figure 1 shows emission spectra of YOYO-1 iodide, fluorescein-labeled dextran conjugate, Eosin Y, GNS TPIP emission spectrum and the BPFs’transmittance. In order to demonstrate both images collected through the filters simultaneously, the dyes’ fluorescence image and GNSs’ luminescence image were assigned to different channels and then co-registered. According to TPIP emission spectrum of GNRs measured by Wang et al. [29], we separated GNR luminescence in the same way. Note that the GNP luminescence is present in both channels while the dye luminescence is present in only the 510 nm channel. Figure 2(a) illustrates TPIP image of blood vessels measured through a 510 nm BPF, and Figure 2(b) shows GNS’s TPIP image collected through 700 nm BPF. These two images were assigned to different channels (i.e. blood vessels to red channel and GNS to green channel) and co-registered to demonstrate both on the same image shown in Figure 2(c). As GNS luminescence signals were detected from a 510 nm BPF (red channel) as well as a 700 nm BPF (green channel), GNS luminescence appeared yellow (green + red) in Figure 2(c). In the images throughout the remainder of this manuscript blood vessels appear red, GNSs and GNRs appear yellow, and cytoplasm or nuclei appear green.
Fig. 1.
Emission spectra of the dyes used in this study and GNS luminescence emission. ( : YOYO-1 idiode,
  : Fluorescein-dextran,
  : Eosin Y,
  : GNS luminescence, and
  : 510 and 700 nm band pass filter’s transmittance). Because these dyes’ fluorescence emission peaks were around 500–550 nm, these fluorescence signals and GNS luminescence were separated by two BPFs with center wavelength of 510 nm and 700 nm.
Fig. 2.
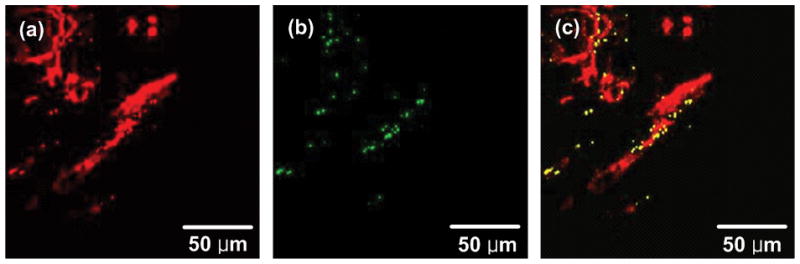
Co-registered TPIP images. (a) TPIP image of blood vessels measured through a 510 nm BPF. (b) TPIP image of GNSs measured via a 700 nm BPF. (c) Co-registered image of (a) and (b). Images measured through 510 nm and 700 nm BPFs were assigned to different channels (i.e. blood vessels to red channel and GNS to green channel) and co-registered to demonstrate both on the same image.
Luminescence Images of H&E-stained Tumor Slices
To demonstrate GNP distribution in thin tumor slices, we used H&E stained tumor slices which is commonly used for histopathological test. Figure 3 illustrates light microscopy images and TPIP images of H&E stained tumor slices derived from control tumor and GNS- and GNR-injected mice. Figure 3(a), (c) and (e) show cytoplasm stained with eosin as pink and nuclei stained with hematoxylin as dark blue within tumors. While light microscopy images did not show any GNPs in tissue slices, TPIP images in Figure 3 clearly visualized cytoplasm (green) and GNPs (yellow). In addition, we found that TPIP of GNS- and GNR-injected mice was visible in all mice of Group 2 and 3, whereas Group 1 did not yield luminescence signals. This result demonstrates that TPIP imaging can image GNPs in tissue slices processed for standard H&E staining.
Fig. 3.
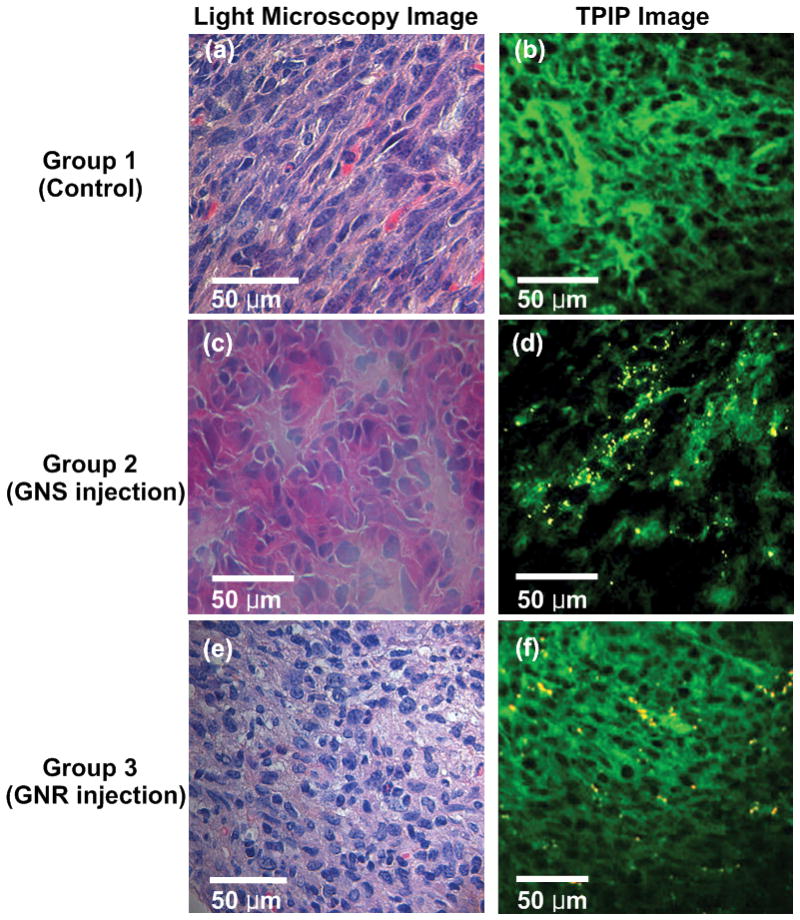
Light microscopy and TPIP images of tumor slices stained with hematoxylin and eosin. (a), (c), and (e) White light microscopy images of control tumor and GNS- and GNR-injected mice. (Pink: cytoplasm stained with eosin, Dark blue: nuclei stained with hematoxylin). (b), (d), and (f) TPIP images of Group 1, 2, and 3. (Green: cytoplasm stained with eosin, Yellow: GNSs and GNRs). While light microscopy images did not show any GNPs in tissue slices, TPIP images clearly visualized cytoplasm (green) and GNPs (yellow).
Luminescence Images of YOYO 1-iodide- and IHC-stained Tumor Slices
Luminescence images of control tumor
To demonstrate nuclei or blood vessels as well as GNP, we stained the tissue with YOYO-1 iodide or fluorescein-conjugated antibody. Figure 4(a) shows multiphoton microscopy images of YOYO-1 iodide stained slices derived from the control group (Group 1). GNP TPIP was not present in any of the seven mice in Group 1 which served as control and received trehalose only. Fluorescence from the fluorescein stained blood vessels was clearly shown in Figure 4(b) while GNP TPIP signals from the control tumor were not detected.
Fig. 4.
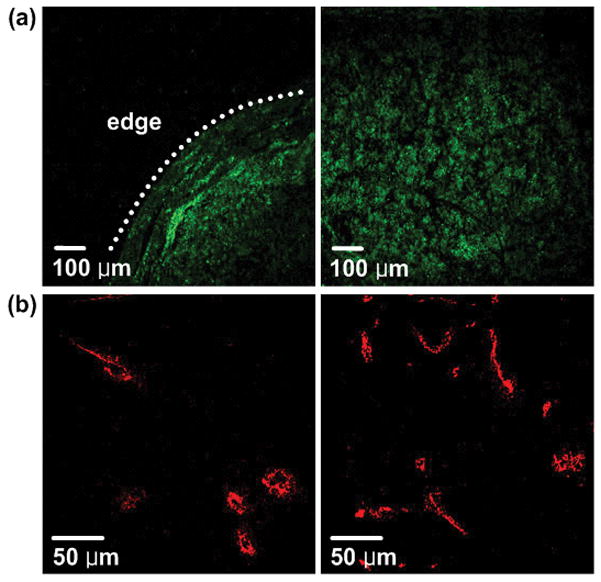
TPIP images of control tumor slices with nuclei staining (a) and blood vessel staining (b). (Green: nuclei, Red: blood vessels). GNP TPIP was not present in any of the seven mice in Group 1 which served as control and received trehalose only.
Luminescence images of GNS-injected mice
For further investigation of GNP-tumor targeting, we constructed high resolution images with an extended FOV using a motorized x-y scanning microscope stage and image mosaicing technique using MATLAB. Figure 5 shows TPIP images derived from Group 2. We collected 80–100 images with FOV of 900 μm × 900 μm using a 10x objective lens and combined them into one image to construct cross-sectional images of the whole tumor. Figure 5(a) and (b) show GNSs as yellow and nuclei as green, and (c) demonstrates the mosaic image providing clear visualization of peripheral accumulation of GNSs at the tumor site demarcated by nuclei staining. In Figure 5(b), we also observed that some GNSs appeared located close to the nuclei, which might indicate GNS’s internalization at 24 hr. post injection. For quantifying the concentration of GNSs at tumor cortex and tumor core, we added the areas of yellow dots where GNSs were detected at the tumor cortex (edge to 120 μm inside) or tumor core (whole tumor area except cortex) in Figure 5(c) and normalized those areas with tumor cortex or core region. In this way, we found that there were approximately 6 times more GNSs at the tumor cortex than core. This peripheral accumulation feature was found in six mice in Group 2. Because the remaining four mice had a very small number of GNSs, it was challenging to characterize GNS distribution features in those mice.
Fig. 5.
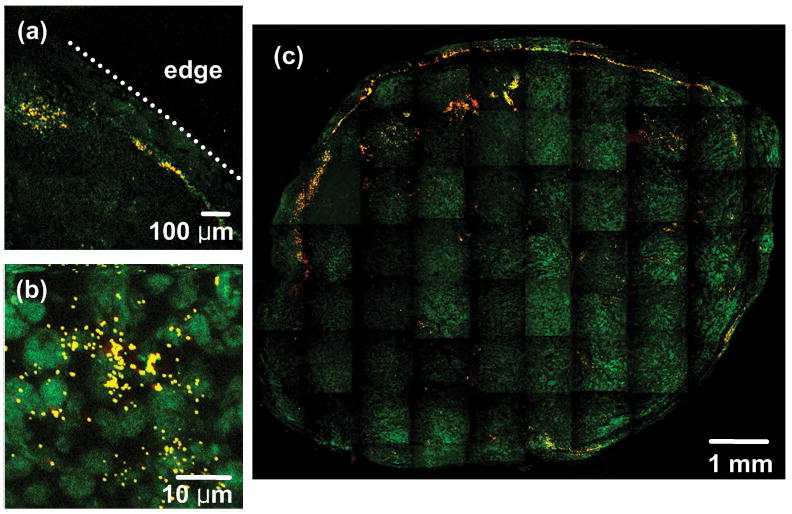
TPIP images of GNS-injected mice with nuclei staining (YOYO-1 iodide staining). (a), (b) TPIP images with FOV of 900 μm × 900 μm and 46 μm × 46 μm respectively. (c) Combined image with FOV of 9 mm × 7.5 mm. (Green: nuclei, Yellow: GNSs). Images provide clear visualization of peripheral accumulation of GNSs at the tumor site.
Perivascular accumulation of GNSs was demonstrated by IHC. Figure 6 shows TPIP images of GNS-injected mice. From the images, we found that GNSs accumulated at perivascular regions and short distance away from the vessels within the tumor.
Fig. 6.
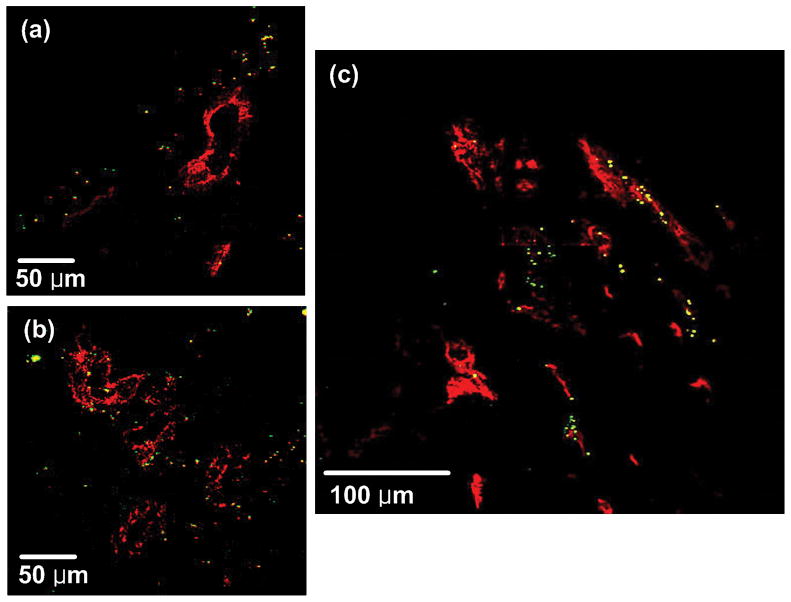
TPIP images of GNS-injected mice with blood vessel staining (CD31-immunofluorescence staining). (a), (b) TPIP images with FOV of 280 μm × 280 μm. (c) Combined image with FOV of 380 μm × 380 μm. (Red: blood vessels, Yellow: GNSs). GNSs accumulated at perivascular regions and short distance away from the vessels within the tumor.
Luminescence images of GNR-injected mice
To understand how nanoparticle’s morphology affects their intra-tumoral distribution, we imaged GNR distribution with Group 3 mice in the same way used for Group 2. Figure 7(a) represents tumor edge to approximately 0.4 mm inside the edge where GNRs had the same accumulation pattern as GNSs. However, some GNRs were also found even in the regions of 0.1 mm to 0.8 mm inside the edge as illustrated in Figure 7(b) while GNSs were limited in their accumulation to within 400 μm penetration inside the tumor. Four mice from Group 3 had further penetration of GNRs up to approximately 1.5 mm from the edge in the 8–10 mm diameter tumor, and we demonstrate this with CD31-immunofluorescence staining in Figure 8(b). These results indicate that GNSs have a 400 μm thick annular accumulation, whereas GNRs have a 1.5 mm thick annular pattern at the tumor cortex.
Fig. 7.
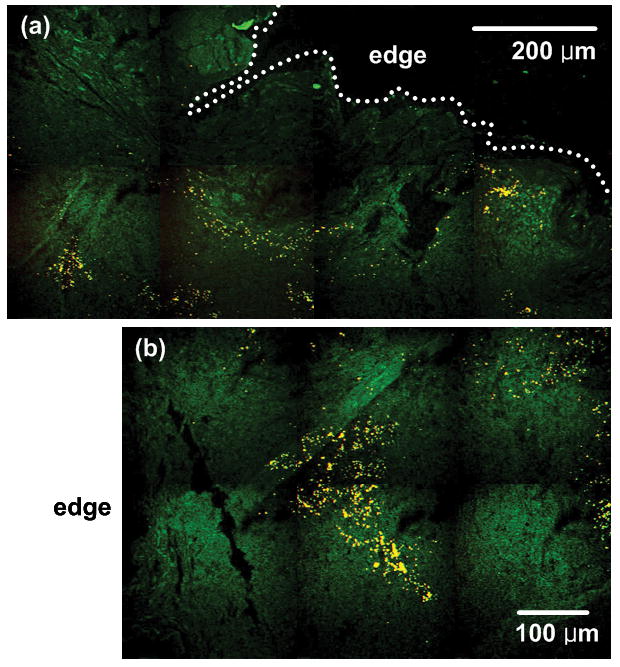
TPIP images of GNR-injected mice with nuclei staining (YOYO-1 iodide). (a) TPIP image with FOV of 1 mm × 510 μm. (b) TPIP image with FOV of 720 μm × 490 μm measured at the distance of approximately 100 μm inside the tumor edge. (Green: nuclei, Yellow: GNRs). GNRs have thicker annular accumulation at the tumor cortex than GNSs.
Fig. 8.
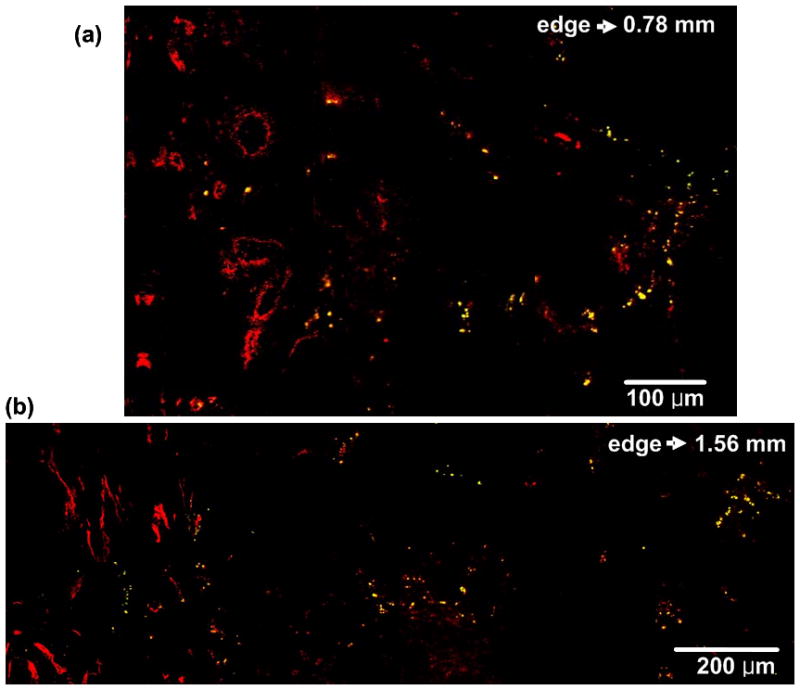
TPIP images of GNR-injected mice with blood vessel staining (CD31-immunofluorescence staining). (a) TPIP image with FOV of 790 μm × 520 μm. (b) TPIP image with FOV of 1.56 mm × 530 μm. (Red: blood vessels, Yellow: GNRs). Like GNS’s perivascular accumulation, GNRs were also observed in the perivascular region.
Like GNS’s perivascular accumulation shown in Figure 6, GNRs were also observed in the perivascular region. Figure 8(a) and (b) demonstrate TPIP images of blood vessels and GNRs measured at the tumor edge to 0.78 mm and 1.56 mm inside, respectively.
Luminescence Images of H&E-stained Liver and Spleen Slices
We observed the effect of GNP morphology on the microdistribution at the other primary organs where GNPs accumulate (i.e. liver and spleen). We imaged H&E stained liver and spleen slices explanted from Group 2 and Group 3. Livers and spleens were extracted with tumors at 24 hr. following GNP injection and stained in the same way used for tumor’s H&E staining. Figure 9(a), (c) and (e), (g) show standard light microscopy images, and Figure 9(b), (d), and (f), (h) demonstrate TPIP images of H&E stained liver and spleen, respectively. While TPIP images show GNPs clearly with high contrast, light microscopy images could not distinguish GNPs in the slices. Unlike intra-tumoral biodistribution of GNPs, any significant difference of GNP accumulation between organ’s edge and core was not found, and all GNPs were shown to be aggregated.
Fig. 9.
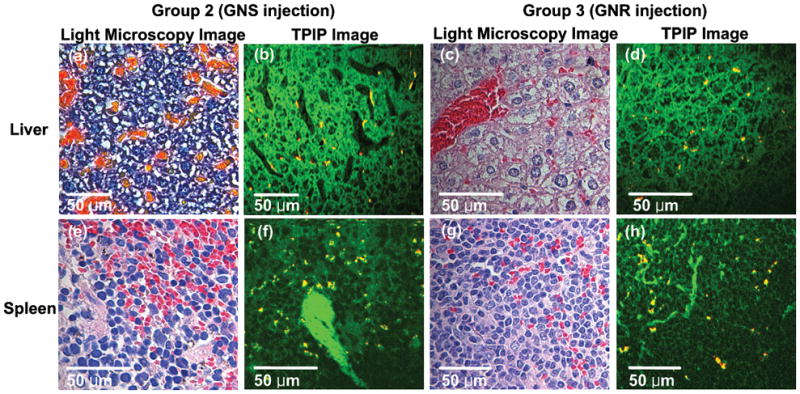
Light microscopy and TPIP images of liver and spleen slices stained with hematoxylin and eosin. (a) and (e) Light microscopy images of liver and spleen of GNS-injected mice. (c) and (g) Light microscopy images of GNR-injected mice. (Pink: cytoplasm stained with eosin, Dark blue: nuclei stained with hematoxylin). (b) and (f) TPIP images of liver and spleen of GNS-injected mice. (d) and (h) TPIP images of liver and spleen of GNR-injected mice. (Green: cytoplasm stained with eosin, Yellow: GNSs and GNRs). While TPIP images show GNPs clearly with high contrast, light microscopy images could not distinguish GNPs in the slices.
DISCUSSION
The recent finding that GNPs exhibit bright luminescence allows direct imaging of these particles within tissue. It has been demonstrated that strong NIR excited TPIP from a single GNR was 58 times brighter than a single rhodamine 6G molecule [30]. Our previous study showed that GNSs produced 140 times brighter signal than fluorescent beads, 100 nm diameter polystyrene beads covered with fluorescein molecules, with the same incident power [24]. This strong TPIP has been used to image molecularly targeted GNRs for cancer cells in vitro [31] and to image GNRs flowing in a mouse ear blood vessel in vivo [30,32]. It has also been used to demonstrate GNS’s microscopic distribution in bulk tissue ex vivo [24] and to image anti-HER2-conjugated GNSs in vitro [33]. In addition, the two-photon imaging is a powerful technique for the early diagnosis of epithelial cancers because it permits noninvasive imaging of sub-cellular features a few hundred micrometers deep into tissue [34–36]. Given these merits, TPIP imaging can be conceivable as a good candidate for investigation of GNP distribution.
We demonstrate in this study the feasibility of using intrinsic TPIP imaging to investigate GNP’s biodistribution in bulk tissue processed for standard H&E staining, YOYO 1-iodide staining, and IHC techniques. For complete evaluation of GNP accumulation clinically after GNP administration to humans, it is essential to perform a histopathological test, the gold standard for cancer diagnosis and staging providing precise geographic mapping of cellular- and tissue-level architecture. Therefore, in this study we examined the feasibility of using intrinsic TPIP imaging to demonstrate nanoparticle’s distribution in thin tissue slices. Tissue-level tumor and stromal cellular architecture as well as biodistribution of GNPs were well demonstrated in a multiplexed fashion using intrinsic TPIP while light microscopy images of these stained slices were not able to readily visualize GNPs. In addition, we showed how GNP’s morphology affects their biodistribution within organs. We did not notice any effects of photodamage visually in any of the tissue slides used in this study. We also did not observe signs of acute toxicity within the organ imaged, which is consistent with previous studies reporting the uptake and clearance of GNPs [25,26].
We found that GNSs and GNRs had a heterogeneous distribution with higher accumulation at the tumor cortex. However, GNRs have thicker annular accumulation at the tumor cortex than GNSs. We also found that GNSs and GNRs were observed in unique patterns close to vasculature. We believe these two dimensional TPIP images of the thin tissue slices adequately represents the GNP’s distribution patterns within the bulk tumor due to randomly selected orientation of the thin tissue slices and the consistency of the GNP’s distribution patterns of all tumor samples (7–10 mice/group) within a group. The peripheral and perivascular accumulation features of GNPs were coincident with our previous findings using bulk tumors [24]. Li et al. also observed the similar distribution patterns of GNSs using photoacoustic microscopy imaging [37]. They demonstrated extravasation and accumulation of GNSs within the tumor site and reported their heterogeneous and peripheral accumulation. Diagaradjane et al. showed GNS accumulation near the perivascular region using scanning electron microscopy images [38]. Whereas the EPR effect accounts for the bulk of the accumulation of GNPs within tumors, we were able to discern subtle differences in global and regional accumulation of GNPs that may be attributable to their size and shape. Since xenografted human tumors derive their blood supply from the mouse vasculature, larger vessels envelop the tumor periphery and smaller branches invade deeper into the tumor. GNPs penetrate tumors either via extravasation through fenestrations of vessels or by traveling through smaller terminal branches. The smaller GNRs extravasated further from the vasculature lumen into tumor parenchyma, possibly a reflection of the effect of size on tumor penetration. They were also entrapped more efficiently once they penetrated deeper into tumors through smaller vascular branches, possibly a reflection of greater entrapment due to non-uniform shape. Some turbulence at low velocities within small vessels or spaces might also lead to a greater chance of being confined.
It was also noticeable that some tumors (4 out of 10 mice for Group 2 and 3 out of 10 mice for Group 3) did not have significant numbers of nanoparticles to image. We attribute this to variability of the reticuloendothelial system (RES) activity and tumor aggressiveness. We have observed that some mice had more hair than others, which might reflect varying degrees of immunocompetence. It could suggest that some tumors may be more aggressive than others, which causes various levels of angiogenesis in each mouse. Since GNPs have been known to target tumor via EPR effect [10], different levels of angiogenesis might affect the numbers of particles accumulated at the tumor site. In addition, this variability of immunocompetence could induce varying degree of GNP’s clearance by RES. Particle clearance is related to the process of particle recognition and uptake. Opsonin, known as any substances (i.e. complement or antibodies) in blood serum facilitating phagocytosis, plays a pivotal role in the particle recognition process, and RES is responsible for particle uptake. Opsonin makes foreign particles (i.e. pathogen, quantum dot, carbon nanotube, gold nanoparticles, etc.) more recognizable to the RES by binding to the foreign particles in order to eliminate them from the circulation [39,40]. Therefore, we hypothesize that variability of immunocompetence could affect the amount of opsonins and activity of RES resulting in different level of GNP uptake into the organs (i.e. liver and spleen) of RES and accumulation at the tumor site.
Unlike intra-tumoral biodistribution of GNPs, we did not find any significant difference of GNP accumulation between the liver and spleen cortex and their core, and all GNPs in these organs appeared aggregated. It might be explained that GNPs are captured by Kupffer cells in the liver and macrophages in the spleen [32]. Kupffer cells of the liver and macrophages of the spleen are the primary components of the RES which are responsible for particle clearance. In addition, it has been known that Kupffer cells mostly contribute to hepatic uptake of particulates [41,42]. Therefore, we can expect to see entrapped GNSs and GNRs by Kupffer cells and macrophages in the TPIP images of the liver and spleen.
From this study, we found that direct luminescence-based imaging of GNPs can hold a valuable and promising position in understanding their accumulation kinetics and distribution of GNPs at the intra-organ level. We anticipate that the techniques demonstrated in the current study could extend the longitudinal in vitro studies [43,44] to an in vivo setting whereby one could understand the targeting kinetics (i.e. cell internalization, particle transport and cell specific targeting) in a more realistic solid tumor environment. In turn, this information will be valuable to develop models for generating thermal dosimetry of GNPs in therapeutic settings. In addition, these techniques will be increasingly important as the use of these particles progress to human clinical trials where standard histopathology techniques are used to analyze their effects.
Acknowledgments
This study was funded in part by research grants from the American Society Laser Medicine & Surgery and the National Institutes of Health (R01 CA132032).
References
- 1.Ferrari M. Cancer nanotechnology: Opportunities and challenges. Nat Rev Cancer. 2005;5(3):161–171. doi: 10.1038/nrc1566. [DOI] [PubMed] [Google Scholar]
- 2.Averitt RD, Sarkar D, Halas NJ. Plasmon resonance shifts of Au-coated Au2S nanoshells: Insight into multicomponent nanoparticle growth. Phys Rev Lett. 1997;78(22):4217–4220. [Google Scholar]
- 3.Oldenburg SJ, Averitt RD, Westcott SL, Halas NJ. Nanoengineering of optical resonances. Chem Phys Lett. 1998;288(2–4):243–247. [Google Scholar]
- 4.Oldenburg SJ, Hale GD, Jackson JB, Halas NJ. Light scattering from dipole and quadrupole nanoshell antennas. Appl Phys Lett. 1999;75(8):1063–1065. [Google Scholar]
- 5.Prodan E, Nordlander P. Structural tunability of the plasmon resonances in metallic nanoshells. Nano Lett. 2003;3(4):543–547. [Google Scholar]
- 6.Kelly KL, Coronado E, Zhao LL, Schatz GC. The optical properties of metal nanoparticles: The influence of size, shape, and dielectric environment. J Phys Chem B. 2003;107(3):668–677. [Google Scholar]
- 7.Link S, El-Sayed MA. Spectral properties and relaxation dynamics of surface plasmon electronic oscillations in gold and silver nanodots and nanorods. J Phys Chem B. 1999;103(40):8410–8426. [Google Scholar]
- 8.Murphy CJ, San TK, Gole AM, Orendorff CJ, Gao JX, Gou L, Hunyadi SE, Li T. Anisotropic metal nanoparticles: Synthesis, assembly, and optical applications. J Phys Chem B. 2005;109(29):13857–13870. doi: 10.1021/jp0516846. [DOI] [PubMed] [Google Scholar]
- 9.Hirsch LR, Stafford RJ, Bankson JA, Sershen SR, Rivera B, Price RE, Hazle JD, Halas NJ, West JL. Nanoshell-mediated near-infrared thermal therapy of tumors under magnetic resonance guidance. P Natl Acad Sci USA. 2003;100(23):13549–13554. doi: 10.1073/pnas.2232479100. [DOI] [PMC free article] [PubMed] [Google Scholar]
- 10.Maeda H, Fang J, Inutsuka T, Kitamoto Y. Vascular permeability enhancement in solid tumor: various factors, mechanisms involved and its implications. Int Immunopharmacol. 2003;3(3):319–328. doi: 10.1016/S1567-5769(02)00271-0. [DOI] [PubMed] [Google Scholar]
- 11.Gobin AM, Lee MH, Halas NJ, James WD, Drezek RA, West JL. Near-infrared resonant nanoshells for combined optical imaging and photothermal cancer therapy. Nano Lett. 2007;7(7):1929–1934. doi: 10.1021/nl070610y. [DOI] [PubMed] [Google Scholar]
- 12.O’Neal DP, Hirsch LR, Halas NJ, Payne JD, West JL. Photo-thermal tumor ablation in mice using near infrared-absorbing nanoparticles. Cancer Lett. 2004;209(2):171–176. doi: 10.1016/j.canlet.2004.02.004. [DOI] [PubMed] [Google Scholar]
- 13.Huang XH, El-Sayed IH, Qian W, El-Sayed MA. Cancer cell imaging and photothermal therapy in the near- infrared region by using gold nanorods. J Am Chem Soc. 2006;128(6):2115–2120. doi: 10.1021/ja057254a. [DOI] [PubMed] [Google Scholar]
- 14.Huang XH, Jain PK, El-Sayed IH, El-Sayed MA. Determination of the minimum temperature required for selective photothermal destruction of cancer cells with the use of immunotargeted gold nanoparticles. Photochem Photobiol. 2006;82(2):412–417. doi: 10.1562/2005-12-14-RA-754. [DOI] [PubMed] [Google Scholar]
- 15.El-Sayed IH, Huang XH, El-Sayed MA. Selective laser photo-thermal therapy of epithelial carcinoma using anti-EGFR antibody conjugated gold nanoparticles. Cancer Lett. 2006;239(1):129–135. doi: 10.1016/j.canlet.2005.07.035. [DOI] [PubMed] [Google Scholar]
- 16.Huff TB, Tong L, Zhao Y, Hansen MN, Cheng JX, Wei A. Hyperthermic effects of gold nanorods on tumor cells. Nanomedicine-Uk. 2007;2(1):125–132. doi: 10.2217/17435889.2.1.125. [DOI] [PMC free article] [PubMed] [Google Scholar]
- 17.Loo C, Hirsch L, Lee MH, Chang E, West J, Halas N, Drezek R. Gold nanoshell bioconjugates for molecular imaging in living cells. Opt Lett. 2005;30(9):1012–1014. doi: 10.1364/ol.30.001012. [DOI] [PubMed] [Google Scholar]
- 18.Loo C, Lin A, Hirsch L, Lee MH, Barton J, Halas N, West J, Drezek R. Nanoshell-enabled photonics-based imaging and therapy of cancer. Technol Cancer Res T. 2004;3(1):33–40. doi: 10.1177/153303460400300104. [DOI] [PubMed] [Google Scholar]
- 19.Wu CF, Liang XP, Jiang HB. Metal nanoshells as a contrast agent in near-infrared diffuse optical tomography. Opt Commun. 2005;253(1–3):214–221. [Google Scholar]
- 20.Zaman R, Diagaradjane P, Wang J, Schwartz J, Rajaram N, Gill-Sharp K, Cho S, Rylander H, Payne J, Krishnan S. In vivo detection of gold nanoshells in tumors using diffuse optical spectroscopy. Ieee J Sel Top Quant. 2007;13(6):1715. doi: 10.1109/jstqe.2007.910804. [DOI] [PMC free article] [PubMed] [Google Scholar]
- 21.Puvanakrishnan P, Park J, Diagaradjane P, Schwartz JA, Coleman CL, Gill-Sharp KL, Sang KL, Payne JD, Krishnan S, Tunnell JW. Near-infrared narrow-band imaging of gold/silica nanoshells in tumors. J Biomed Opt. 2009;14(2):024044. doi: 10.1117/1.3120494. [DOI] [PMC free article] [PubMed] [Google Scholar]
- 22.Eghtedari M, Oraevsky A, Copland JA, Kotov NA, Conjusteau A, Motamedi M. High sensitivity of in vivo detection of gold nanorods using a laser optoacoustic imaging system. Nano Lett. 2007;7(7):1914–1918. doi: 10.1021/nl070557d. [DOI] [PubMed] [Google Scholar]
- 23.Zhou Y, Wu X, Wang T, Ming T, Wang PN, Zhou LW, Chen JY. A comparison study of detecting gold nanorods in living cells with confocal reflectance microscopy and two-photon fluorescence microscopy. Journal of Microscopy-Oxford. 2010;237(2):200–207. doi: 10.1111/j.1365-2818.2009.03324.x. [DOI] [PubMed] [Google Scholar]
- 24.Park J, Estrada A, Sharp K, Sang K, Schwartz JA, Smith DK, Coleman C, Payne JD, Korgel BA, Dunn AK, Tunnell JW. Two-photon-induced photoluminescence imaging of tumors using near-infrared excited gold nanoshells. Opt Express. 2008;16(3):1590–1599. doi: 10.1364/oe.16.001590. [DOI] [PubMed] [Google Scholar]
- 25.James WD, Hirsch LR, West JL, O’Neal PD, Payne JD. Application of INAA to the build-up and clearance of gold nanoshells in clinical studies in mice. J Radioanal Nucl Ch. 2007;271(2):455–459. [Google Scholar]
- 26.von Maltzahn G, Park JH, Agrawal A, Bandaru NK, Das SK, Sailor MJ, Bhatia SN. Computationally Guided Photothermal Tumor Therapy Using Long-Circulating Gold Nanorod Antennas. Cancer Res. 2009;69(9):3892–3900. doi: 10.1158/0008-5472.CAN-08-4242. [DOI] [PMC free article] [PubMed] [Google Scholar]
- 27.Spector D, Goldman R. Basic methods in microscopy: protocols and concepts from cells: a laboratory manual: Cold Spring Harbor. New York: Cold Spring Harbor Laboratory Pr; 2006. pp. 113–118. [Google Scholar]
- 28.Tekola P, Baak JPA, Belien JAM, Brugghe J. Highly Sensitive, Specific, and Stable New Fluorescent DNA Stains for Confocal Laser Microscopy and Image-Processing of Normal Paraffin Sections. Cytometry. 1994;17(3):191–195. doi: 10.1002/cyto.990170302. [DOI] [PubMed] [Google Scholar]
- 29.Wang DS, Hsu FY, Lin CW. Surface plasmon effects on two photon luminescence of gold nanorods. Opt Express. 2009;17(14):11350–11359. doi: 10.1364/oe.17.011350. [DOI] [PubMed] [Google Scholar]
- 30.Wang HF, Huff TB, Zweifel DA, He W, Low PS, Wei A, Cheng JX. In vitro and in vivo two-photon luminescence imaging of single gold nanorods. P Natl Acad Sci USA. 2005;102(44):15752–15756. doi: 10.1073/pnas.0504892102. [DOI] [PMC free article] [PubMed] [Google Scholar]
- 31.Durr NJ, Larson T, Smith DK, Korgel BA, Sokolov K, Ben-Yakar A. Two-photon luminescence imaging of cancer cells using molecularly targeted gold nanorods. Nano Lett. 2007;7(4):941–945. doi: 10.1021/nl062962v. [DOI] [PMC free article] [PubMed] [Google Scholar]
- 32.Tong L, He W, Zhang YS, Zheng W, Cheng JX. Visualizing Systemic Clearance and Cellular Level Biodistribution of Gold Nanorods by Intrinsic Two-Photon Luminescence. Langmuir. 2009;25(21):12454–12459. doi: 10.1021/la902992w. [DOI] [PMC free article] [PubMed] [Google Scholar]
- 33.Bickford L, Sun J, Fu K, Lewinski N, Nammalvar V, Chang J, Drezek R. Enhanced multi-spectral imaging of live breast cancer cells using immunotargeted gold nanoshells and two-photon excitation microscopy. Nanotechnology. 2008;19:315102. doi: 10.1088/0957-4484/19/31/315102. [DOI] [PubMed] [Google Scholar]
- 34.Konig K, Riemann I. High-resolution multiphoton tomography of human skin with subcellular spatial resolution and picosecond time resolution. J Biomed Opt. 2003;8(3):432–439. doi: 10.1117/1.1577349. [DOI] [PubMed] [Google Scholar]
- 35.Masters BR, So PT, Gratton E. Multiphoton excitation microscopy of in vivo human skin. Functional and morphological optical biopsy based on three-dimensional imaging, lifetime measurements and fluorescence spectroscopy. Ann N Y Acad Sci. 1998;838:58–67. doi: 10.1111/j.1749-6632.1998.tb08187.x. [DOI] [PubMed] [Google Scholar]
- 36.Zipfel WR, Williams RM, Christie R, Nikitin AY, Hyman BT, Webb WW. Live tissue intrinsic emission microscopy using multiphoton-excited native fluorescence and second harmonic generation. P Natl Acad Sci USA. 2003;100(12):7075–7080. doi: 10.1073/pnas.0832308100. [DOI] [PMC free article] [PubMed] [Google Scholar]
- 37.Li M, Wang J, Schwartz J, Gill-Sharp K, Stoica G, Wang L. In-vivo photoacoustic microscopy of nanoshell extravasation from solid tumor vasculature. J Biomed Opt. 2009;14:010507. doi: 10.1117/1.3081556. [DOI] [PMC free article] [PubMed] [Google Scholar]
- 38.Diagaradjane P, Shetty A, Wang JC, Elliott AM, Schwartz J, Shentu S, Park HC, Deorukhkar A, Stafford RJ, Cho SH, Tunnell JW, Hazle JD, Krishnan S. Modulation of in vivo tumor radiation response via gold nanoshell-mediated vascular-focused hyperthermia: Characterizing an integrated antihypoxic and localized vascular disrupting targeting strategy. Nano Lett. 2008;8(5):1492–1500. doi: 10.1021/nl080496z. [DOI] [PMC free article] [PubMed] [Google Scholar]
- 39.Frank MM, Fries LF. The Role of Complement in Inflammation and Phagocytosis. Immunology Today. 1991;12(9):322–326. doi: 10.1016/0167-5699(91)90009-I. [DOI] [PubMed] [Google Scholar]
- 40.Owens DE, Peppas NA. Opsonization, biodistribution, and pharmacokinetics of polymeric nanoparticles. International Journal of Pharmaceutics. 2006;307(1):93–102. doi: 10.1016/j.ijpharm.2005.10.010. [DOI] [PubMed] [Google Scholar]
- 41.Schreier H. Drug targeting technology: physical, chemical, biological methods: Informa Healthcare. New York: Marcel Dekker, Inc; 2001. pp. 190–194. [Google Scholar]
- 42.Storm G, Belliot S, Daemen T, Lasic D. Surface modification of nanoparticles to oppose uptake by the mononuclear phagocyte system. Advanced Drug Delivery Reviews. 1995;17(1):31–48. [Google Scholar]
- 43.Chithrani BD, Ghazani AA, Chan WCW. Determining the size and shape dependence of gold nanoparticle uptake into mammalian cells. Nano Lett. 2006;6(4):662–668. doi: 10.1021/nl052396o. [DOI] [PubMed] [Google Scholar]
- 44.Wang CC, Lee CW, Huang CY, Lin JY, Wei PK, Lee CH. Observation of nanoparticle internalization on cellular membranes by using noninterferometric widefield optical profilometry. Applied Optics. 2008;47(13):2458–2464. doi: 10.1364/ao.47.002458. [DOI] [PubMed] [Google Scholar]