

Abstract
Rationale and Objectives
Firefly luciferase (Fluc) reporter gene is an authentic marker for surviving stem cells. However, it is unable to visualize the intramyocardial delivery of stem cells, nor their impact on cardiac function. We demonstrated that bioluminescence (BLI) combined with MR imaging (MRI) allowed better assessment of cell delivery and the impact on post myocardial infarction (MI) remodeling.
Materials and Methods
Murine embryonic stem cells (3 x 10⁵) were double-labeled with Fluc and superparamagnetic iron oxide (SPIO) particles and injected into the infarct border zone of athymic rat hearts. BLI and MRI were performed serially up to 2 months post-injection followed by immunohistochemistry.
Results
The dual-modality imaging was able to verify the initial intramyocardial delivery of the cells and their survival status. Over time, BLI signal increased in 7 out of 9 hearts while it disappeared in the other two hearts. The divergence of BLI signal over time was supported by MRI findings. Left ventricular ejection fraction and fractional shortening estimated by MRI suggested that cell engraftment mediated a positive impact on post-MI remodeling. Two months after intramyocardial injection, SPIO-associated signals facilitated the localization of the injection site.
Conclusions
The dual-modality imaging has unique strength to monitor cell delivery, survival status, graft morphology, and impact on post-MI remodeling.
Keywords: myocardial infarction, embryonic stem cells, firefly luciferase, superparamagnetic iron oxide, MR imaging, bioluminescence
Background
MRI-based tracking of stem cells grafted in the heart is especially challenging in rodent models. Cardiac and respiration motion introduce significant artifacts, particularly in the setting of their high heart rates. ECG-gated MRI has been successful in visualizing superparamagnetic iron oxide (SPIO) particle-labeled stem cells grafted in the myocardium of mouse and rat models (1–6). However, later studies revealed that SPIO/MRI method was insensitive to monitor cell survival over time (7–9). In comparison, approaches using reporter genes to “label” stem cells have shown advantages in tracking cell survival and proliferation in the heart (7, 9–13). Compared to other reporter genes, the firefly luciferase (Fluc) reporter combined with bioluminescence imaging (BLI) provides a sensitive, simple and inexpensive method for stem cell tracking in small animals. While highly sensitive, BLI is poor in resolving the signal in a tomographic fashion. In the past, BLI and MRI were examined for monitoring stem cell interventions in rodent models of myocardial infarction (MI) (7, 9). However, the unique strength in combining the two modalities to track the same population of stem cells over time has not been demonstrated.
To visualize the stem cells by both BLI and MRI, we employed a double labeling strategy in which Fluc-expressing murine embryonic stem cells (ESCs) were labeled with SPIO particles. Murine ESCs were rejected in immune competent allogeneic mice (14, 15). Therefore, immune deficient or syngenic animals must be used in order to achieve long term monitoring of ESC survival by BLI. The above consideration combined with our intention to generate a reperfused MI model led us to choose athymic nude rats, which are suitable for demonstrating the utility of dual modality imaging. Indeed, the MI model in nude rats has been employed to receive stem cells of human and mouse origin in many previous studies (11, 16–19).
Materials and Methods
ESCs stably expressing Fluc reporter gene and labeled with SPIO particles
Murine ESCs designated as R1 were kindly provided by Dr. A. Nagy’s Laboratory at Mount Sinai Hospital (Toronto, ON, Canada) and were maintained in an undifferentiated state on a feeder layer of murine embryonic fibroblasts and culture media as described previously (8, 12).
Fluc cDNA was cut from pGL3-fluc plasmid (Promega, Madison, WI) and was sequentially inserted into two multiple cloning sites of plasmid pVitro1 (Invivogen) by blunt-cohesive ligation. Both copies of Fluc gene were under the control of mouse/rat elongation factor 1 alpha (EF1α), which is capable of driving long-term expression in both differentiated or undifferentiated ESCs (12, 20). The pVitro-Fluc2 vector was linearized and transfected into R1 cells via electroporation. Transfected cells were cultured in the presence of G418 to select for neomycin resistant clones. A single clone which expressed the highest level of Fluc was expanded and designated as R1-Fluc.
R1 or R1-Fluc ESCs were incubated with labeling media containing 50 μg Fe/ml (Feridex®, Berlex Laboratories, Montville, NJ) and 0.4 μg/ml of poly-L-Lysine (PLL) (Sigma, St. Louis, MO) for 12–16 hours (overnight) in gelatin coated flasks; Intracellular iron content (picogram of iron per cell) was measured by inductive plasma mass spectroscopy (ICP-MS) and labeling efficiency was estimated by Prussian blue (PB) staining as described previously (8).
Surgical procedures to induce MI and intramyocardial injection of stem cells
The local Institutional Animal Care and Use Committee (IACUC) approved all animal procedures. Adult athymic rats (female, 150 g) purchased from Frederick Cancer Center (Frederick, MD) were subjected to surgical procedures of left anterior descending (LAD) coronary artery ligation for 45 min followed by reperfusion as previously described (21). At the end of the ligation period, 0.3 million (M) double-labeled ESCs suspended in 50 μl culture media without serum or culture media alone were injected in one spot into the border zone neighboring the pale (blanched) region. An insulin syringe with a 29-gauge needle that was bent 45° at 3-mm from the tip was used for injection; the needle tip penetrated about 1 mm into the epicardium to deliver the cells.
Experimental groups
Animals were divided into two groups: the ESC-treated group received 0.3M ESCs suspended in culture media while Control group received culture media only. A total of 34 rats were used in this study: 18 rats were excluded based on criteria listed in Table 1; the remaining 16 rats (n=9 in the ESC-treated and n=7 in control group) were included.
Table 1.
Reasons for exclusion and the final group size
| Total animals used | Death after surgery | Improper injection of cellsa | Infarct size<10% or >30% of LV mass | Final group size | |
|---|---|---|---|---|---|
| Control | 10 | 1 | not applicable | 2 | 7 |
| ESC-treated | 24 | 4 | 6 | 5 | 9 |
An improper injection of cells into the left ventricular lumen led to BL signal on the right thoracic abdominal region and an absence of hypointense MRI signal inside the myocardial wall.
In vivo bioluminescence imaging (BLI) and MRI
Imaging schedule
BLI and MRI were performed on day 1 (D1), D7 (BLI only), and week 4 (W4) post surgery in all animals. At 2-month, BLI was performed on 4 animals in ESC-treated group.
BLI
The rat was anesthetized with 66/6.6 mg/kg ketamine/acepromazine. Immediately prior to imaging, D-luciferin (Biotium, Hayward, CA) 50 mg/mL dissolved in saline was injected intravenously at a dose of 100 mg/kg body weight (22). Immediately after injection of luciferin, a series of bioluminescent images (IVIS13077 System, Xenogen, Alameda, CA) were acquired (4 min per image) for about 30 min, at which time, the luciferin had been washed out of tissue. BLI parameters include a 20 cm field of view (FOV), 4 min exposure, 16 binning, and f1/stop of 1. From the series, the image with peak BLI intensity was used for quantification.
MRI was performed on a 4.7T horizontal bore magnet (Magnex Scientific, Walnut Creek, CA) interfaced with a 12-cm ID gradient insert (gradient strength of 20 Gauss/cm) and with an INOVA console (Varian, Palo Alto, CA). A TEM volume transmitting coil (ID of 70 mm) and a surface receiving coil (curve arc corresponding to 120 degree of a full circle of 15-mm diameter) (InsightMRI, Worcester, MA) were used. ECG, respiration and core temperature were monitored by an MR compatible system (SA Instruments, Stony Brook, NY). Core temperature was maintained at 37 ± 0.2°C by a heating system that directed warm air to the animal when the core temperature is lower than 37°C. Fourteen cardiac phases were acquired for each cine series with 4 averages, which took 2–2.5 min, depending on heart rate. A typical field of view (FOV) of 6 x 3 cm2 with a matrix size of 256 x 128 was used with 1 mm slice thickness. To assess left ventricular (LV) global function, fractional shortening (FS) and SPIO-associated hypo-enhancement, a T2*-weighted fast gradient echo based sequence (23) with a 20° flip angle, 3 ms TE (to minimize cardiac motion) and effective TR equal to one heart beat was used to acquire short axis cine images under ECG and respiration gating. The same sequence was set up for T1-weighting with a 60° flip angle and minimum TE to acquire delayed hyperenhancement (DHE) cine images (24, 25) at 15–20 minutes after intravenous injection of 0.3 mmole/kg gadodiamide (Nycomed, Princeton, NJ). To avoid interference from Gd-mediated T1 shortening, SPIO-hypoenhanced images were acquired before gadodiamide injection. While the initial infarct size was measured by DHE MRI at D1, the final infarct size was estimated by histology when the rat was euthanized.
Analyses of BL and MR images
The time course of BL signals (the total flux in photons/sec) was obtained by placing a region of interest (ROI) with fixed size on the left thoracic region of the animal.
MR images were analyzed to evaluate the following parameters. 1. The initial infarct size was estimated on DHE images acquired at D1. 2. LV global function and FS were derived from cine images at D1 and W4. 3. SPIO-associated hypointense volume and contrast were compared between D1 and W4 for the ESC-treated group.
MR images were analyzed by ImageJ (v1.38x, NIH, Bethesda, MD). Using protocols detailed previously (8), LV global function was obtained; infarct size was quantified as % of LV mass; only animals with an infarct size in the range of 10–30% were included (Table 1). FS values were derived from the % change of the myocardial wall thickness from end-diastole (ED) to end-systole (ES) at the anterior and posterior border of the infarct, as well as at the remote region (septum).
To measure the hypointense volume and contrast, the endo- and epicardial borders were first manually defined. A threshold value, obtained from the mean minus twice the standard deviation of the septum, was applied to the image. The hypointense region was defined as pixels within the myocardium wall having intensities below the threshold described above; the hypointense area was summed from multiple short axis images, and multiplied by slice thickness to derive the hypointense volume. The mean intensity determined from the hypointense and septum regions was used to calculate the contrast, which was defined as: (mean of septal region - mean of hypointense region)/mean of septal region.
Histological analysis to identify grafted cells, macrophages and cardiac differentiation
For 9 animals in ESC-treated group, 5 were euthanized at W4, and the remaining 4 euthanized at 2-month. Cryo-sections (10 μm thick) or paraffin sections (5 μm thick ) were obtained from base to apex of the LV under the guidance of MR images: for hearts in the non-graft subgroup (see below), the region corresponding to the hypointense spot on MR images was sectioned consecutively; the remaining LV was sectioned with 100 μm gap between adjacent sections; for hearts in the engraftment subgroup, the region containing the hypointense spot on MRI was sectioned with a 100 μm gap between adjacent sections; the remaining LV was sectioned with a 300 μm gap. The following 6 analyses were performed. 1. PB staining was used to visualize SPIO particles. 2. Grafted cells were identified by Fluc staining. Grafted cells which retained SPIOs were identified by PB & Fluc double staining. Sections were first incubated with the antibodies to Fluc (Promega, Madison, WI, catalog # G7451) in 1:50 dilution for 1 hour at room temperature followed by incubation with FITC conjugated rabbit anti-goat secondary antibody (Zymed, San Francisco, CA, catalog # A10529). PB staining was performed at last by incubating sections with Pearl’s reagent in dark for 30 minutes at room temperature. 3. To identify SPIO-containing host macrophages, a CD68 antibody (Millipore, Billerica, MA, catalog # MAB1435) specific to rat (i.e., host) macrophages but not reactive to murine tissues (8) was used for immunostaining; the section was double stained with PB. The percent of SPIO-containing host macrophages was estimated by counting doubly positive cells versus total PB positive cells on sections: 3 FOVs (using 60x magnification objective lens) per section x 3 sections per heart were analyzed, and the data was then pooled from 5 animals. 4. Scar tissue was identified by Masson’s trichrome (MT) staining. 5. Tissue from 3 germ layers was identified in the cardiac teratoma on H&E stained sections, and 6. cardiomyocytes inside the graft were visualized by staining for cardiac specific sarcomeric α-actinin (Sigma, St Louis, MO, catalog # A7811).
Statistics
Data was presented as mean (± standard deviation). Changes in global, regional function and end-diastolic myocardial wall thickness were compared between ESC-treated and control groups; changes in hypointense volume and contrast were compared between D1 and W4 in ESC-treated group. Two-tailed student t-test was performed to compare two groups, while one-way ANOVA test was used to compare multiple groups. A P value of less than 0.05 was considered to be statistically significant.
Results
Viability and labeling efficiency and iron content
The in vitro SPIO labeling protocol led to a labeling efficiency of 93±5% and cellular iron content of 5.2 ±0.7pg Fe per cell. Obtained from triplicate experiments, viability of R1 ESCs (unmodified) was 98 ±1%, R1-Fluc was 98 ±5%, 95 ±5% when R1 ESCs were labeled with SPIO, and, 97 ±2% when R1-Fluc were labeled with SPIO (i.e., double labeled). There was no statistical difference among groups (P>0.3).
Both MRI and BLI are necessary to confirm intramyocardial delivery and survival of stem cells
One day after injection of 0.3 million double labeled ESCs, the intramyocardial delivery of cells was confirmed by MRI: cells were visualized as dark spot (s) (yellow arrows) in Fig 1a–c. The infarct region was visualized by DHE and marked between two red lines. While the surgeon tried to inject cells in the border zone, which was neighboring the blanched (infarcted) region, the exact distributions of cells revealed by MRI was not always in agreement with the surgeon’s impression, e.g., cells were found at the center of the infarct zone (a), inside the infarct zone but close to the anterior border (b), or, inside the lateral border zone next to the infarct (c). Improper injection of cells into LV cavity (blood) led to positive BLI signal in the lung and/or organs in the abdomen, e.g., liver (Fig 1d). However, the lack of hypointense MR signal provided the unequivocal evidence that cells were not delivered inside the myocardial wall (Fig 1e). Animals of improper injection were excluded (Table 1). Overall, injection of cells into a rapidly beating heart was challenging even when the infarcted region was correctly visualized. It was also possible that the cells were moved after injection due to contraction of the heart. However, no migration of grafted cells was observed when comparing MR images of W4 with D1. The surviving status of grafted cells at D1 was confirmed by BLI (Fig 2a and d). Taking together, dual modality imaging performed at D1 confirmed the intramyocardial delivery, distribution of stem cells relative to the infarct zone, and their survival status.
Fig 1.
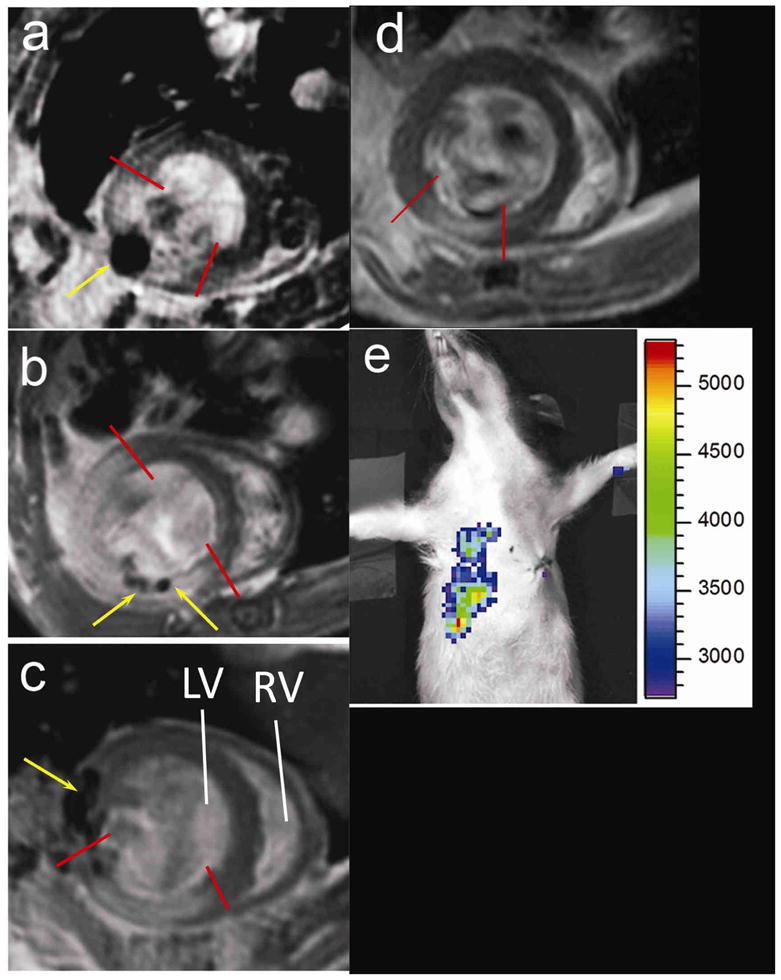
Distributions of grafted cells relative to infarct region revealed by MRI of ESC-treated group at day 1(a–c), and improper cell delivery revealed by BLI and MRI (d–e). One short axis slice is displayed for each heart. Infarcted region was marked between red lines. SPIO induced hypointense region was indicated by yellow arrows. MRI revealed the exact location of grafted cells: in the center of the infarct (a), inside the infarct region but close to anterior border (b), or, in the lateral border next to the infarct region (c). The heart shown in (a) was from the non-graft subgroup while hearts in (b–c) from the engraftment subgroup. Improper cell delivery led to BLI signal from thoracic region and right upper abdomen (d, color scale in photons/s) and an absence of hypointense MRI signal in the myocardial wall (e). LV, RV = left, right ventricle.
Fig 2.

Diverged time courses of BLI signal intensity in ESC-treated group. Bioluminescence images from a heart in the non-graft subgroup (a–c) and one in engraftment subgroup (d–f) at day 1, 7 and week 4. The color scales are different for images at D1, 7 and W4 representing an order of magnitude increase in BLI signal intensity. g: total flux (photons/s) quantified from the engraftment subgroup (n=7) and non–graft subgroup (n=2). The non-graft subgroup and two animals from the engraftment subgroup contributed to the last time point (2-month) on the curve. Error bars represent values of standard deviation, and, for clarity, only the positive or negative portion is shown.
Two outcomes from ESC-treated group revealed by imaging and confirmed by histology
Over time, the BLI signal diverged. In 2 out 9 rats, it fell below the detection threshold at D7 and remained undetectable until euthanized at 2-month (Fig 2b–c, g). In both rats, the cells were properly delivered and were surviving as confirmed by D1 imaging. In contrast, in the remaining 7 rats, the BLI signal increased substantially before reaching a plateau at W4 (Fig 2e–f, g). Note that images in Fig 2a–c were from the same rat so were Fig 2d–f. Corresponding to diverged BLI signals, changes in wall morphology were observed by MRI at W4 (Table 2): the LV wall thickness did not change in the 2 animals in which BLI disappeared, whereas the wall thickness increased significantly in the anterior, lateral and posterior quadrant in the 7 hearts in which BLI signal persisted. Based on these imaging results, the ESC-treated group was divided into 2 subgroups: (i) the engraftment subgroup (n=7) and (ii) the non-graft subgroup (n=2). Animals in the control group, however, showed a substantial thinning of the wall in the lateral quadrant, which corresponded to the infarct territory. In all ESC-treated animals, the SPIO-associated hypointense volume decreased from D1 to W4 (Fig 3a) while the contrast of the hypointense spot remained unchanged (Fig 3b), suggesting that SPIO-related MR signal cannot separate the two subgroups.
Table 2.
Myocardial wall thickness in ESC-treated and control group at W4a
| Wall thickness at W4 | Septal | Anterior | Lateral | Posterior | |
|---|---|---|---|---|---|
| ESC-treated | Non-graft (n=2) | 1.3 ±0.2 | 1.5 ±0.1 | 1.5 ±0.2 | 1.5 ±0.3 |
| Engraftment (n=7) | 1.3 ±0.1 | 1.7 ±0.2* | 2.2 ±0.9* | 1.6 ±0.2* | |
| Controls (n=7) | 1.3 ±0.1 | 1.4 ±0.2 | 1.2 ±0.3* | 1.2 ±0.1 | |
| Wall thickness at D1 (n=16)b | 1.4 ±0.2 | 1.4 ±0.3 | 1.5 ±0.2 | 1.3 ±0.3 | |
Three short axis slices (3 mm apart) with the middle slice at the mid-ventricular level were used. Diastolic wall thickness was measured in septal, anterior, lateral and posterior quadrant using a line connecting the centroid of the LV wall and the vertex of the epicardium border.
Wall thickness measured at D1 from ESC-treated (n=9) and control group (n=7) was combined for comparison with the wall thickness at W4.
P<0.05 compared to the corresponding quadrant at D1.
Fig 3. Changes of hypointense volume (a) and contrast (b) from D1 to W4 in ESC-treated hearts.

○ from hearts in engraftment subgroup (n=7). △: from hearts in non-graft subgroup (n=2). ●: average (n=9). a: P<0.05 when the average at W4 and D1was compared. b: No statistical difference between D1 and W4 for either group (P >0.4). Formula to calculate hypointense volume and contrast are found in the Material and Methods.
Histological analyses (Fig 4a–f) confirmed the distinct features revealed by imaging. For the 2 hearts in the non-graft subgroup, exhaustive histological analysis (H&E staining) throughout the heart did not reveal any evidence of teratoma. A small number of Fluc positive cells were observed (a), and were localized inside the infarcted region, which was identified by MT staining on the adjacent section (c). Fluc positive cells were not positive for cardiac specific α-actinin staining (data not shown) suggesting they did not undergo cardiac differentiation. The Fluc and PB double positive cells (arrows in a) accounted for 42 ± 16% of PB positive cells. Because the CD68 antibody did not cross-react with murine tissues (8), CD68 positive cells represented host macrophages rather than macrophages derived from injected ESCs (murine origin). SPIO-containing host macrophages accounted for 58 % of PB positive cell pool (red, arrows in b).
Fig 4.

Histological analyses of hearts from non-graft subgroup (a–c) and engraftment subgroup (d–g). Fluc (green) and PB (blue particles) double staining revealed a few double positive cells (arrows in a) in the heart but no substantial graft was formed. SPIO-containing macrophages were identified by CD68 (red) and PB double staining (arrows in b and e). Combination of PB and MT staining (c) revealed SPIO-containing cells in the scar tissue. The majority of cells inside the teratoma were Fluc positive but PB negative (d). The dashed line in (e) marks the boundary of a cardiac teratoma. a & b & c, and d & e were adjacent sections. H&E staining of the teratoma in which tissue from three germ layers was identified (f): squamous cells with keratin pearl originated from ectoderm (small arrow head), osteoid of mesoderm origin (large arrow head) and columnar gland of endoderm origin (arrow). Cardiomyocytes inside the teratoma were identified by striations positive for sarcomeric α-actinin (brown color in g). The images in d-g were obtained from hearts harvested 4 weeks after injection of cells. Scale bar =50 μm in all panels except for panel f.
In the engraftment subgroup, cardiac teratoma formation was confirmed in every heart by identifying tissue from all three germ layers (Fig 4f). As the result of cell proliferation or iron exocytosis, the majority of cells in the teratoma were Fluc positive but PB negative (Fig 4d). However, a large hypointense center containing SPIO-laden host macrophages was sometimes observed on MRI (e.g., Fig 5d). Among various cells in the teratoma, only 1.2 (±0.5)% were cardiomyocytes as identified by α-actinin (g) (estimated from 5 hearts) suggesting a low level of cardiac differentiation.
Fig 5. Fractional shortening of the myocardial wall of ESC-treated and control groups.

Panel a, b, and c represents a heart at D1from the engraftment, non-graft subgroup and control group, respectively; d, e and f are corresponding hearts at W4. The anterior (border1 or b1) and posterior (border2 or b2) borders of the infarct were defined on images as the following: at D1, b1 and 2 are placed at the boundary of the infarct defined on DHE images (a, b and c). At W4, boundaries of the graft were defined as b1 and 2 in the engraftment subgroup (d); borders defined in (b) were transferred to images of the corresponding location for the non-graft hearts (e); boundaries of the dyskinetic region identified on cine images were defined as b1 and 2 in the control hearts (f). Arrows point to the region where myocardial wall became thin. FS were measured from b1, b2 and septum (remote) on MR images at D1 and W4 (g). #: P<0.05 comparing to the septum (remote region) at D1. *: P<0.05 comparing D1 and W4. Statistical analysis was not applied in non-graft subgroup due to small size (n=2).
SPIO-related signal helps localizing to the injection site
SPIO-containing macrophages appeared to juxtapose with Fluc positive cells (Fig 4a–b) distributing inside or around the graft (Fig 4e). Both cell populations located in the vicinity of the injection site. Therefore, the hypointense MRI signal and PB staining can be used to localize the injection site 2-month after injection.
Global and regional cardiac function
By excluding animals with small (<10%) or large (>30%) initial infarct size, the average infarct size in the control (17.5 ±6.5 %, n=7) and ESC-treated group (15.1 ±3.6%, n=9) was not statistically different (P=0.4). The 2 rats in the non-graft subgroup had infarct size of 15.6 and 16.0%, respectively. The global function from this subgroup was pooled with the engraftment subgroup. A significant difference in EDV and ESV between the ESC-treated and control group was observed at W4 but not at D1 (Table 3). The LVEF of the ESC-treated group at W4 was not significantly greater than the control group (P=0.08) although it appeared to be so.
Table 3.
Global LV function at D1 and W4 in the ESC-treated and control groups
| Day1 | Week 4 | |||||
|---|---|---|---|---|---|---|
| EDV (μl) | ESV (μl) | LVEF | EDV (μl) | ESV (μl) | LVEF | |
| ESC-treated (n=9) | 232±61 | 72±50 | 69±13 | 276 ±55* | 66 ±34* | 76 ±11% |
| Control (n=7) | 227±69 | 89±26 | 62±11 | 412 ±111† | 181 ±105 | 59 ±18% |
EDV=end-diastolic volume, ESV= end- systolic volume, LVEF=left ventricular ejection fraction,
P<0.05 when compared with the control group at W4.
P<0.05 when compared with EDV at D1.
To calculate FS, the anterior (border1) and lateral border (border2) of infarct were defined on DHE images (Fig 5a–c). At D1 in ESC-treated engraftment subgroup as well as in control group, the FS at border1 was depressed compared to septum (#: P<0.05 in Fig 5g) whereas FS at border2 was not affected in either group. At W4 in the engraftment group, FS at border1 was increased significantly compared to D1 (*: P<0.05) while FS at border2 was maintained. In the control group, in contrast, FS at border1 remained depressed, and FS at border2 and even septum became severely depressed compared to D1 (*: P<0.05), an indication of diffusive disease resulted from unfavorable post-MI remodeling. While mean FS was presented for non-graft subgroup, no statistical test was performed due to small sample size.
Discussion
Our study showed that improper delivery of cells into the LV cavity (i.e., blood) was identified by MRI in 6 out of 24 injected animals (Table 1) despite a positive BLI signal. Hence dual-modality imaging was required to confirm proper delivery and survival status of the cells. In animals where intramyocardial delivery was obtained, both BLI (Fig 2g) and MRI (Fig. 3a) signal at D1 varied greatly among animals, consistent with previous reports that this delivery method led to a great variation in cell retention (26).
For the engraftment subgroup, the cell survival time course obtained by BLI (Fig 2g) showed a sharp increase from D1 to D7 followed by a moderate increase from D7 to W4 and a plateau from W4 to W8. This survival kinetics was not the same as what was reported in a previous study in which different numbers of ESCs were injected (1 or 5 million) (8). While 5 million cells were injected in the cited study, the PET signal from ESCs was not detectable at D1. In contrast, 0.3 million ESCs were readily detected by BLI at D1 in this study, suggesting a superior sensitivity of BLI modality.
Infiltration of host macrophages was triggered by the inflammatory response to acute MI and death of grafted cells. Previous study showed that the majority of ESCs (60%) died shortly after injection (12). The SPIO labels would be transferred to macrophages which absorbed the dead cells. The persistence of the SPIO-containing macrophages made it possible for localizing the injection site months after injection. First, the injection site was identified via the hypointense signal on MR images (each 1-mm thick). The tissue slab of a few millimeters thick containing the injection site was then subjected to PB staining. In non-graft hearts which contained neither fiducial marker for injection site nor readily recognizable cell mass (i.e. teratoma), the above procedures allowed us to localize the surviving ESCs (Fig 4a–b).
One outcome (n=7) from ESC-treated hearts revealed teratoma formation, suggesting that undifferentiated ESCs even administered at a relatively low dose (3x10⁵) posed a safety concern. The other outcome (n=2) revealed no teratoma, however, very few surviving cells were observed, and we were not able to produce more animals in the non-graft subgroup. These were limitations of the study. However, they did not diminish the unique strength of dual-modality approach, which correctly separated the two outcomes, and the imaging results were confirmed by histology.
ESC-mediated functional improvements suggest that the presence of grafted cells might reduce stiffness in the infarcted region (27), or, they might mediate a paracrine effect leading to reduction of apoptosis in host CMs during post-MI remodeling. While these findings are not directly applicable to the clinic, they underscored the importance of identifying a suitable type of stem cells, which cab provide these benefits but does not form teratoma. Compared to undifferentiated ESCs, grafting ESC-derived cardiomyocytes (ESC-CM) appeared safe in preclinical studies (16, 17, 28, 29). Hence, ESC-CM may represent a clinically relevant type of stem cell for treatment of myocardial infarction. The dual-modality imaging can be applied directly to evaluate ESC-CM mediated cardiac repair. While it is not feasible to perform BLI in humans, other reporter genes such as HSV1-tk (8, 11) and NIS (13), whose expression can be imaged in humans, have shown feasibility in monitoring cell survival in the heart of animal models.
In conclusion, this study demonstrated the utility of BLI and MRI dual-modality imaging in corroborating intra myocardial delivery and survival status of stem cells. By quantifying the initial infarct size non-invasively, a similar infarct size between ESC-treated and control group was obtained to allow a fair comparison of post-MI remodeling in the presence and absence of stem cell intervention.
Acknowledgments
Grant supports: The research was supported by NIH grants, R21EB-2473 and R01-HL081185, and was funded, in part, under a grant with the Pennsylvania Department of Health. The Department specifically disclaims responsibility for any analyses, interpretations, or conclusions.
Abbreviations
- BLI
bioluminescence imaging
- DHE
delayed hyperenhanced or hyper-enhancement (by MRI)
- ESC
embryonic stem cell
- Fluc
firefly luciferase
- FS
fractional shortening
- MI
myocardial infarct
- MRI
magnetic resonance imaging
- MT
Masson’s trichrome (staining)
- PB
Prussian blue (staining)
- SPIO
superparamagnetic iron oxide
Footnotes
Conflicts of Interests and Financial Disclosure Statements: None of the authors has conflicts of interest or financial disclosure.
Publisher's Disclaimer: This is a PDF file of an unedited manuscript that has been accepted for publication. As a service to our customers we are providing this early version of the manuscript. The manuscript will undergo copyediting, typesetting, and review of the resulting proof before it is published in its final citable form. Please note that during the production process errors may be discovered which could affect the content, and all legal disclaimers that apply to the journal pertain.
References
- 1.Cahill KS, Germain S, Byrne BJ, et al. Non-invasive analysis of myoblast transplants in rodent cardiac muscle. Int J Cardiovasc Imaging. 2004;20:593–598. doi: 10.1007/s10554-004-3902-8. [DOI] [PubMed] [Google Scholar]
- 2.Himes N, Min JY, Lee R, et al. In vivo MRI of embryonic stem cells in a mouse model of myocardial infarction. Magn Reson Med. 2004;52:1214–1219. doi: 10.1002/mrm.20220. [DOI] [PubMed] [Google Scholar]
- 3.Stuckey DJ, Carr CA, Martin-Rendon E, et al. Iron particles for noninvasive monitoring of bone marrow stromal cell engraftment into, and isolation of viable engrafted donor cells from, the heart. Stem Cells. 2006;24:1968–1975. doi: 10.1634/stemcells.2006-0074. [DOI] [PubMed] [Google Scholar]
- 4.Arai T, Kofidis T, Bulte JW, et al. Dual in vivo magnetic resonance evaluation of magnetically labeled mouse embryonic stem cells and cardiac function at 1.5 t. Magn Reson Med. 2006;55:203–209. doi: 10.1002/mrm.20702. [DOI] [PubMed] [Google Scholar]
- 5.Tallheden T, Nannmark U, Lorentzon M, et al. In vivo MR imaging of magnetically labeled human embryonic stem cells. Life Sci. 2006;79:999–1006. doi: 10.1016/j.lfs.2006.05.021. [DOI] [PubMed] [Google Scholar]
- 6.Ebert SN, Taylor DG, Nguyen HL, et al. Noninvasive tracking of cardiac embryonic stem cells in vivo using magnetic resonance imaging techniques. Stem Cells. 2007;25:2936–2944. doi: 10.1634/stemcells.2007-0216. [DOI] [PubMed] [Google Scholar]
- 7.Hung T-C, Suzuki Y, Urashima T, et al. Multimodality Evaluation of the Viability of Stem Cells Delivered Into Different Zones of Myocardial Infarction. Circ Cardiovasc Imaging. 2008;1:6–13. doi: 10.1161/CIRCIMAGING.108.767343. [DOI] [PubMed] [Google Scholar]
- 8.Qiao H, Zhang H, Zheng Y, et al. Embryonic Stem Cell Grafting in Normal and Infarcted Myocardium: Serial Assessment with MR Imaging and PET Dual Detection. Radiology. 2009;250:821–829. doi: 10.1148/radiol.2503080205. [DOI] [PMC free article] [PubMed] [Google Scholar]
- 9.Chen IY, Greve JM, Gheysens O, et al. Comparison of optical bioluminescence reporter gene and superparamagnetic iron oxide MR contrast agent as cell markers for noninvasive imaging of cardiac cell transplantation. Mol Imaging Biol. 2009;11:178–187. doi: 10.1007/s11307-008-0182-z. [DOI] [PMC free article] [PubMed] [Google Scholar]
- 10.Wu JC, Chen IY, Sundaresan G, et al. Molecular imaging of cardiac cell transplantation in living animals using optical bioluminescence and positron emission tomography. Circulation. 2003;108:1302–1305. doi: 10.1161/01.CIR.0000091252.20010.6E. [DOI] [PMC free article] [PubMed] [Google Scholar]
- 11.Cao F, Lin S, Xie X, et al. In vivo visualization of embryonic stem cell survival, proliferation, and migration after cardiac delivery. Circulation. 2006;113:1005–1014. doi: 10.1161/CIRCULATIONAHA.105.588954. [DOI] [PMC free article] [PubMed] [Google Scholar]
- 12.Qiao H, Surti S, Choi SR, et al. Death and proliferation time course of stem cells transplanted in the myocardium. Molecular Imaging and Biology. 2009;11:408–414. doi: 10.1007/s11307-009-0222-3. [DOI] [PMC free article] [PubMed] [Google Scholar]
- 13.Higuchi T, Anton M, Dumler K, et al. Combined Reporter Gene PET and Iron Oxide MRI for Monitoring Survival and Localization of Transplanted Cells in the Rat Heart. J Nucl Med. 2009;50:1088–1094. doi: 10.2967/jnumed.108.060665. [DOI] [PubMed] [Google Scholar]
- 14.Nussbaum J, Minami E, Laflamme MA, et al. Transplantation of undifferentiated murine embryonic stem cells in the heart: teratoma formation and immune response. FASEB J. 2007;21:1345–1357. doi: 10.1096/fj.06-6769com. [DOI] [PubMed] [Google Scholar]
- 15.Swijnenburg RJ, Schrepfer S, Cao F, et al. In vivo imaging of embryonic stem cells reveals patterns of survival and immune rejection following transplantation. Stem Cells Dev. 2008;17:1023–1029. doi: 10.1089/scd.2008.0091. [DOI] [PMC free article] [PubMed] [Google Scholar]
- 16.Laflamme MA, Chen KY, Naumova AV, et al. Cardiomyocytes derived from human embryonic stem cells in pro-survival factors enhance function of infarcted rat hearts. Nat Biotechnol. 2007;25:1015–1024. doi: 10.1038/nbt1327. [DOI] [PubMed] [Google Scholar]
- 17.Dai W, Field LJ, Rubart M, et al. Survival and maturation of human embryonic stem cell-derived cardiomyocytes in rat hearts. J Mol Cell Cardiol. 2007;43:504–516. doi: 10.1016/j.yjmcc.2007.07.001. [DOI] [PMC free article] [PubMed] [Google Scholar]
- 18.Caspi O, Huber I, Kehat I, et al. Transplantation of Human Embryonic Stem Cell-Derived Cardiomyocytes Improves Myocardial Performance in Infarcted Rat Hearts. Journal of the American College of Cardiology. 2007;50:1884–1893. doi: 10.1016/j.jacc.2007.07.054. [DOI] [PubMed] [Google Scholar]
- 19.Min J-Y, Yang Y, Converso KL, et al. Transplantation of embryonic stem cells improves cardiac function in postinfarcted rats. J Appl Physiol. 2002;92:288–296. doi: 10.1152/jappl.2002.92.1.288. [DOI] [PubMed] [Google Scholar]
- 20.Chung S, Andersson T, Sonntag KC, Bjorklund L, Isacson O, Kim KS. Analysis of different promoter systems for efficient transgene expression in mouse embryonic stem cell lines. Stem Cells. 2002;20:139–145. doi: 10.1634/stemcells.20-2-139. [DOI] [PMC free article] [PubMed] [Google Scholar]
- 21.Zhou R, Thomas DH, Qiao H, et al. In Vivo detection of stem cells grafted in infarcted rat myocardium. J Nucl Med. 2005;46:816–822. [PMC free article] [PubMed] [Google Scholar]
- 22.Bhaumik S, Gambhir SS. Optical imaging of Renilla luciferase reporter gene expression in living mice. Proc Natl Acad Sci U S A. 2002;99:377–382. doi: 10.1073/pnas.012611099. [DOI] [PMC free article] [PubMed] [Google Scholar]
- 23.Zhou R, Pickup S, Glickson JD, Scott C, Ferrari VA. Assessment of Global and Regional Myocardial Function in the Mouse Using Cine- and Tagged MRI. Magnetic Resonance in Medicine. 2003;49:760–764. doi: 10.1002/mrm.10423. [DOI] [PubMed] [Google Scholar]
- 24.Thomas D, Dumont C, Pickup S, et al. T1-weighted cine FLASH is superior to IR imaging of post-infarction myocardial viability at 4.7T. J Cardiovasc Magn Reson. 2006;8:345–352. doi: 10.1080/10976640500451986. [DOI] [PMC free article] [PubMed] [Google Scholar]
- 25.Yang Z, Berr SS, Gilson WD, Toufektsian MC, French BA. Simultaneous evaluation of infarct size and cardiac function in intact mice by contrast-enhanced cardiac magnetic resonance imaging reveals contractile dysfunction in noninfarcted regions early after myocardial infarction. Circulation. 2004;109:1161–1167. doi: 10.1161/01.CIR.0000118495.88442.32. [DOI] [PubMed] [Google Scholar]
- 26.Hou D, Youssef EA-S, Brinton TJ, et al. Radiolabeled Cell Distribution After Intramyocardial, Intracoronary, and Interstitial Retrograde Coronary Venous Delivery: Implications for Current Clinical Trials. Circulation. 2005;112:I-150–156. doi: 10.1161/CIRCULATIONAHA.104.526749. [DOI] [PubMed] [Google Scholar]
- 27.Berry MF, Engler AJ, Woo YJ, et al. Mesenchymal stem cell injection after myocardial infarction improves myocardial compliance. Am J Physiol Heart Circ Physiol. 2006;290:H2196–2203. doi: 10.1152/ajpheart.01017.2005. [DOI] [PubMed] [Google Scholar]
- 28.Kattman SJ, Adler ED, Keller GM. Specification of multipotential cardiovascular progenitor cells during embryonic stem cell differentiation and embryonic development. Trends Cardiovasc Med. 2007;17:240–246. doi: 10.1016/j.tcm.2007.08.004. [DOI] [PubMed] [Google Scholar]
- 29.Behfar A, Perez-Terzic C, Faustino RS, et al. Cardiopoietic programming of embryonic stem cells for tumor-free heart repair. J Exp Med. 2007;204:405–420. doi: 10.1084/jem.20061916. [DOI] [PMC free article] [PubMed] [Google Scholar]