Abstract
Objectives
To explore mechanisms through which altered peroxisome proliferator–activated receptor γ coactivator 1α (PGC-1α) expression may influence Alzheimer disease (AD) amyloid neuropathology and to test the hypothesis that promotion of PGC-1α expression in neurons might be developed as a novel therapeutic strategy in AD.
Design
Case-control.
Patients
Human postmortem brain (hippocampal formation) samples from AD cases and age-matched non-AD cases.
Results
Using genome-wide complementary DNA microarray analysis, we found that PGC-1α messenger RNA expression was significantly decreased as a function of progression of clinical dementia in the AD brain. Following confirmatory real-time polymerase chain reaction assay, we continued to explore the role of PGC-1α in clinical dementia and found that PGC-1α protein content was negatively associated with both AD-type neuritic plaque pathology and β-amyloid (Aβ)X-42 contents. Moreover, we found that the predicted elevation of amyloidogenic Aβ1-42 and Aβ1-40 peptide accumulation in embryonic cortico-hippocampal neurons derived from Tg2576 AD mice under hyperglycemic conditions (glucose level, 182-273 mg/dL) coincided with a dose-dependent attenuation in PGC-1α expression. Most importantly, we found that the reconstitution of exogenous PGC-1α expression in Tg2576 neurons attenuated the hyperglycemic-mediated β-amyloidogenesis through mechanisms involving the promotion of the “nonamyloidogenic” α-secretase processing of amyloid precursor protein through the attenuation of the forkheadlike transcription factor 1 (FoxO3a) expression.
Conclusion
Therapeutic preservation of neuronal PGC-1α expression promotes the nonamyloidogenic processing of amyloid precursor protein precluding the generation of amyloidogenic Aβ peptides.
Alzheimer Disease (AD) is a neurodegenerative disorder of the central nervous system. The neuropathological hallmarks of AD include extracellular amyloid-containing plaques and intracellular neurofibrillary tangles.1 The molecular events leading to the development of sporadic late-onset AD have not been defined. Advanced age is the largest AD risk factor and glucose/energy metabolism is decreased during aging.2-7 Recent evidence strongly supports the hypothesis that type 2 diabetes mellitus (T2D) is also a risk factor for AD.8-11 Moreover, recent evidence suggests that worsening in cerebral glucose metabolism is associated with progression of AD clinical dementia.12-16
Positron emission tomography studies demonstrated that glucose use is reduced markedly in the brain of mild cognitive impairment and early-stage AD.4,5,17-23 In contrast to controls, glucose ingestion significantly elevated hippocampal glucose concentrations in persons with AD, suggesting that cerebral glucose hypometabolism in AD results in increased steady-state concentrations of cerebral glucose.24 This evidence strongly associates brain glucose hypometabolic conditions and possibly T2D with the onset and progression of AD.
The present study was designed to explore mechanisms through which altered expression of peroxisome proliferator–activated receptor γ (PPAR-γ) coactivator 1α (PGC-1α), a key regulator of glucose homeostasis in the liver and muscle during fasting or in conditions of insulin resistance in T2D through the activation of gluconeogenic metabolic pathways,25-33 may influence AD amyloid neuropathology and to test the hypothesis that promotion of PGC-1α expression in neurons might be developed as a novel therapeutic strategy in AD.
Methods
Postmortem AD Brain for the Characterization of PGC-1α Expression in the AD Brain
Human postmortem brain (hippocampal formation) samples from AD cases and age-matched non-AD cases were obtained from the Alzheimer's Disease Brain Bank of the Mount Sinai School of Medicine. The precise tissue handling procedures have been described in detail previously (eTable 1, http://archneurol.com).34-38
Microarray Procedure
The procedures used for microarray analysis of gene expression in human hippocampal formation have been published previously (eTable 1).39-44
Confirmatory Real-Time Polymerase Chain Reaction Studies
RNA was quantified by absorbance at 260/280 nm. One microgram of total RNA was used to prepare complementary DNA (cDNA) libraries using the High-Capacity cDNA Archive Kit (Applied Biosystems, Foster City, California) in a total volume of 20 μL. Data were normalized relative to those for neuron-specific enolase RNA (or glyceraldehyde-3-phosphate dehydrogenase [GAPDH] RNA) (eFigure). Levels of PGC-1α or forkheadlike transcription factor (FoxO) 3a messenger RNA (mRNA) were expressed relative to those in control groups using the 2-ΔΔCt method.45
Confirmatory Western Blot Analysis
Aliquots of crushed, never-thawed hippocampal formation tissue were extracted in phosphate-buffered saline containing final concentrations of 1% NP-40, 0.5% sodium deoxycholate, 0.1% sodium dodecyl sulfate, and 0.1mM edetic acid plus protease inhibitors. Antibodies used include PGC-1α (H-300, 1:500 dilution; Santa Cruz Biotechnology, Inc, Santa Cruz, California); anti-FKHRL-1 (FoxO3a) (1:1000 dilution; Upstate Biotechnology, Inc, Lake Placid, New York); polyclonal anti–amyloid precursor protein (APP) C terminal (751-770) antibody (anti-O443, 1:5000 dilution; Calbiochem, San Diego, California); monoclonal 6E10 antibody (1:1000 dilution; Senetek, St Louis, Missouri); and monoclonal 22C11 antibody (1:1000 dilution; Senetek). In this study, β-actin immunoreactivity (1:1000 dilution; Sigma, St Louis) controlled for selectivity of changes. NIH/3T3+platelet-derived growth factor cell lysate (Santa Cruz Biotechnology) and DU145 nuclear extract (Santa Cruz Biotechnology) were used to assess specificity of detection in FoxO3a and PGC-1α immunoreactivity, respectively.
Quantification of β-Amyloidx-42 Peptide Content in the Human Brain
For the β-amyloid (Aβ) peptide assay, hippocampal formation frozen brain tissue samples were first pulverized in dry ice and cortical Aβx-42 was extracted and quantified as previously described.46
Tissue Cell Cultures
Embryonic (E14) cortico-hippocampal primary neuronal cultures derived from Tg2576 transgenic mice (Tg2576 neurons) were prepared as previously described.47 To study the effect of glucose on amyloidogenesis, culture medium was replaced with Dulbecco modified Eagle medium in the presence of the desired concentration of glucose (91 mg/dL for normoglycemia condition and 182-273 mg/dL for hyperglycemia condition [to convert to millimoles per liter, multiply by 0.055]). For adenoviral infection studies, Tg2576 neuronal (5-day-old) (18 hours after plating) cultures were infected with PGC-1α,31 constitutively active (CA) FoxO3a,48 or green fluorescent protein (GFP) control adenoviruses at doses defined as multiplicities of infection (MOI).
Quantification of Aβ Peptides in the Conditioned Medium in Primary Neuron Cultures
The quantitative assessment of Aβ peptides in primary cortico-hippocampal neuron cultures derived from embryonic Tg2576 mice was performed by enzyme-linked immunosorbent assays as previously described.49,50
Fluorimetric Assessment of APP Secretase Activities
α-, β-, and γ-Secretase activities were assessed using commercially available kits (R&D Systems, Minneapolis, Minnesota) as previously described.51-54
Statistical Analysis
Analysis of variance (ANOVA) was used to evaluate differences in mean values among 3 or more groups, and the Dunnett t test was used to test the significance of differences between group pairs. One-tailed or 2-tailed tests were used as indicated. Correlation analysis between 2 variables was done using the Pearson parametric method followed by 2-way analysis of P value.
Results
Identification of Gene Products Involved in Metabolic Functions Whose Expression is Changed as a Function of Progression of Clinical AD Dementia
To clarify the molecular mechanisms involved in onset and progression of AD dementia, we used DNA microarray assays to identify candidate genes, the expression of which is altered in the AD brain at different stages of clinical dementia and neuropathology relative to controls without dementia. Among others, we report that we found a strong association between the altered expression of a series of gene products involved in glucose metabolism as well as in mitochondrial oxidative phosphorylation in the hippocampal formation of the AD brain. eTable 2 shows the alteration in gene expression involved in glucose metabolism and oxidative phosphorylation we found across all of the analyzed regions as a function of Clinical Dementia Rating (CDR). We report the association between the decreased expression of PGC-1α in the AD brain as a function of progression of clinical dementia and AD neuropathology.
Confirmatory Evidence that Hippocampal PGC-1α Expression is Decreased as a Function of AD Clinical Dementia
The decreased expression in PGC-1α mRNA and eventually in PGC-1α protein content in the hippocampal formation of AD cases as a function of clinical dementia assessed by CDR was confirmed by quantitative real-time polymerase chain reaction normalizing with GAPDH mRNA (eFigure, A) and Western blot analysis (Figure 1B) (P<.001; R2=0.8331; 1-way ANOVA), respectively. To exclude the possibility that the decrease in PGC-1α mRNA expression (Figure 1A) may be secondary to neuronal and synaptic loss that also correlates strongly with clinical dementia, we normalized PGC-1α mRNA expression with a different neuronal specific “housekeeping” gene, neuron-specific enolase, and found that alteration of PGC-1α mRNA expression as a function of clinical dementia remained the same (Figure 1A) (P =.001; R2=0.3992; 1-way ANOVA).
Figure 1.
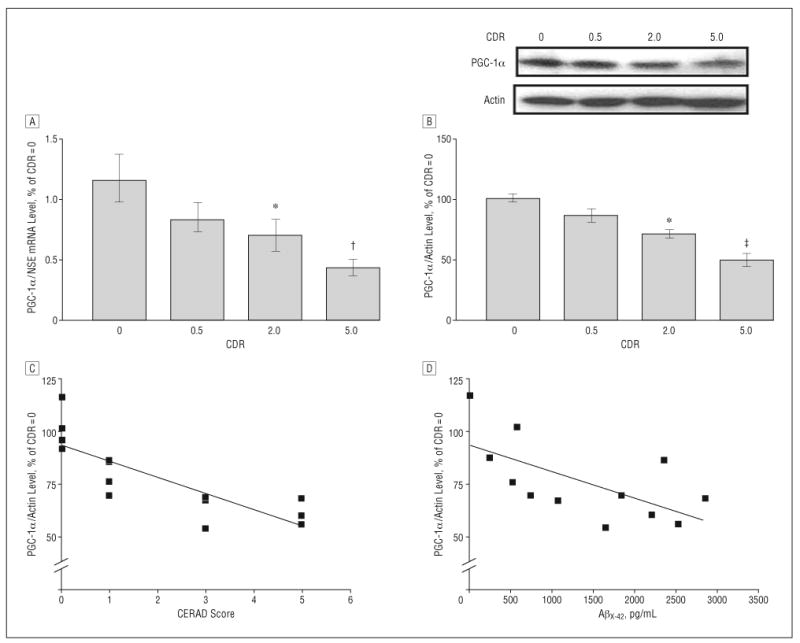
Hippocampal peroxisome proliferator–activated receptor γ coactivator 1α (PGC-1α) expression in the Alzheimer disease (AD) brain decreases as a function of AD dementia and AD β-amyloid (Aβ) neuropathology. A, PGC-1α messenger RNA (mRNA) content in the hippocampal formation (quantified by real-time reverse transcriptase–polymerase chain reaction and normalized by neuron-specific enolase [NSE]) as a function of Clinical Dementia Rating (CDR) representing cognitive normalcy (CDR=0), questionable dementia (CDR=0.5), mild dementia (CDR=2), and severe dementia (CDR=5). B, Western blot confirmation of decreased PGC-1α protein content in the hippocampal formation of AD cases. In A and B, data represent mean (SEM) and are shown as a percentage relative to the CDR=0 group. *P<.05, †P<.003, and ‡P<.01 vs control group by t test. C and D, PGC-1α mRNA expression as a function of Aβ neuritic plaque neuropathology in accord with the Consortium to Establish a Registry for Alzheimer's Disease (CERAD) 4-point scale (n=4, 4, 3, and 3 for CERAD scores of 0, 1, 3, and 5, respectively) for AD (C) or content of Aβx-42 (n=12) (D). Straight line represents best linear regression fit.
Relative to cases with normal cognitive status (CDR=0), the level of hippocampal PGC-1α protein and mRNA expression was significantly decreased in cases characterized by moderate dementia (CDR=2) and severe dementia (CDR=5) (P<.05 and P<.003, respectively) (Figure 1A and B and eTable 1). No detectable change in PGC-1α attenuation was found in cases at high risk to develop AD (mild cognitive impairment) (CDR=0.5) (Figure 1A and B).
Decreased Expression of Hippocampal PGC-1α Protein Content Correlates with Progression of Amyloid Neuropathology in AD
We found that the decreased PGC-1α protein content in the hippocampal formation of the cases examined correlated with the density of neuritic plaque (P<.05; r2=0.673; P<.001; n=14) (Figure 1C).
To further explore the functional relationship between the changes in hippocampal PGC-1α expression and amyloid neuropathology, we explored the relationship between PGC-1α protein content and Aβ peptide content in the brain of AD cases. We found that the hippocampal PGC-1α protein content inversely correlated with total Aβx-42 content in the EC-BM36/38 (Pearson correlation coefficient r2=−0.411; P =.02; n=12). This association tentatively suggests that a decrease in PGC-1α expression in the AD brain might be associated with conditions promoting AD Aβ amyloidogenesis.
Hyperglycemia-Mediated Attenuation of PGC-1α Expression in Tg2576 Neurons Coincides With Increased Aβ Peptide Content in the Conditioned Medium
We treated Tg2576 neurons with increasing glucose concentrations from 91 to 273 mg/dL in the culture-conditioned medium to match extracellular concentrations of glucose found in either normoglycemic (glucose concentration, 91 mg/dL) or hyperglycemic T2D conditions (glucose concentration, 182-273 mg/dL) in humans.32,33 We found that hyperglycemic conditions resulted in a significant decrease in PGC-1α protein content in the Tg2576 neurons in a dose-dependent manner (182 mg/dL, P<.05 and 273 mg/dL, P<.01), relative to control Tg2576 neurons cultured in normoglycemic conditions, 24 hours after treatment (Figure 2A).
Figure 2.
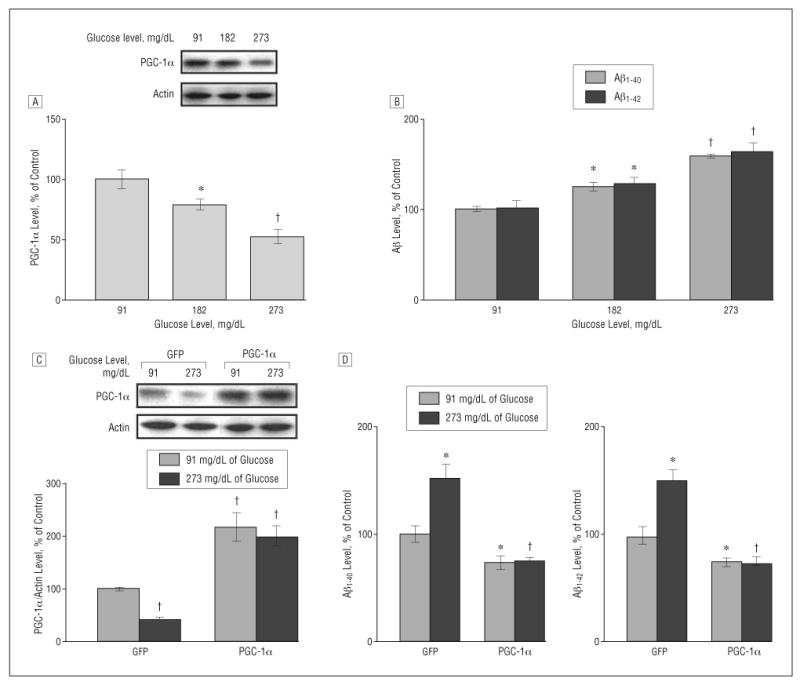
Increased concentration of glucose inhibits peroxisome proliferator–activated receptor γ coactivator 1α (PGC-1α) expression and promotes β-amyloid (Aβ) generation in Tg2576 neurons, which is prevented by exogenous viral expression of PGC-1α. A and B, Culturing Tg2576 neurons with 91, 182, and 273 mg/dL of glucose (to convert to millimoles per liter, multiply by 0.055) for 24 hours resulted in a dose-dependent inhibition of PGC-1α protein expression (A) as assessed by Western blot analysis and a dose-dependent promotion of Aβ generation (B) as detected by enzyme-linked immunosorbent assay (ELISA). C and D, Adenovirus-mediated overexpression of PGC-1α in primary neuron cultures prevents 273-md/dL glucose–mediated induction of Aβ1-40 and Aβ1-42 contents released into the culture media, assessed by ELISA 24 hours postinfection (10 multiplicities of infection). Western blot analysis of PGC-1α expression in parts A and C used an anti–PGC-1α antibody. Results are expressed as a percentage of its own control. Values represent mean (SEM) of determinations made in 3 separate culture preparations; n=3 per culture preparation. *P<.05 and †P<.01 vs control group by t test.
The decreased PGC-1α protein content in Tg2576 neurons coincided with a significant dose-dependent elevation in endogenous Aβ1-40 and Aβ1-42 peptide contents in the Tg2576 neuron culture medium (182 mg/dL, P<.05 and 273 mg/dL, P<.01), relative to control Tg2576 neurons cultured in normoglycemic conditions, 24 hours after treatment (Figure 2B).
Exogenous Viral Expression of PGC-1α Prevents Hyperglycemia-Mediated Potentiation of Aβ Peptide Accumulation in the Conditioned Medium in Tg2576 Neurons
To further explore the role of PGC-1α in the promotion of Aβ peptide content in vitro, we tested the hypothesis that exogenous expression of PGC-1α in Tg2576 neurons might attenuate hyperglycemia-mediated accumulation of Aβ1-40 and Aβ1-42 content toward levels found in Tg2576 neurons cultured in control normoglycemic conditions.
We found that exogenous adenoviral expression (10 MOI) of PGC-1α31 resulted in approximately a 2- to 3-fold elevation in PGC-1α protein content in the Tg2576 neuron cultures, relative to control normoglycemic GFP adenoviral–expressing Tg2576 neurons (Figure 2C). Exogenous expression of PGC-1α significantly reduced the hyperglycemic-mediated attenuation of PGC-1α protein expression in Tg2576 neurons (Figure 2C), which coincided with a significant attenuation of Aβ1-40 and Aβ1-42 peptide content in the Tg2576 culture medium toward levels found in Tg2576 neurons cultured in control normoglycemic conditions, 24 hours after infection (Figure 2D). We also found that exogenous adenoviral expression of PGC-1α in Tg2576 neurons resulted in a moderate but significant decreased Aβ1-40 and Aβ1-42 peptide content in the culture medium relative to control normoglycemic GFP adenoviral–expressing Tg2576 neurons (Figure 2D).
Hyperglycemic Culture Conditions Selectively Attenuate α-Secretase Activity in Tg2576 Neurons
We found a selective attenuation of α- (P<.05), but not β- or γ-, secretase activity (Figure 3A) in GFP-expressing Tg2576 neurons cultured in hyperglycemic conditions for 24 hours, which coincided with a commensurate attenuation of 6E10 immunoreactive soluble APP-α (sAPPα) content in the culture-conditioned medium (P<.05), relative to Tg2576 neurons cultured in normoglycemic conditions (Figure 3A and B).
Figure 3.
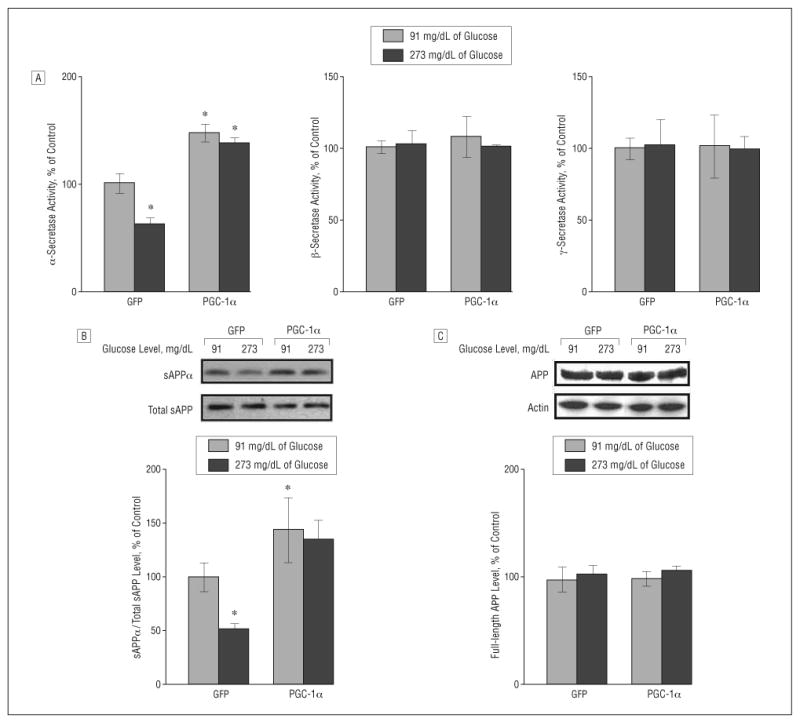
Role of peroxisome proliferator–activated receptor γ coactivator 1α (PGC-1α) expression on amyloid precursor protein (APP) processing in neuronal cells. A, Fluorimetric assessment of α-, β-, and γ-secretase activities in Tg2576 neurons cultured with 91 or 273 mg/dL of glucose (to convert to millimoles per liter, multiply by 0.055) in response to adenoviral PGC-1α or control adenoviral green fluorescent protein (GFP) infection. Fifty-microgram cell lysates of each sample were used. B and C, Assessment of changes in soluble amyloid precursor protein α (sAPPα) concentration (B) and full-length APP (C) (expressed as percentage of total sAPP and actin immunoreactivity, respectively) in the same Tg2576 neurons cultured with 91 or 273 mg/dL of glucose in response to adenoviral PGC-1α or control adenoviral GFP infection. Results are expressed as a percentage of control (adenoviral GFP) infection. Values represent mean (SEM) of determinations made in 3 separate culture preparations; n=3 per culture preparation. *P<.05 vs control group by t test.
Exogenous PGC-1α Expression Prevents Hyperglycemic-Mediated Attenuation of Nonamyloidogenic α-Secretase Processing of APP in Tg2576 Neurons
Exogenous adenoviral PGC-1α expression in Tg2576 neurons cultured in normoglycemic conditions resulted in a selective elevation of α- (P<.05), but not β- or γ-, secretase activity (Figure 3A) coincidental with a significant increase in sAPPα content in the culture-conditioned medium (Figure 3B) (P<.005) relative to control GFP-expressing Tg2576 neurons cultured in normoglycemic conditions. Most importantly, we found that reconstitution of PGC-1α expression in Tg2576 neurons through exogenous adenoviral infection significantly prevented the hyperglycemic-mediated attenuation of α-secretase activity (Figure 3A) 24 hours after exogenous viral infection.
These changes occurred in the absence of detectable variations in the content of 22C11 immunoreactive (total) sAPP in the conditioned medium (Figure 3A) or in O-443 immunoreactive full-length APP in Tg2576 neurons (Figure 3C), excluding the possibility that exogenous adenoviral PGF-1α expression influenced total APP expression.
This evidence indicates that exogenous neuronal expression of PGC-1α might therapeutically reverse hyperglycemia-mediated attenuation of the nonamyloidogenic α-secretase processing of APP and diminish Aβ generation. The cerebral glucose hypometabolism reported in AD may result in increased steady-state levels of glucose in the brain20 that, through attenuation of PGC-1α expression, might exacerbate AD Aβ amyloidogenesis.
PGC-1α Expression Promotes Nonamyloidogenic Processing of APP Through Attenuation of Expression of the FoxO3a Transcription Factor
Recent evidence supports the hypothesis that PGC-1α may influence muscle atrophy, in part through suppression of FoxO3a.55 Moreover, we recently found that exogenous expression of FoxO3a (10 MOI)48 in Tg2576 neurons may causally promote AD-type Aβ levels through mechanisms that attenuate nonamyloidogenic α-secretase processing of APP, suggesting an intrinsic association between FoxO3a activity and AD-type Aβ amyloidogensis.56
We found a significant elevation in FoxO3a protein content (P<.05) in GFP-expressing Tg2576 neurons cultured in hyperglycemic conditions relative to Tg2576 neurons cultured in normoglycemic conditions (Figure 4A) 24 hours after treatment. Most importantly, we found that exogenous adenoviral expression of PGC-1α significantly prevented the hyperglycemic-mediated potentiation of FoxO3a protein expression in Tg2576 neurons (Figure 4A) 24 hours after PGC-1α adenoviral infection.
Figure 4.
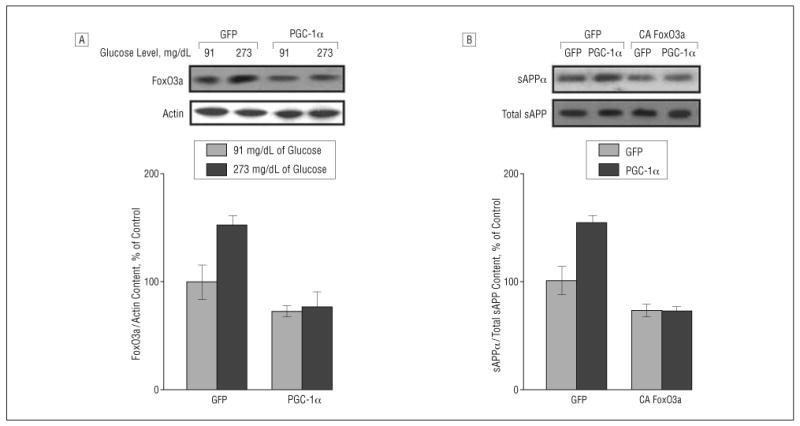
Peroxisome proliferator–activated receptor γ coactivator 1α (PGC-1α) regulates amyloid precursor protein (APP) processing on β-amyloid (Aβ) generation involving modulation of forkheadlike transcription factor 1 (FoxO3a). A, Western blot analysis of FoxO3a protein content in Tg2576 neurons cultured with 91 or 273 mg/dL of glucose (to convert to millimoles per liter, multiply by 0.055) in response to adenoviral PGC-1α or control adenoviral green fluorescent protein (GFP) infection. B, Tg2576 neurons cultured with 91 mg/dL of glucose were infected with adenoviral PGC-1α or control adenoviral GFP in combination with adenoviral GFP or adenoviral constitutively active (CA) FoxO3a infection. The resulting culture-conditioned medium 24 hours postinfection was assessed for soluble amyloid precursor protein α (sAPPα) concentration (expressed as percentage of total sAPP immunoreactivity) by Western blot analysis.
We infected Tg2576 neurons with adenovirus-expressing CA FoxO3a or GFP control vector in combination with viral PGC-1α or control GFP infection in a culture-conditioned medium with 91 mg/dL of glucose. As expected, we found that Tg2576 neurons expressing exogenous viral PGC-1α resulted in a significant elevation of sAPPα content (P<.05) in the culture-conditioned medium 24 hours after infection relative to control GFP-infected cells (P<.05) (Figure 4B).
Moreover, we found that exogenous CA FoxO3a (10 MOI) expression in Tg2576 neurons significantly prevented PGC-1α–mediated elevation of sAPPα (Figure 4B), relative to control GFP (and PGC-1α)-expressing Tg2576 neurons, in the absence of detectable changes in total sAPP in the conditioned medium (Figure 4B) or full-length cellular APP content (data not shown) 24 hours after infection.
Similarly, consistent with our previous findings,56 we found a significant diminution of sAPPα (P<.05) in the culture-conditioned medium of Tg2576 neurons virally expressing CA FoxO3a, but not PGC-1α, relative to control GFP-expressing Tg2576 neurons, further supporting the hypothesis of a direct inhibitory role of FoxO3a on the nonamyloidogenic α-secretase processing of APP (Figure 4B).
Collectively, this finding strongly supports the hypothesis that the transcription factor FoxO3a may be a downstream effector of PGC-1α and supports the hypothesis that decreased PGC-1α expression in the AD brain might result in increased FoxO3a expression in the brain eventually promoting AD Aβ amyloidogenesis.
PGC-1α Expression Inversely Correlates with FoxO3a Expression in the AD Brain as a Function of Progression of Clinical Dementia
To further investigate the clinical relevance of the in vitro finding suggesting that FoxO3a may be involved in PGC-1α–mediated AD Aβ amyloidogenesis, we continued to explore the regulation of the FoxO3a mRNA and protein contents in the brain of AD cases relative to neurological control cases and the association of FoxO3a expression with PGC-1α and AD Aβ neuropathology.
We found that FoxO3a mRNA expression and FoxO3a protein contents in the hippocampal formation were significantly increased in the AD brain as a function of CDR, as assessed by quantitative real-time polymerase chain reaction (Figure 5A and eFigure B) (P = .001; R2=0.5416; 1-way ANOVA) and Western blot analysis (Figure 5B) (P = .008; R2=0.4528; 1-way ANOVA), respectively.
Figure 5.
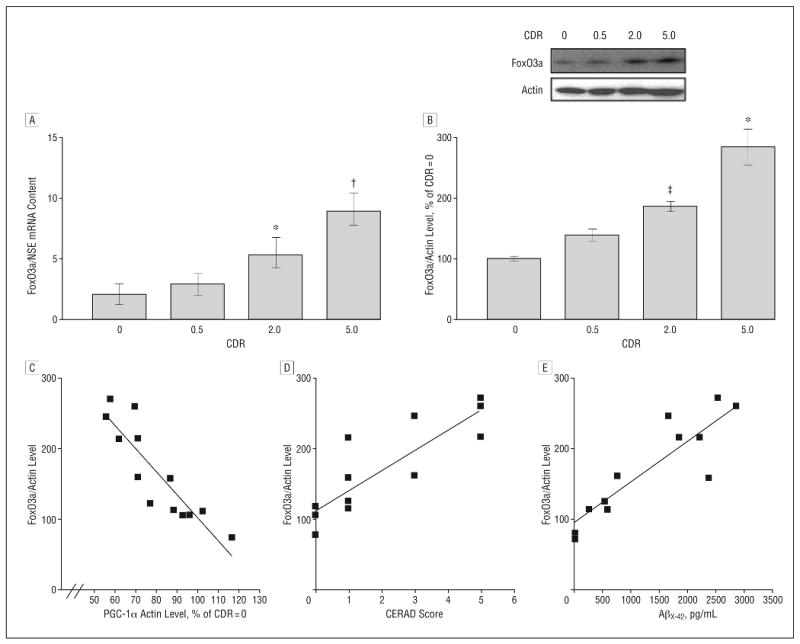
Peroxisome proliferator–activated receptor γ coactivator 1α (PGC-1α) expression inversely correlates with forkheadlike transcription factor 1 (FoxO3a) expression in the Alzheimer disease (AD) brain as a function of progression of clinical dementia. A, Forkheadlike transcription factor 1 messenger RNA (mRNA) content in hippocampal formation (quantified by real-time reverse transcriptase–polymerase chain reaction and normalized by neuron-specific enolase [NSE]) as a function of Clinical Dementia Rating (CDR). B, Western blot confirmation of increased FoxO3a protein contents in the hippocampal formation of AD cases. *P<.01, †P<.003, and ‡P<.05 vs control group by t test. C-E, Scatterplot analysis of FoxO3a protein expression (n=13) as a function of PGC-1α expression (C), Consortium to Establish a Registry for Alzheimer's Disease (CERAD) 4-point scale (n=3, 4, 2, and 3 for CERAD scores of 0, 1, 3, and 5, respectively) for AD (D), or for content of β-amyloid (Aβ)x-42 (n=12) in the brain of AD cases (E). Straight line represents best linear regression fit.
Moreover, we found a strong inverse association between PGC-1α and FoxO3a protein content in the same postmortem brain tissue (Pearson correlation coefficient, r2=−0.786; P<.001) (Figure 5C). Most importantly, we found that the increased in hippocampal FoxO3a protein content as a function of AD clinical dementia strongly associated with the increased density of neuritic plaques (Pearson correlation coefficient, r2=0.0001; P<.001) (Figure 5D). Finally, we found that the hippocampal FoxO3a protein content directly associated with total Aβx-42 content in the EC-BM36/38 (Pearson correlation coefficient, r2=−0.411; P=.02) (Figure 5E), consistent with the hypothesis that decreased PGC-1α expression might causally promote AD Aβ amyloidogenesis through FoxO3a-mediated responses.
Comment
We report for the first time, to our knowledge, that PGC-1α expression is decreased in the brain of persons with AD as a function of dementia severity. Moreover, we found that experimental hyperglycemic conditions in cortico-hippocampal neuron cultures derived from Tg2576 embryos may significantly inhibit PGC-1α expression coincident with the elevation of Aβ peptide generation through a mechanism(s) involving the inactivation of nonamyloidogenic α-secretase processing of APP.56-58 Finally, the cause-effect relationship between PGC-1α and Aβ peptide generation was confirmed by the demonstration that exogenous viral expression of PGC-1α in primary Tg2576 cortico-hippocampal neurons reverse glucose-mediated induction of amyloidogenic Aβ peptide accumulation in the conditioned medium.
Previous studies from our laboratory found that that inhibition of FoxO3a activity by calorie restriction results in improved glucose use and promotes nonamyloidogenic-mediated α-secretase processing of APP precluding Aβ generation.56 Interestingly, in this study, we found that hyperglycemic conditions in vitro result in elevation of PGC-1α–dependent FoxO3a expression coincident with inhibition of nonamyloidogenic processing of APP and promotion of Aβ generation in Tg2576 neurons.
It was hypothesized that a close relationship exists among PGC-1α function, insulin sensitivity, and T2D, which is most likely related to the essential role of PGC-1α in mitochondria biogenesis and glucose/fatty acid metabolism. In this context, thiazolidinediones, an important class of antidiabetic drugs and agonists of PPAR-γ currently being developed for the treatment of AD, also act to increase insulin sensitivity coincident with the activation of PPAR-γ.59 The effects of thiazolidinediones are likely mediated through the ability of PGC-1α to activate mitochondria biogenesis and increase mitochondrial function and eventually improve energy metabolism. Moreover, recent evidence suggests that activation of SIRT1, an oxidized nicotinamide adenine dinucleotide–dependent deacetylase and a principal modulator of pathways downstream of calorie restriction that we found to prevent AD-type Aβ amyloidogenesis in Tg2576 mice,50 may also protect against experimental T2D conditions through inhibition of PGC-1α acetylation and promotion of PGC-1α activity.60
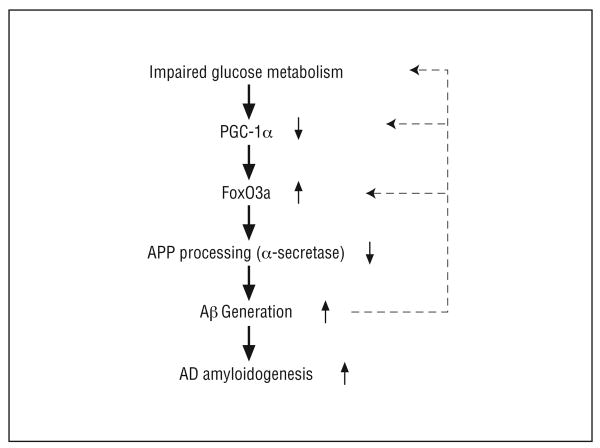
We hypothesize that impaired glucose/energy metabolism and increased steady-state concentration of cerebral glucose in the AD brain, as demonstrated by previous studies,24 lead to attenuation of PGC-1α expression resulting in activation of FoxO3a expression, thereby inhibiting nonamyloidogenic α-secretase processing of APP and increased generation of amyloidogenic Aβ peptides (Figure 6). The data suggest that cerebral glucose hypometabolism in AD may lead to an increased steady-state concentration of cerebral glucose as found in the AD brain,24 leading to alteration of PGC-1α–mediated multiple-cellular functions that ultimately result in AD amyloid neuropathology.
Figure 6.
Scheme illustrates the potential role of peroxisome proliferator–activated receptor γ coactivator 1α (PGC-1α) in regulation of nonamyloidogenic α-secretase processing of amyloid precursor protein (APP) through modulating forkheadlike transcription factor 1 (FoxO3a) in the Alzheimer disease (AD) brain. Aβ indicates β-amyloid.
Acknowledgments
Funding/Support: These studies were supported by the Dr Robert C. Atkins Foundation, National Institutes of Health grant AG14766, the Dana Foundation for Brain Research Initiative, Merit Review (Dr Pasinetti), and grant B4162C from the Department of Veterans Affairs Rehabilitation Research and Development Service.
Footnotes
Author Contributions: Study concept and design: Qin, Haroutunian, Ho, and Pasinetti. Acquisition of data: Qin and Katsel. Analysis and interpretation of data: Qin, Katsel, Cardozo, Buxbaum, and Pasinetti. Drafting of the manuscript: Qin, Ho, and Pasinetti. Critical revision of the manuscript for important intellectual content: Qin, Haroutunian, Katsel, Cardozo, Ho, Buxbaum, and Pasinetti. Statistical analysis: Qin and Pasinetti. Obtained funding: Qin. Administrative, technical, and material support: Qin, Haroutunian, Katsel, Cardozo, Ho, Buxbaum, and Pasinetti. Study supervision: Qin and Pasinetti.
Financial Disclosure: None reported.
Additional Information: The eTables and eFigure are available at http://archneurol.com.
References
- 1.Roberson ED, Mucke L. 100 Years and counting: prospects for defeating Alzheimer's disease. Science. 2006;314(5800):781–784. doi: 10.1126/science.1132813. [DOI] [PMC free article] [PubMed] [Google Scholar]
- 2.Frölich L, Blum-Degen D, Bernstein HG, et al. Brain insulin and insulin receptors in aging and sporadic Alzheimer's disease. J Neural Transm. 1998;105(4-5):423–438. doi: 10.1007/s007020050068. [DOI] [PubMed] [Google Scholar]
- 3.Gerozissis K, Rouch C, Lemierre S, Nicolaidis S, Orosco M. A potential role of central insulin in learning and memory related to feeding. Cell Mol Neurobiol. 2001;21(4):389–401. doi: 10.1023/a:1012606206116. [DOI] [PubMed] [Google Scholar]
- 4.Jagust WJ, Seab JP, Huesman RH, et al. Diminished glucose transport in Alzheimer's disease: dynamic PET studies. J Cereb Blood Flow Metab. 1991;11(2):323–330. doi: 10.1038/jcbfm.1991.65. [DOI] [PubMed] [Google Scholar]
- 5.Minoshima S, Frey KA, Foster NL, Kuhl DE. Preserved pontine glucose metabolism in Alzheimer disease: a reference region for functional brain image (PET) analysis. J Comput Assist Tomogr. 1995;19(4):541–547. doi: 10.1097/00004728-199507000-00006. [DOI] [PubMed] [Google Scholar]
- 6.Hoyer S. Brain glucose and energy metabolism abnormalities in sporadic Alzheimer disease. Causes and consequences: an update. Exp Gerontol. 2000;35(9-10):1363–1372. doi: 10.1016/s0531-5565(00)00156-x. [DOI] [PubMed] [Google Scholar]
- 7.Hoyer S. Causes and consequences of disturbances of cerebral glucose metabolism in sporadic Alzheimer disease: therapeutic implications. Adv Exp Med Biol. 2004;541:135–152. doi: 10.1007/978-1-4419-8969-7_8. [DOI] [PubMed] [Google Scholar]
- 8.Craft S. Insulin resistance and Alzheimer's disease pathogenesis: potential mechanisms and implications for treatment. Curr Alzheimer Res. 2007;4(2):147–152. doi: 10.2174/156720507780362137. [DOI] [PubMed] [Google Scholar]
- 9.Craft S. Insulin resistance syndrome and Alzheimer's disease: age- and obesity-related effects on memory, amyloid, and inflammation. Neurobiol Aging. 2005;26(1) suppl 1:65–69. doi: 10.1016/j.neurobiolaging.2005.08.021. [DOI] [PubMed] [Google Scholar]
- 10.Awad N, Gagnon M, Messier C. The relationship between impaired glucose tolerance, type 2 diabetes, and cognitive function. J Clin Exp Neuropsychol. 2004;26(8):1044–1080. doi: 10.1080/13803390490514875. [DOI] [PubMed] [Google Scholar]
- 11.Craft S, Newcomer J, Kanne S, et al. Memory improvement following induced hyperinsulinemia in Alzheimer's disease. Neurobiol Aging. 1996;17(1):123–130. doi: 10.1016/0197-4580(95)02002-0. [DOI] [PubMed] [Google Scholar]
- 12.Hoyer S. Abnormalities of glucose metabolism in Alzheimer's disease. Ann N Y Acad Sci. 1991;640:53–58. doi: 10.1111/j.1749-6632.1991.tb00190.x. [DOI] [PubMed] [Google Scholar]
- 13.Fukuyama H, Ogawa M, Yamauchi H, et al. Altered cerebral energy metabolism in Alzheimer's disease: a PET study. J Nucl Med. 1994;35(1):1–6. [PubMed] [Google Scholar]
- 14.Mielke R, Herholz K, Grond M, Kessler J, Heiss WD. Differences of regional cerebral glucose metabolism between presenile and senile dementia of Alzheimer type. Neurobiol Aging. 1992;13(1):93–98. doi: 10.1016/0197-4580(92)90015-p. [DOI] [PubMed] [Google Scholar]
- 15.Herholz K, Schopphoff H, Schmidt M, et al. Direct comparison of spatially normalized PET and SPECT scans in Alzheimer's disease. J Nucl Med. 2002;43(1):21–26. [PubMed] [Google Scholar]
- 16.Henneberg N, Hoyer S. Desensitization of the neuronal insulin receptor: a new approach in the etiopathogenesis of late-onset sporadic dementia of the Alzheimer type (SDAT)? Arch Gerontol Geriatr. 1995;21(1):63–74. doi: 10.1016/0167-4943(95)00646-3. [DOI] [PubMed] [Google Scholar]
- 17.de Leon MJ, Ferris SH, George AE, et al. Computed tomography and positron emission transaxial tomography evaluations of normal aging and Alzheimer's disease. J Cereb Blood Flow Metab. 1983;3(3):391–394. doi: 10.1038/jcbfm.1983.57. [DOI] [PubMed] [Google Scholar]
- 18.Smith GS, de Leon MJ, George AE, et al. Topography of cross-sectional and longitudinal glucose metabolic deficits in Alzheimer's disease: pathophysiologic implications. Arch Neurol. 1992;49(11):1142–1150. doi: 10.1001/archneur.1992.00530350056020. [DOI] [PubMed] [Google Scholar]
- 19.Hoyer S. Intermediary metabolism disturbance in AD/SDAT and its relation to molecular events. Prog Neuropsychopharmacol Biol Psychiatry. 1993;17(2):199–228. doi: 10.1016/0278-5846(93)90043-r. [DOI] [PubMed] [Google Scholar]
- 20.Hoyer S. Glucose metabolism and insulin receptor signal transduction in Alzheimer disease. Eur J Pharmacol. 2004;490(1-3):115–125. doi: 10.1016/j.ejphar.2004.02.049. [DOI] [PubMed] [Google Scholar]
- 21.Small GW, Ercoli LM, Silverman DH, et al. Cerebral metabolic and cognitive decline in persons at genetic risk for Alzheimer's disease. Proc Natl Acad Sci U S A. 2000;97(11):6037–6042. doi: 10.1073/pnas.090106797. [DOI] [PMC free article] [PubMed] [Google Scholar]
- 22.Reiman EM, Caselli RJ, Chen K, Alexander GE, Bandy D, Frost J. Declining brain activity in cognitively normal apolipoprotein E epsilon 4 heterozygotes: a foundation for using positron emission tomography to efficiently test treatments to prevent Alzheimer's disease. Proc Natl Acad Sci U S A. 2001;98(6):3334–3339. doi: 10.1073/pnas.061509598. [DOI] [PMC free article] [PubMed] [Google Scholar]
- 23.Alexander GE, Chen K, Pietrini P, Rapoport SI, Reiman EM. Longitudinal PET evaluation of cerebral metabolic decline in dementia: a potential outcome measure in Alzheimer's disease treatment studies. Am J Psychiatry. 2002;159(5):738–745. doi: 10.1176/appi.ajp.159.5.738. [DOI] [PubMed] [Google Scholar]
- 24.Haley AP, Knight-Scott J, Simnad VI, Manning CA. Increased glucose concentration in the hippocampus in early Alzheimer's disease following oral glucose ingestion. Magn Reson Imaging. 2006;24(6):715–720. doi: 10.1016/j.mri.2005.12.020. [DOI] [PubMed] [Google Scholar]
- 25.Puigserver P, Spiegelman BM. Peroxisome proliferator-activated receptor-gamma coactivator 1 alpha (PGC-1 alpha): transcriptional coactivator and metabolic regulator. Endocr Rev. 2003;24(1):78–90. doi: 10.1210/er.2002-0012. [DOI] [PubMed] [Google Scholar]
- 26.Yoon JC, Puigserver P, Chen G, et al. Control of hepatic gluconeogenesis through the transcriptional coactivator PGC-1. Nature. 2001;413(6852):131–138. doi: 10.1038/35093050. [DOI] [PubMed] [Google Scholar]
- 27.Herzig S, Long F, Jhala US, et al. CREB regulates hepatic gluconeogenesis through the coactivator PGC-1. Nature. 2001;413(6852):179–183. doi: 10.1038/35093131. [DOI] [PubMed] [Google Scholar]
- 28.Puigserver P, Rhee J, Donovan J, et al. Insulin-regulated hepatic gluconeogenesis through FOXO1-PGC-1alpha interaction. Nature. 2003;423(6939):550–555. doi: 10.1038/nature01667. [DOI] [PubMed] [Google Scholar]
- 29.Rhee J, Inoue Y, Yoon JC, et al. Regulation of hepatic fasting response by PPARγ coactivator-1α (PGC-1): requirement for hepatocyte nuclear factor 4α in gluconeogenesis. Proc Natl Acad Sci U S A. 2003;100(7):4012–4017. doi: 10.1073/pnas.0730870100. [DOI] [PMC free article] [PubMed] [Google Scholar]
- 30.Lin J, Wu PH, Tarr PT, et al. Defects in adaptive energy metabolism with CNS-linked hyperactivity in PGC-1α null mice. Cell. 2004;119(1):121–135. doi: 10.1016/j.cell.2004.09.013. [DOI] [PubMed] [Google Scholar]
- 31.Rodgers JT, Lerin C, Haas W, Gygi SP, Spiegelman BM, Puigserver P. Nutrient control of glucose homeostasis through a complex of PGC-1alpha and SIRT1. Nature. 2005;434(7029):113–118. doi: 10.1038/nature03354. [DOI] [PubMed] [Google Scholar]
- 32.Liang H, Ward WF. PGC-1alpha: a key regulator of energy metabolism. Adv Physiol Educ. 2006;30(4):145–151. doi: 10.1152/advan.00052.2006. [DOI] [PubMed] [Google Scholar]
- 33.Tomlinson DR, Gardiner NJ. Glucose neurotoxicity. Nat Rev Neurosci. 2008;9(1):36–45. doi: 10.1038/nrn2294. [DOI] [PubMed] [Google Scholar]
- 34.Haroutunian V, Perl DP, Purohit DP, et al. Regional distribution of neuritic plaques in the nondemented elderly and subjects with very mild Alzheimer disease. Arch Neurol. 1998;55(9):1185–1191. doi: 10.1001/archneur.55.9.1185. [DOI] [PubMed] [Google Scholar]
- 35.Davis KL, Mohs RC, Marin D, et al. Cholinergic markers in elderly patients with early signs of Alzheimer disease. JAMA. 1999;281(15):1401–1406. doi: 10.1001/jama.281.15.1401. [DOI] [PubMed] [Google Scholar]
- 36.Haroutunian V, Purohit DP, Perl DP, et al. Neurofibrillary tangles in nondemented elderly subjects and mild Alzheimer disease. Arch Neurol. 1999;56(6):713–718. doi: 10.1001/archneur.56.6.713. [DOI] [PubMed] [Google Scholar]
- 37.Haroutunian V, Davies PJ, Vianna C, Buxbaum JD, Purohit DP. Tau protein abnormalities associated with the progression of Alzheimer disease type dementia. Neurobiol Aging. 2007;28(1):1–7. doi: 10.1016/j.neurobiolaging.2005.11.001. [DOI] [PubMed] [Google Scholar]
- 38.Mirra SS, Heyman A, McKeel D, et al. The Consortium to Establish a Registry for Alzheimer's Disease (CERAD), part II: standardization of the neuropathologic assessment of Alzheimer's disease. Neurology. 1991;41(4):479–486. doi: 10.1212/wnl.41.4.479. [DOI] [PubMed] [Google Scholar]
- 39.Katsel P, Davis KL, Haroutunian V. Variations in myelin and oligodendrocyte-related gene expression across multiple brain regions in schizophrenia: a gene ontology study. Schizophr Res. 2005;79(2-3):157–173. doi: 10.1016/j.schres.2005.06.007. [DOI] [PubMed] [Google Scholar]
- 40.Katsel P, Davis KL, Gorman JM, Haroutunian V. Variations in differential gene expression patterns across multiple brain regions in schizophrenia. Schizophr Res. 2005;77(2-3):241–252. doi: 10.1016/j.schres.2005.03.020. [DOI] [PubMed] [Google Scholar]
- 41.Katsel P, Li C, Haroutunian V. Gene expression alterations in the sphingolipid metabolism pathways during progression of dementia and Alzheimer's disease: a shift toward ceramide accumulation at the earliest recognizable stages of Alzheimer's disease? Neurochem Res. 2007;32(4-5):845–856. doi: 10.1007/s11064-007-9297-x. [DOI] [PubMed] [Google Scholar]
- 42.Bolstad BM, Irizarry RA, Astrand M, Speed TP. A comparison of normalization methods for high density oligonucleotide array data based on variance and bias. Bioinformatics. 2003;19(2):185–193. doi: 10.1093/bioinformatics/19.2.185. [DOI] [PubMed] [Google Scholar]
- 43.Irizarry RA, Hobbs B, Collin F, et al. Exploration, normalization, and summaries of high density oligonucleotide array probe level data. Biostatistics. 2003;4(2):249–264. doi: 10.1093/biostatistics/4.2.249. [DOI] [PubMed] [Google Scholar]
- 44.Klipper-Aurbach Y, Wasserman M, Braunspiegel-Weintrob N, et al. Mathematical formulae for the prediction of the residual beta cell function during the first two years of disease in children and adolescents with insulin-dependent diabetes mellitus. Med Hypotheses. 1995;45(5):486–490. doi: 10.1016/0306-9877(95)90228-7. [DOI] [PubMed] [Google Scholar]
- 45.Livak KJ, Schmittgen TD. Analysis of relative gene expression data using real-time quantitative PCR and the 2(-Delta Delta C(T)) method. Methods. 2001;25(4):402–408. doi: 10.1006/meth.2001.1262. [DOI] [PubMed] [Google Scholar]
- 46.Näslund J, Haroutunian V, Mohs R, et al. Correlation between elevated levels of amyloid beta-peptide in the brain and cognitive decline. JAMA. 2000;283(12):1571–1577. doi: 10.1001/jama.283.12.1571. [DOI] [PubMed] [Google Scholar]
- 47.Kelley KA, Ho L, Winger D, et al. Potentiation of excitotoxicity in transgenic mice overexpressing neuronal cyclooxygenase-2. Am J Pathol. 1999;155(3):995–1004. doi: 10.1016/S0002-9440(10)65199-1. [DOI] [PMC free article] [PubMed] [Google Scholar]
- 48.Skurk C, Maatz H, Kim HS, et al. The Akt-regulated forkhead transcription factor FoxO3a controls endothelial cell viability through modulation of the caspase-8 inhibitor FLIP. J Biol Chem. 2004;279(2):1513–1525. doi: 10.1074/jbc.M304736200. [DOI] [PubMed] [Google Scholar]
- 49.Qin W, Ho L, Pompl PN, et al. Cyclooxygenase (COX)-2 and COX-1 potentiate beta-amyloid peptide generation through mechanisms that involve gamma-secretase activity. J Biol Chem. 2003;278(51):50970–50977. doi: 10.1074/jbc.M307699200. [DOI] [PubMed] [Google Scholar]
- 50.Qin W, Yang T, Ho L, et al. Neuronal SIRT1 activation as a novel mechanism underlying the prevention of Alzheimer disease amyloid neuropathology by calorie restriction. J Biol Chem. 2006;281(31):21745–21754. doi: 10.1074/jbc.M602909200. [DOI] [PubMed] [Google Scholar]
- 51.Burns M, Gaynor K, Olm V, et al. Presenilin redistribution associated with aberrant cholesterol transport enhances beta-amyloid production in vivo. J Neurosci. 2003;23(13):5645–5649. doi: 10.1523/JNEUROSCI.23-13-05645.2003. [DOI] [PMC free article] [PubMed] [Google Scholar]
- 52.Rezai-Zadeh K, Shytle D, Sun N, et al. Green tea epigallocatechin-3-gallate (EGCG) modulates amyloid precursor protein cleavage and reduces cerebral amyloidosis in Alzheimer transgenic mice. J Neurosci. 2005;25(38):8807–8814. doi: 10.1523/JNEUROSCI.1521-05.2005. [DOI] [PMC free article] [PubMed] [Google Scholar]
- 53.Wang J, Ho L, Qin WP, et al. Caloric restriction attenuates beta-amyloid neuropathology in a mouse model of Alzheimer's disease. FASEB J. 2005;19(6):659–661. doi: 10.1096/fj.04-3182fje. [DOI] [PubMed] [Google Scholar]
- 54.Qin W, Chachich M, Lane M, et al. Calorie restriction attenuates Alzheimer's disease type brain amyloidosis in Squirrel monkeys (Saimiri sciureus) J Alzheimers Dis. 2006;10(4):417–422. doi: 10.3233/jad-2006-10411. [DOI] [PubMed] [Google Scholar]
- 55.Sandri M, Lin J, Handschin C, et al. PGC-1alpha protects skeletal muscle from atrophy by suppressing FoxO3 action and atrophy-specific gene transcription. Proc Natl Acad Sci U S A. 2006;103(44):16260–16265. doi: 10.1073/pnas.0607795103. [DOI] [PMC free article] [PubMed] [Google Scholar]
- 56.Qin W, Zhao W, Ho L, et al. Regulation of forkhead transcription factor FoxO3a contributes to calorie restriction-induced prevention of Alzheimer's disease-type amyloid neuropathology and spatial memory deterioration. Ann N Y Acad Sci. 2008;1147:335–347. doi: 10.1196/annals.1427.024. [DOI] [PMC free article] [PubMed] [Google Scholar]
- 57.Gandy S. Molecular basis for anti-amyloid therapy in the prevention and treatment of Alzheimer's disease. Neurobiol Aging. 2002;23(6):1009–1016. doi: 10.1016/s0197-4580(02)00125-2. [DOI] [PubMed] [Google Scholar]
- 58.Selkoe DJ. Amyloid β-protein and the genetics of Alzheimer's disease. J Biol Chem. 1996;271(31):18295–18298. doi: 10.1074/jbc.271.31.18295. [DOI] [PubMed] [Google Scholar]
- 59.Landreth G. PPARgamma agonists as new therapeutic agents for the treatment of Alzheimer's disease. Exp Neurol. 2006;199(2):245–248. doi: 10.1016/j.expneurol.2006.04.006. [DOI] [PubMed] [Google Scholar]
- 60.Lagouge M, Argmann C, Gerhart-Hines Z, et al. Resveratrol improves mitochondrial function and protects against metabolic disease by activating SIRT1 and PGC-1alpha. Cell. 2006;127(6):1109–1122. doi: 10.1016/j.cell.2006.11.013. [DOI] [PubMed] [Google Scholar]


