Abstract
Understanding the mechanism and fidelity of transcription by the RNA polymerase (RNAP) requires measurement of the dissociation constant (Kd) of correct and incorrect NTPs and their incorporation rate constants (kpol). Currently, such parameters are obtained from radiometric-based assays that are both tedious and discontinuous. Here, we report a fluorescence-based assay for measuring the real time kinetics of single nucleotide incorporation during transcription elongation. The fluorescent adenine analog, 2-aminopurine (2AP), was incorporated at various single positions in the template or the nontemplate strand of the promoter-free elongation substrate. Upon addition of the correct NTP to the T7 RNAP-DNA, the 2AP fluorescence increased rapidly and exponentially with rate constant similar to the RNA extension rate obtained from the radiometric assay. The fluorescence stopped-flow assay, therefore, provides a high throughput way to measure the kinetic parameters of RNA synthesis. Using this assay, we report the kpol and Kd of all four correct NTP additions by T7 RNAP, which showed a range of values from 145 – 190 s-1 and 28 – 124 μM, respectively. The fluorescent elongation substrates were used to determine the misincorporation kinetics as well, which showed that T7 RNAP discriminates against incorrect NTP both at the nucleotide binding and the incorporation steps. The fluorescence-based assay should be generally applicable to all DNA-dependent RNAP as they use similar elongation substrates and it can be used to elucidate the mechanism, fidelity, and sequence dependency of transcription as well as a rapid means to screen for inhibitors of RNAPs for therapeutic purposes.
Keywords: 2-Aminopurine fluorescence, real-time kinetics, single nucleotide incorporation, T7 RNA polymerase, transcription elongation
Introduction
Transcription is catalyzed by the DNA-dependent RNA polymerase (RNAP) in two stages – initiation and elongation. During the initiation phase, the RNAP binds to a specific promoter sequence on the genomic DNA to initiate de novo RNA synthesis from NTPs. This initial phase of transcription is slow, nonprocessive, and characterized by the production of abundant short abortive RNA products 1-4. RNA synthesis becomes fast and processive after 9-12 nt RNA synthesis, when the RNAP escapes the promoter to enter into the elongation phase 4-6. For accurate and timely gene expression, it is crucial that the RNAP transcribes the genomic DNA with a high fidelity and makes the RNA message efficiently. To measure the efficiency of RNA synthesis and its fidelity, it is necessary to determine the single nucleotide incorporation rate constants using presteady state kinetic methods. Compared to the wealth of information on the transient kinetic mechanism and fidelity of DNA synthesis 7-10, there are only a few kinetic measurements of the RNAPs that provide the fundamental knowledge to assess the efficiency and fidelity of the transcription reaction 11-14.
Kinetic studies of RNA synthesis during the elongation phase have been hampered by the necessity to go through the initiation steps at the promoter 15. Since transcription initiation is slow and nonprocessive, the reaction becomes asynchronous by the time the RNAP reaches elongation. This problem has been overcome by the discovery that RNAPs can bind to promoter-free RNA:DNA hybrid substrates that support RNA elongation with a high efficiency 16-21. Biochemical studies including crystal structures have shown that the single subunit T7 RNAP binds to the promoter-free RNA:DNA elongation substrates in its transformed elongation conformational state 13; 16-18. The promoter-free RNA:DNA has served as an efficient elongation substrate to quantitatively measure the elementary rate constants of UTP addition by T7 RNAP 13.
Thus far, kinetic measurements of RNA elongation have been carried out using a radiolabeled RNA and monitoring its elongation using rapid chemical quenched-flow methods 11-14. Although the radiometric assay is robust, it is tedious and measures RNA synthesis in a discontinuous manner, which is not conducive to high throughput analysis of enzyme kinetics. A real time fluorescence-based assay with the ability to measure the kinetics of single nucleotide addition would overcome these limitations of the radiometric assay and facilitate in depth studies of the mechanism and fidelity of transcription under various DNA sequence contexts and reaction conditions. Currently there are no high through put assays to measure single nucleotide incorporation kinetics by RNAPs.
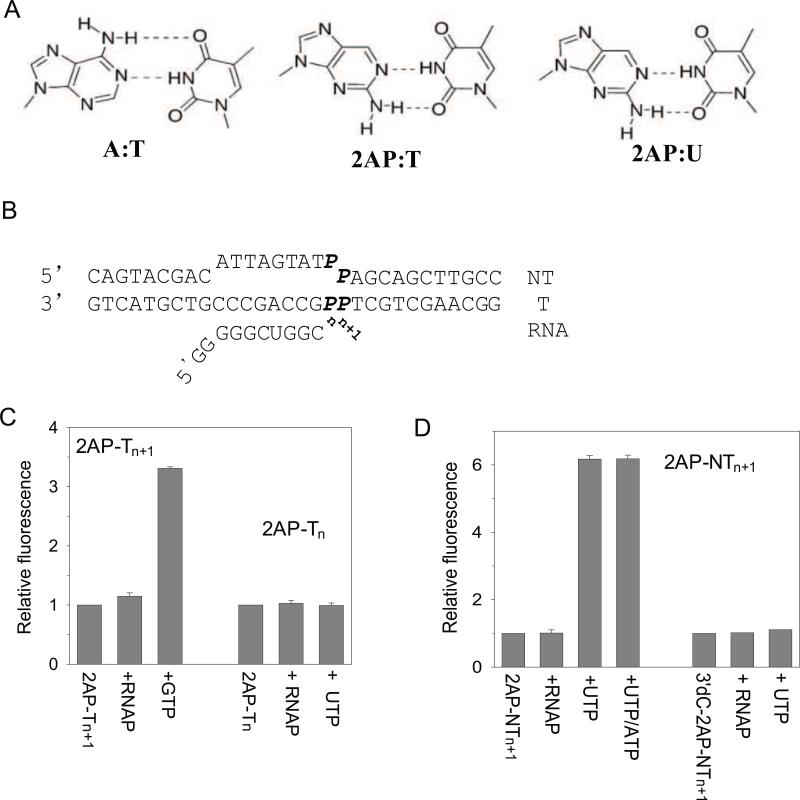
In this paper, we report a fluorescence-based assay to measure the kinetics of single nucleotide addition by T7 RNAP based on 2-aminopurine (2AP) fluorescence The 2AP is a fluorescent base analog of adenine that can form two hydrogen bonds with thymine or uridine with minimal interference to the duplex DNA stability (Fig. 1A). The fluorescence of 2AP is sensitive to base stacking interactions with the neighboring bases, a property used extensively to quantify the kinetics and thermodynamics of open complex formation by RNAP during initiation 14; 22-24 and to measure the kinetics of nucleotide addition by DNA polymerases 25-29. A previous study has shown that a pair of 2AP placed in the elongation substrate can report on the RNA elongation reaction by T7 RNAP 30. Here, we have investigated if a single 2AP placed at an appropriate position in the elongation substrate can monitor the kinetics of RNA elongation by one nucleotide. To find the site for 2AP incorporation that is most sensitive to the RNA synthesis step, we investigated several elongation substrates where a single 2AP was placed at a defined position around the NMP incorporation site. Using this approach, we have identified elongation substrates that serve as fluorogenic substrates for investigating the kinetics of RNAP-catalyzed transcription elongation in real time. Since single- and multi-subunit RNAPs use similar elongation substrates to catalyze RNA elongation 16; 19-20; 31-32, it is likely that these substrates will serve as general fluorogenic elongation substrates for high throughput screening of inhibitors and regulators of the RNAPs.
Fig.1. 2-Aminopurine modified elongation substrates and their fluorescence properties with and without T7 RNAP and NTP.
(A) A:T base pair compared to 2AP:T and 2AP:U base pairs. (B) The elongation substrate showing the positions where a single 2AP was incorporated (denoted as P). (C) 2AP fluorescence was collected over 360-400nm with excitation at 310 nm and the intensity was normalized to that of individual 2AP-contained free elongation substrate. Relative fluorescence are shown for substrates alone with 2AP at Tn+1 or Tn (200nM C/2AP-Tn+1 or 2AP/2AP-Tn, with T7 RNAP (400nM), and with RNAP and the next correct NTP (400 μM). (D) Relative fluorescence of substrate with 2AP at NTn+1 (200nM A/2AP-NTn+1), with T7 RNAP, and with RNAP and UTP, UTP + ATP, or the incorrect CTP (400 μM each). The 3’-dC-SC1A contains a 3’-deoxyCMP (3’-dC) base at the 3’-terminus of the RNA primer.
Results
Substrate design for the fluorescence-based elongation assay
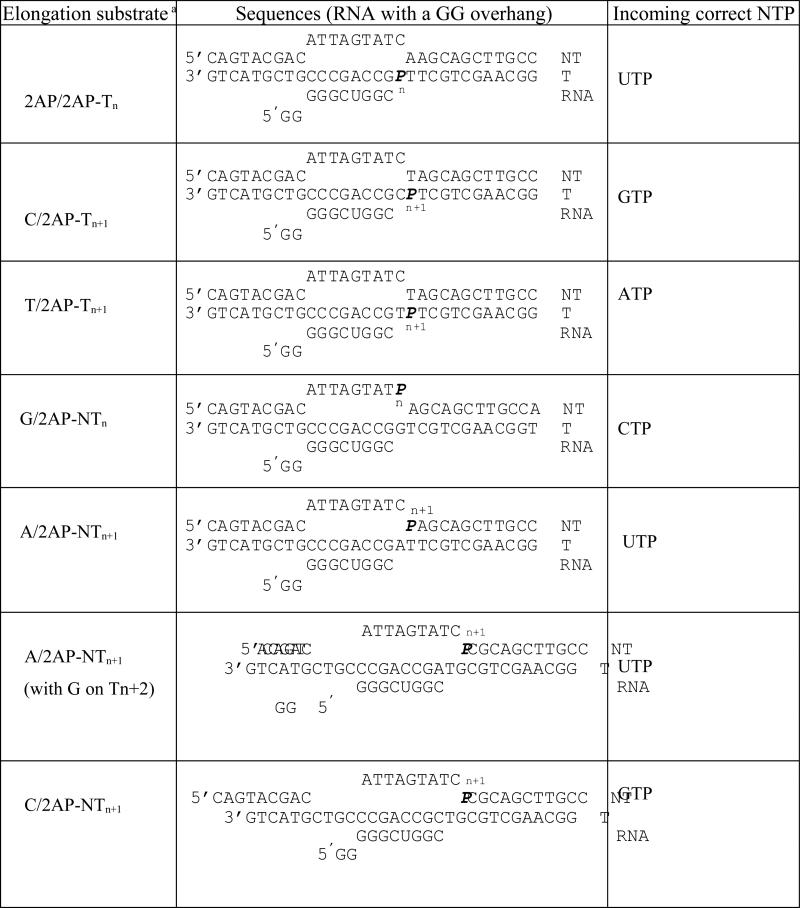
A minimal promoter-free elongation substrate was made by annealing two DNA strands to create a preformed 9-bp bubble to which a short RNA was annealed (Table 1, Fig. 1B). A single 2AP was placed either in the template (T) or in the non-template (NT) strand at selected positions. In the T strand, the 2AP was placed at the n-position (where the incoming NTP base pairs, Tn) or in the n+1 position (Tn+1). In the NT strand, 2AP was placed in the position complementary to the Tn or Tn+1 (NTn or NTn+1, respectively).
Table 1.
Sequences of the elongation substrates with 2AP substitution
|
Changes in the steady-state 2AP fluorescence upon binding to T7 RNAP and NTP
The 2AP-modified elongation substrates were analyzed first by measuring their fluorescence intensities after adding T7 RNAP and NTP. Mixing T7 RNAP with the 2AP-modified elongation substrates did not change the fluorescence intensity of 2AP in any of the substrates (Fig. 1C and D). However, fluorescence changes were observed in most cases when a correct NTP was added to 2AP-modified elongation substrate and T7 RNAP (Fig.1C and D). The large fluorescence change upon NTP addition to 2AP-NTn+1 was abolished when the RNA primer contained a 3'-deoxycytidine (3’-dC) that cannot be elongated (Fig. 1D). The substrate 2AP/2AP-Tn (2-AP in the template at n-position, Table 1) showed no fluorescence change upon addition of UTP (Fig. 1C). This was surprising as we had expected that the 2AP when placed at the n-position would provide sensitive fluorescence changes, because the incoming UTP forms a base pair with 2AP directly and enhances base stacking 18. Thus, it is difficult to predict, simply from the crystal structures, the exact sites in the T or the NT strand that will provide large 2AP fluorescence changes upon NTP binding and incorporation.
Fluorescent 2AP in the template strand monitors the kinetics of NMP incorporation
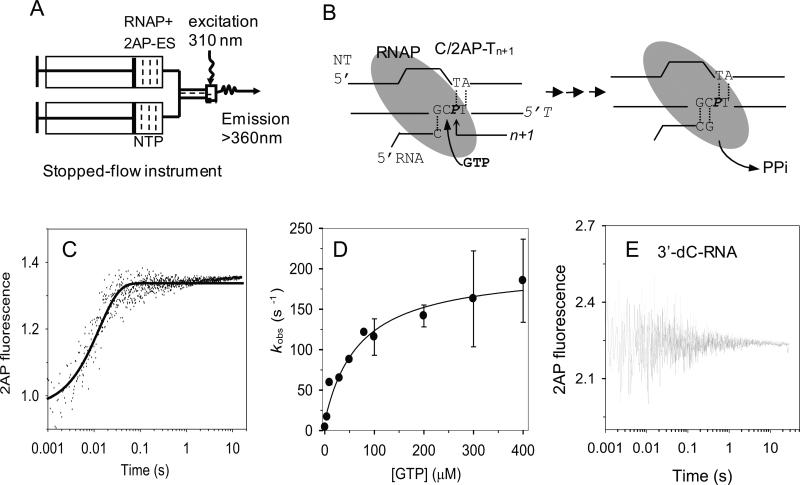
Stopped-flow fluorescence assays were designed to measure the kinetics of single nucleotide incorporation by T7 RNAP. A pre-formed complex of C/2AP-Tn+1 (Table 1) (200 nM) and T7 RNAP (400 nM) was rapidly mixed in a stopped-flow instrument with the correct nucleotide GTP at 1 μM to 400 μM (Fig. 2A). The 2AP fluorescence was recorded from 2 msec to 60 s 33. A representative time trace of 2AP fluorescence change is shown at 50 μM GTP (Fig. 2C) and fit to a single exponential equation (Eq. 1). The single exponential rate constants (kobs) were plotted against [GTP] (Fig. 2D) and the hyperbolic dependence was fit to equation 2 to derive the maximum rate constant of GTP incorporation, kpol = 190 ± 10 s-1, and a ground-state GTP dissociation constant, Kd = 70 ± 10 μM. The kpol/Kd = 2.7 μM-1s-1 is the efficiency of GMP incorporation into RNA during elongation
Fig. 2. Elongation substrate with 2AP in the template strand monitors the kinetics of GMP incorporation.
(A) The general scheme of the stopped-flow experimental set up consisted of loading a mixture of T7 RNAP (400 nM) and 2AP-labeled elongation substrate (200nM) in one syringe and NTP in the second syringe. The two solutions were rapidly mixed to initiate the RNA synthesis reaction. The mixed sample was excited with 310 nm light and fluorescence was measured at >360 nm. (B) The elongation substrate (C/2AP-Tn+1) contained a 2AP (P) in the template strand at n+1 position. The C in the template at position n will base pair with GTP. Upon GTP addition, the RNAP moves into the new position where 2AP occupies the n position. (C) Representative time trace at 50 μM GTP shows a single exponential increase (smooth curve) in 2AP fluorescence with kobs = 77 ± 4 s-1. (D) GTP concentration dependence of the observed rate constant (kobs) fit to a hyperbolic function (Eq. 2) with a maximum rate constant kpol = 190 ± 10 s-1 and ground-state dissociation constant Kd = 70 ± 10 μM. Error bars encompass high and low values from duplicate measurements. (E) C/2AP-Tn+1 substrate with 3’-dC-RNA primer did not show a fluorescence change upon mixing with GTP (200 μM).
To determine whether the increase in 2AP fluorescence was caused by GTP binding or by the GMP incorporation reaction, we substituted the 3'-end of the RNA primer with 3'-dC that lacks the 3'-OH required for polymerization. No fluorescence increase was observed with this 3'-dC elongation substrate upon addition of the correct GTP (Fig. 2E). These results indicate that the observed 2AP fluorescence increase results from the GMP incorporation step or steps beyond.
Changing the template base opposite to the NMP incorporation position (position n) from dC to dT (T/2AP-Tn+1, Table 1) allowed measurement of AMP incorporation. The analysis indicated that AMP is incorporated into the same RNA primer with kpol = 145 ± 5 s-1, Kd = 71 ± 11 μM and kpol/Kd = 2.0 μM-1s-1 (Table 2).
Table 2.
Kinetic parameters of single correct NTP addition during T7 RNAP elongation
| rNTP:template base | kpol (s-1) | Kd (μM) | kpol/Kd (μM-1.s-1) | Elongation substrate |
|---|---|---|---|---|
| G:dC | 190 ± 10 | 70 ± 10 | 2.7 | C/2APTn+1 |
| 3'-dG:dC | 45 ± 9 | 25 ±4 | 1.8 | |
| G:dC | 178 ± 15 | 52 ± 17 | 3.4 | C/2AP-NTn+1 |
| A:dT | 145 ± 5 | 71 ± 11 | 2.0 | T/2AP-Tn+1 |
| C:dG | 209 ± 27 | 30 ± 13 | 7.5 | G/2AP-NTn |
| U:dA | 192 ± 20 | 98 ± 22 | 2.0 | A/2AP-NTn+1 |
| 251 ± 23a | 133 ± 20a | 1.9a | ||
| 3'-dU:dA | 235 ± 28 | 185 ± 64 | 1.3 | |
| U:dA | 187 ± 22 | 124 ± 50 | 1.5 | A/2AP-NTn+1 (G-Tn+2) |
From the rapid chemical quenched-flow measurements.
Fluorescent 2AP in the nontemplate strand monitors the kinetics of NMP incorporation
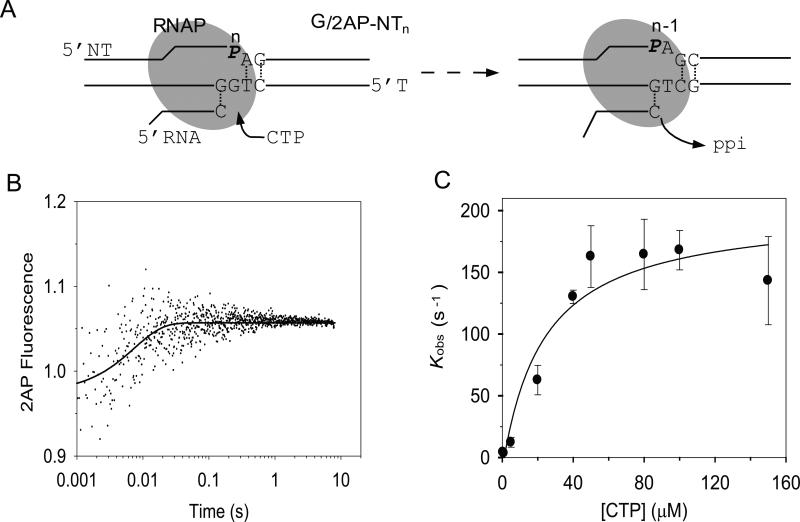
There is a distinct advantage to having the 2AP probe in the NT strand of the elongation substrate rather than in the T strand. A base analog in the NT strand is less likely to perturb the nucleotide incorporation kinetics. We therefore investigated the kinetics of nucleotide incorporation with the elongation substrates containing 2AP in the n or n+1 position in the NT strand. Addition of the correct CTP to G/2AP-NTn and T7 RNAP (Fig. 3) resulted in a small increase in 2AP fluorescence, which was monitored as a function of time in the stopped-flow instrument (Fig.3B). The kinetics fit well to a single exponential equation, and the kobs increased with increasing [CTP] in a hyperbolic manner to provide kpol of 209 ± 27 s-1, Kd of 30 ± 13 μM, and kpol/Kd = 6.9 μM-1s-1 (Fig. 3C).
Fig. 3. Elongation substrate with 2AP in the nontemplate strand monitors the kinetics of CMP incorporation.
(A) The G/2AP-NTn elongation substrate contains a 2AP in the NT at the n-position and correctly base pairs with CTP. (B) A representative time trace of 2AP fluorescence change at 40 μM CTP (200nM G/2AP-NTn) and 400 nM T7 RNAP). The experimental data fit well to a single exponential equation (Eq.1) (solid line) with kobs= 136 ± 24 s-1. (D) The kobs increased with increasing [CTP] and fit to a hyperbola (Eq. 2) with a maximum rate constant kpol = 209 ± 27 s-1 and Kd = 28 ± 13 μM. Error bars indicate the high and low values from duplicate measurements.
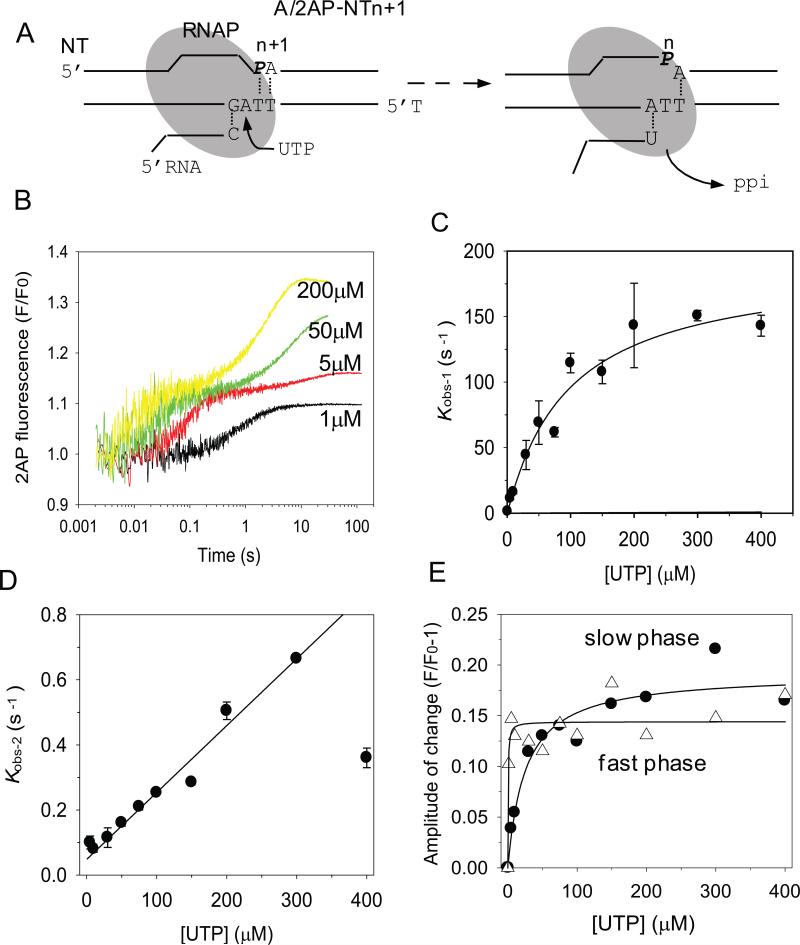
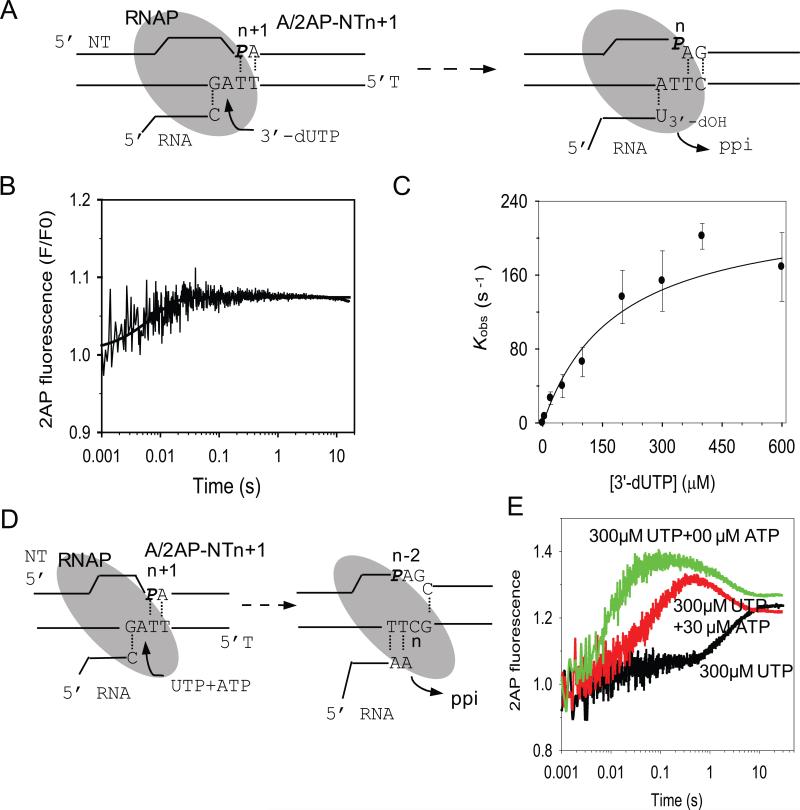
When similar experiments were carried out with A/2AP-NTn+1, where UTP is the correct nucleotide to be added (Fig. 4A), two phases of fluorescence changes were observed. Four representative time traces of 2AP fluorescence changes at selected [UTP] are shown in Figure 4B. At low UTP concentrations (1 μM), the time-dependent 2AP fluorescence change fit well to a single exponential equation. Above 5 μM, the kinetics fit to the sum of two exponentials. The fast increase in 2AP fluorescence was followed by a 200-fold slower increase (Fig. 4B).
Fig. 4. Stopped-flow kinetics of multiple UMP incorporation.
(A) The A/2AP-NTn+1 contains 2AP in the NT strand at n+1 position and correctly base pairs with UTP. (B) Representative time traces of 2AP fluorescence changes upon adding UTP (1, 5, 50, and 200 μM, final concentrations) shows multiple kinetic phases. (C) The kobs-1 of the fast phase increases with [UTP] in a hyperbolic manner with kpol-1 = 192 ± 20 s-1 and Kd-1 = 98 ± 22 μM. Error bars indicate standard deviation from multiple measurements. (D) UTP concentration dependence of the slower phase, kobs-2 shows a linear dependence with slope = 0.002 μM-1s-1 representing kpol-2/Kd-2 ratio (D) UTP concentration dependence of the fast (open triangle) and slow phase (filled circle) amplitudes of 2AP fluorescence changes fit to the hyperbolic equation (Eq.2) with Kd,net = 0.3 μM for correct UMP:dA incorporation and Kd,net2 = 32 μM for UMP:dA misincorporation .
The observed rate constants for the fast and slow phases, kobs-1 and kobs-2, and their corresponding amplitudes of 2AP fluorescence changes were plotted against [UTP] (Fig. 4B-D). The kobs-1 increased with [UTP] in a hyperbolic manner providing a maximal rate constant kpol-1 = 192 ± 20 s-1, Kd-1 = 98 ± 22 μM, kPol/Kd = 2.0 μM-1s-1. These kinetic parameters are very close to those measured for other correct NTP addition reactions, described above. The amplitude of the fast fluorescence change saturated after 5 μM UTP (Fig.4D) demonstrating a tight net binding affinity of UTP (Kd-net1 ~ 0.5 μM) resulting from forward favorable steps of chemistry and product release beyond the collision complex with UTP (Kd-net1 = Kd-1/(1+K2+K2K3), K2 and K3 are the equilibrium constants of conformational change and chemistry) 34.
The rate constant of the slow phase (kobs-2) increased with [UTP] linearly with a slope = 0.0018 μM-1.s-1 (Fig. 5C). Since, kobs-2 did not saturate in the range of [UTP] examined, we could not obtain the individual kpol-2 and Kd-2 values. However, the slope represents the ratio of kpol-2/Kd-2, which was 1000-fold slower that the kpol-1/Kd-1 of the first phase (192/98 = 1.96 μM-1.s-1). The amplitude of the second phase increased hyperbolically with increasing [UTP] as compared to the first phase and indicates a 60-fold weaker net dissociation constant Kd-net2 = 32 μM.
Fig. 5. Fluorescence measurements supporting the slow phase of UMP:dA misincorporation.
(A) Measurement of 3’-dUMP incorporation in A/2AP-NTn+1. (B) A representative time course of 2AP fluorescence change at 50 μM 3’-dUTP fits to a single exponential kobs = 39 s-1. (C) 3’-dUTP concentration dependence of kobs fits to a hyperbola with kpol = 235 ± 28 s-1 and Kd = 185 ± 64 μM. Error bars encompass the high and low values from duplicate measurements. (D) Measurement of successive UMP and AMP incorporation in A/2AP-NTn+1. (E) Representative time traces show multiple 2AP fluorescence changes with 300μM UTP alone (black trace), UTP + 30μM ATP (red trace), and UTP + 300 μM ATP (green trace).
We hypothesize that the second slow phase observed at >5μM UTP at extended reaction times arises from the misincorporation of UMP. To test this hypothesis, we used 3’-dUTP as the nucleotide substrate instead of UTP to stop synthesis after one nucleotide addition (Fig. 5A). Consistent with our hypothesis, only a single fast phase of 2AP fluorescence increase was observed upon addition of 3’-dUTP (Fig. 5B). As compared to UTP, the 3’-dUTP binds with a two-fold weaker affinity with Kd =185 ± 64 μM and is incorporated with a maximum rate constant kpol = 235 ± 28 s-1 and kpol/Kd = 1.3 μM-1s-1 (Fig. 5C), which is similar to UMP incorporation. The amplitude of 2AP fluorescence change was also 20-40% percent of the change observed after UTP additions and saturated yielding a tight net binding with Kd, net ~ 5μM.
When experiments were conducted with a mixture of UTP and ATP that can correctly base pair to n, n+1, and n+2 of the A/2AP-NTn+1 substrate (Fig. 5D), the initial fast phase remained unchanged, but the slower phase was replaced by a faster phase (Fig. 5E). In addition, a late time period fluorescence decrease was observed that brought the fluorescence intensity back to the same level of adding UTP alone. This is consistent with the changes measured under steady state conditions with UTP and UTP + ATP (Fig. 1D). The fluorescence decrease occurred with rate constant (0.4-0.5 s-1), which is equal to the UMP misincorporation reaction at 300 μM UTP, suggesting that the fluorescence decrease is monitoring the UMP misincorporation reaction opposite C at n+3 after UMP and AMP correct incorporations. These results indicate that multiple RNA extension cycles can be measured by following 2AP fluorescence changes in modified elongation substrates.
Kinetics of UTP incorporation by radiometric quenched-flow assay
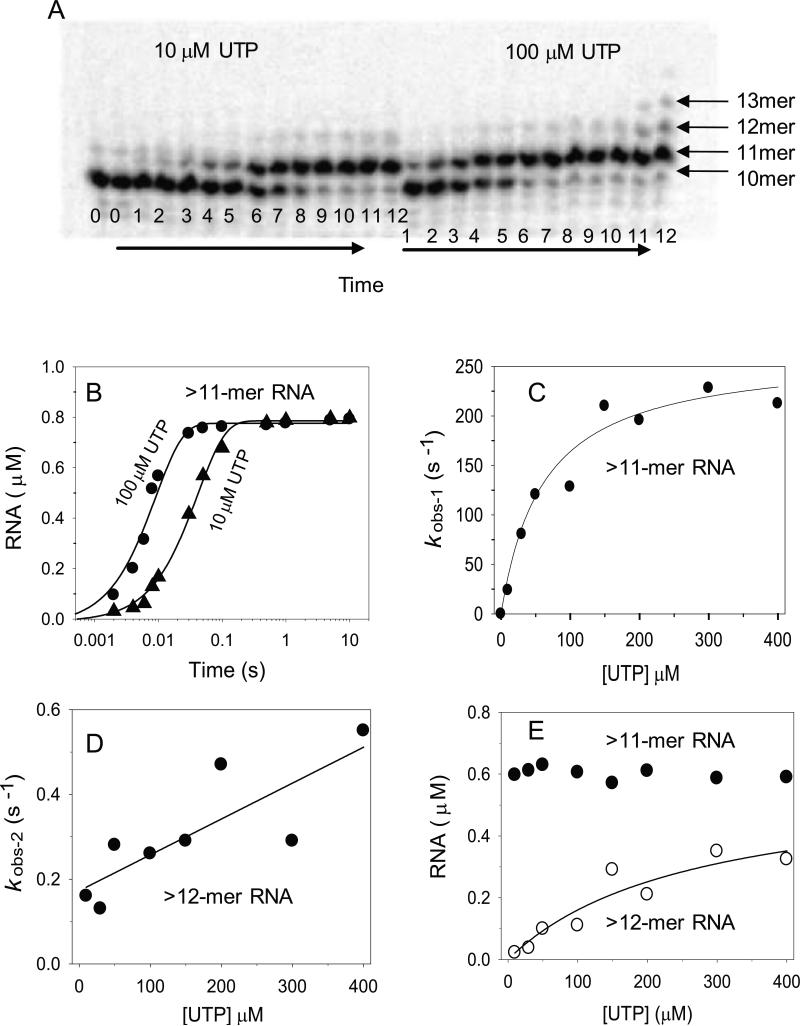
The complex kinetics of UMP incorporation in the 2AP-NTn+1 substrate was further investigated by the radiometric assay of transcription elongation 13. The time course of extension of the 32P-labeled 10-mer RNA primer in the NTn+1 elongation substrate was measured at various [UTP] from 10 to 400 μM. A representative sequencing gel at 10 or 100 μM UTP (Fig. 6A) shows the starting RNA 10-mer being elongated to the major product 11-mer RNA after a single UMP incorporation reaction. In addition to the major 11-mer RNA product, we observed 12-mer and 13-mer RNAs after longer reaction times (>1s) and at higher UTP concentrations (>10 μM UTP). These longer RNA products are made by successive events of UMP misincorporation to the 11-mer RNA.
Fig. 6. UMP incorporation during RNA synthesis measured by the radiometric assay.
(A) The polyacrylamide sequencing gels show 10-mer RNA elongated to 11-13 mer RNAs with increasing reaction times. Lanes 0-12 represent reaction times from 0, 2, 4, 6, 8, 10, 30, 50, 100, 500 msec, and 1, 5, 10 s at 10 μM (right side) or 100 μM (left side) UTP. (B) The kinetics of 11-13 mer RNA formation at UTP concentrations of 10μM (filled circles) and 100 μM (filled triangles) were fit to a single exponential equation (Eq.1) with kobs = 24 s-1 and 113 s-1, respectively. (C) UTP concentration dependence of kobs for correct UMP incorporation fit to the hyperbolic function (Eq. 2) with kpol = 251 ± 23 s-1 and Kd = 133 ± 20 μM. (D) UTP concentration dependence of the kobs for rU:dA misincorporation fits to a line with slope = 0.001 μM-1.s-1. (E) UTP concentration dependence of the amplitudes of correct (filled circle) and incorrect (open circle) UMP incorporation. A net dissociation constant for UMP misincorporation (Kd,net-mis= 263 μM) was derived from the hyperbolic fitting.
The kinetics of correct UMP addition was determined by plotting the amount of total RNA at each [UTP] as a function of time (Fig. 6B). The kinetics of incorrect UMP addition was determined by plotting >11-mer RNA at each [UTP] as a function of time (Fig. 6B). Each of the kinetics was fit to a single exponential equation (Eq.1) to determine the rate constants for correct (kobs-1) (Fig. 6C) and incorrect UMP (kobs-2) additions (Fig. 6D). The kobs1 of correct addition versus [UTP] fit to the hyperbolic equation (Eq.2) with kpol-1 = 251 ± 23 s-1, UTP Kd-1= 133 ± 20 μM, and kpol/Kd = 1.9 μM-1s-1, consistent with the values for correct UMP addition from the stopped-flow fluorescence assay described above (Fig. 4C). The [UTP] dependence of kobs-2, the rate constant of incorrect UMP addition, did not reach saturation. Linear fitting yielded a kpol-2/Kd-2 ~0.001 μM-1s-1 for rUMP:dT misincorporation (Fig. 6D). This value is consistent with the kpol/Kd of the second slow phase in the fluorescence-based assay, described above (Fig. 4D).
The amount of 11-mer RNA product after reaction completion was largely constant from10 to 400 μM UTP (Fig. 6E), which is consistent with the amplitudes of the fluorescence-based assay (Fig. 4F). The amount of >11-mer RNA after reaction completion depended on [UTP] (Fig. 6E) and increased in a hyperbolic manner yielding a net Kd-net2 = 263 μM. These radiometric assays confirm that the second slow phase in the fluorescence-based assay is due to UMP misincorporation reactions. Thus, the fluorescence-based assay provides a fast and sensitive means to measure both correct and incorrect NTP addition reactions of T7 RNAP.
Measurement of the nucleotide misincorporation kinetics
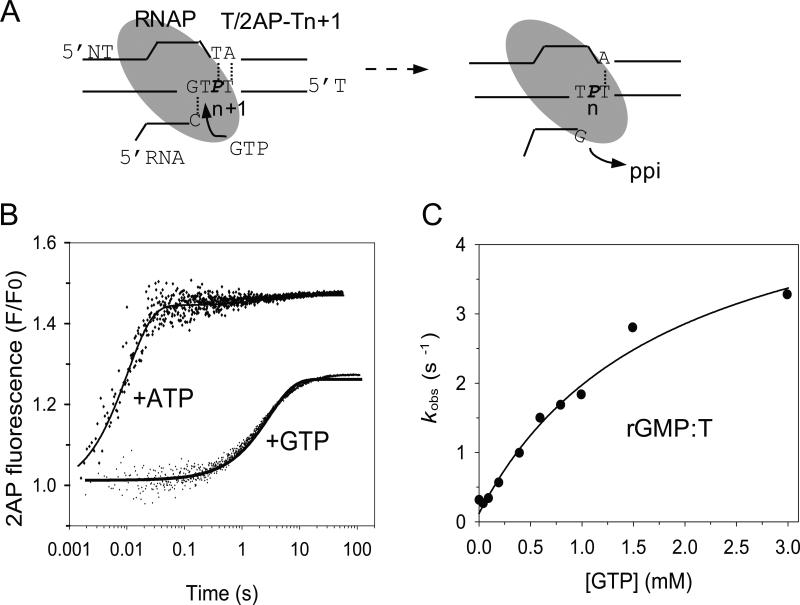
Next, we measured the kinetics of nucleotide misincorporation directly using the fluorescence-based stopped-flow assay. The T/2AP-Tn+1 (Table 1) elongation substrate contains a dT at the n-position (Fig. 7A) and adds the correct ATP at a rapid rate. To measure misincorporation, we added GTP to the reactions and observed a large fluorescence increase albeit at a slower rate (Fig. 7B). The 2AP fluorescence increase with GTP reached approximately 60% of the level observed with the correct ATP (Fig. 7B). Fitting the GTP concentration dependence of the observed rate constants, kobs, to the hyperbolic equation revealed a maximum rate constant kpol = 5.2 s-1 for GMP misincorporation against dT, Kd = 1.8 mM, and kpol/Kd = 0.0029 μM-1s-1 (Fig. 7C). Compared to the correct nucleotide ATP, the incorrect GTP binds ~25-fold more weakly and is incorporated with ~30 fold slower rate (Table 3). The results indicate that T7 RNAP discriminates against G:dT mismatch by ~720-fold ((kpol/Kd)ATP/(kpol/Kd)GTP), both by slower catalysis and weaker binding to the incorrect NTP. The kinetics of both correct and incorrect GMP incorporation was measured using the C/2AP-NTn+1 substrate in one experiment that showed two phases, whose rates increased with increasing [GTP]. The rate of the fast phase provided kpol = 178 s-1, Kd = 52 μM, and kpol/Kd = 3.4 μM-1s-1 for correct GMP incorporation (Table 2), and the rate of the slow phase provided kpol = 6.9 s-1, Kd = 3.9 mM, and kpol/Kd = 0.0018 μM-1s-1 for the rGMP:dT misincorporation reaction (Table 3).
Fig. 7. Stopped-flow fluorescence measurements of G:dT misincorporation.
(A) Addition of GTP to T/2AP-T results in rG:dT misincorporation. (B) Representative time traces of correct and incorrect NTP addition. The 2AP fluorescence increases upon adding the incorrect GTP (200 μM) with kobs = 0.6 s-1 and with the correct ATP (200 μM) with kobs = 100 s-1. (B) GTP concentration dependence of the misincorporation reaction rate constant fit to a hyperbola (Eq. 2) with kpol = 5.2 ± 0.6 s-1 and Kd = 1816 ± 483μM.
Table 3.
Kinetic parameters for single incorrect NTP addition during T7 RNAP elongation
| rNTP:template | kpol (s-1) | Kd (μM) | kpol/Kd (μM-1.s-1) | Discriminationa | Elongation substrate |
|---|---|---|---|---|---|
| U:dT | 0.001, 0.002b | 2000, 1000 | A/2AP-NTn+1c | ||
| 0.0015 | 1333 | A/2AP-NTn+1c (G-Tn+2) | |||
| G:dT | 5.2 ± 0.6 | 1816 ± 483 | 0.0029 | 690 | T/2AP-Tn+1 |
| 6.9 ± 0.7 | 3864 ± 754 | 0.0018 | 1111 | C/2AP-NTn+1c | |
Discrimination is calculated from (kpol/Kd)correct/ (kpol/Kd)incorrect.
From rapid chemical quenched-flow measurements.
From the slow phase of fluorescence change following the fast correct incorporation.
Discussion
We report a fluorescence-based assay that measures the pre-steady state kinetics of single nucleotide addition by T7 RNAP during the transcription elongation phase. This assay was developed using 2AP, a fluorescent adenine analog, whose fluorescence intensity is sensitive to base stacking-unstacking changes in DNA. Through experimentation, we have identified several positions in the elongation substrate that when modified with a single 2AP provide robust fluorescence changes for real time measurement of the kinetics of correct and incorrect nucleotide. Although the 2AP-based assay has been used to dissect the kinetic pathway of DNA polymerases 26-29; such high throughput fluorescence based assays are not available to measure the kinetics of single nucleotide addition by the DNA-dependent RNAPs.
The Kd and kpol are the two parameters that provide a quantitative measure of nucleotide affinity and incorporation into RNA. To obtain these parameters, the single turnover rates of nucleotide addition to the RNA are measured as a function of [NTP]. T7 RNAP assembles as an elongation complex on a synthetic substrates that contains an 8-bp RNA:DNA hybrid in a preformed transcription elongation bubble 16. A single 2AP was incorporated in these elongation substrates, either in the T or the NT strand of the DNA. In our synthetic mismatched elongation substrate, as RNA is synthesized, the upstream bases cannot reanneal. Thus, there is a concern that the measured rates of correct and incorrect nucleotides might be different from those with the matched substrate. We believe that this is less of a concern in our studies, because we are measuring the kinetics of single nucleotide incorporation, and RNA polymerases including T7 RNAP are competent in adding multiple nucleotides on mismatched elongation substrates 16; 19-20. The 2AP based approach can be applied to matched elongation substrates in future experiments to address this issue. We attempted to make predictions based on the available high resolution structures of the elongation complexes of T7 RNAP as to which position undergoes large stacking-unstacking changes upon nucleotide addition. However, contrary to our expectations, e.g., when 2AP was introduced at Tn, no measurable fluorescence change was observed (n is the position where the incoming NTP will base-pair). 2AP placed in the n-position in the primer/template substrates provide large fluorescence changes that have been used to measure the kinetics of DNA synthesis 26-28. We therefore chose a scanning approach, where we experimentally tested several positions for 2AP incorporation around the site of nucleotide incorporation.
The substrates with a single 2AP at NTn+1, NTn, or Tn+1 served as excellent fluorescent elongation substrates. The fluorescence intensities of these substrates showed an increase in fluorescence intensity with the addition of correct NTP to the RNA. Using 3'-deoxy RNA substrates, we show here that the fluorescence changes do not result from the NTP binding steps. We propose that the observed 2AP fluorescence changes arise from the chemical step or the PPi release/translocation step. From the kinetics of fluorescence change at various [NTP], we determined the kpol and Kd of all four correct NTP addition reactions by T7 RNAP (Table 2). We found that the kpol of correct nucleotide addition ranges from 145 – 190 s-1 and the Kd ranges from of 28 – 124 μM, respectively. The range of values indicates that nucleotide incorporation efficiency depends on the NTP added and the surrounding DNA sequence. Additional studies will be necessary to understand the sequence context of transcription efficiency.
The values from the fluorescence assay are consistent with the reported kpol and Kd of UTP addition opposite dA from the radiometry-based rapid quenched-flow assay13 and those measured in this paper using radiometric assays. Thus, the two assays, the fluorescence-based stopped-flow and radiometric-based quenched-flow, are measuring the same rate-limiting step. Previous studies have shown that the single nucleotide incorporation reaction by T7 RNAP is rate-limited either by the open-to-closed conformational transition of the enzyme upon NTP binding or by the chemical step, while PPi release and the coupled translocation was proposed to be faster 13. Because, we expect larger structural changes in the elongation substrate from the translocation step rather than the chemical step, we propose that the 2AP fluorescence changes are arising from steps after chemistry. In future studies, we hope to develop substrates that will measure the NTP binding steps.
The elongation substrate with 2AP at NTn+1 showed two phases upon nucleotide addition (UTP to A/2AP-NTn+1, or GTP to C/2AP-NTn+1). Using several experiments, we verified that the fast phase was due to correct UTP addition against dA in the template and the slow phase was due to misincorporation extension. The ability to resolve the fast and slow phases allows correct and incorrect misincorporation kinetics to be measured simultaneously in a single experiment, providing a powerful assay to investigate the misincorporation kinetics sensitive to sequence context15. We used some of the fluorescent elongation substrates to measure the misincorporation kinetics directly by adding an incorrect NTP instead of the correct one. These studies investigated the G:dT misincorporation reaction and showed that the incorrect GTP is added with 30-40 fold slower kpol as compared to the correct nucleotide, and the incorrect GTP Kd is 25-100 times greater than that of the correct NTP. This indicates that T7 RNAP discriminates against the incorrect NTP both at the binding and the nucleotide incorporation step. The kpol/Kd ratios of correct and incorrect nucleotide addition indicate that T7 RNAP discriminates against incorrect GTP addition ~1000 fold as compared to correct GTP addition. These studies indicate that the fluorescence-based assay is a highly suitable method for determining the misincorporation kinetics of a complete set of NTPs under various DNA:RNA sequence context. Such studies in the future with other misincorporations will be required to fully understand the fidelity of RNAP catalyzed transcription elongation reaction. The elongation substrate with 2AP at Tn+1 also showed a slow phase of 2AP fluorescence change, but the amplitude was not significant to allow accurate measurement of the misincorporation reaction (Fig. 2C and 7B). The much reduced amplitude was partly due to the insensitivity of 2AP at Tn after it was translocated from Tn+1. Hence, while 2AP at NTn+1, NTn, or Tn+1 can be used to separately measure correct and incorrect nucleotide incorporation, only 2AP at NTn+1 is optimal for simultaneously measuring both reactions in a single kinetic experiment.
In summary, the fluorescence-based RNA synthesis assay provides a quick and sensitive means to study the kinetics of single nucleotide incorporation and misincorporation during RNA elongation. The advantage of the fluorescence-based assay is the speed and the ability to measure RNA synthesis in real time that will allow high throughput analysis of sequence dependence of transcription. The RNAPs from phage to eucaryotes, despite having different structures and subunit composition, use similar RNA:DNA elongation substrates 16; 19-20; 31-32. The fluorescent elongation substrates should therefore serve as general substrates for all DNA-dependent RNAPs to study single nucleotide incorporation kinetics with high time resolution. Potentially, these substrates can be used to measure the kinetics of a specific step in the pathway of single nucleotide incorporation; thus, helping to dissect the complex elongation multi-step process. The assay can be used as a fast means of screening RNAP variants, nucleotide analogs, and small chemical inhibitors of RNA synthesis.
Material & Methods
Nucleic Acids, T7 RNAP, and Other Reagents
Untagged T7 RNAP was overexpressed in Escherichia coli strain BL21 and purified as described previously4. Oligodeoxynucleotides (Table 1) were custom synthesized from IDT (Coralville, IA) and purified on a 14% polyacrylamide/urea gel. RNA was purchased PAGE purified from Dharmacon Research Inc. (Lafayette, CO) and 2′-deprotected/desalted before use. In rapid chemical quench-flow assay, RNA was radiolabeled at the 5′-terminus using γ-32P-ATP and polynucleotide kinase. Unlabeled isotope was removed by Sephadex G50 gel filtration. The elongation substrate was assembled by mixing the template strand (T), non-template DNA (NT), and 5′-32P-labeled or unlabeled RNA in a 1:1.5:1 ratio in the transcription buffer at a final concentration of 20 μM and subjected to heating at 95 °C for 5 min and slowly cooling to 4 °C in 2 hr. The transcription buffer consisted of 50 mM Tris acetate, pH 7.5, 50 mM sodium acetate, 10 mM magnesium acetate, and fresh 2 mM dithiothreitol.
Stopped-flow Fluorescence Experiments
A mixture of 200 nM 2AP-labeled elongation substrate and 400 nM T7 RNAP in the transcription buffer was loaded in one syringe of the stopped-flow instrument and UTP in the other syringe. The two solutions were rapidly mixed at 25°C and 2AP fluorescence (using 370nm long-pass filter) was measured in real time after excitation at 310 nm 33. The kinetics of fluorescence increase was measured at various [NTP] ranging from 1 to 400 μM and fitted to single or double exponential equation:
| (1) |
Where F0 and Ft are the 2AP fluorescence intensity at time (t) zero, A is the amplitude of fluorescence change, and kobs is the observed rate constant. The observed rate constant, kobs, was plotted as a function of [NTP] and fit to Eq. 2:
| (2) |
Where Kd is the ground-state dissociation constant of the NTP upon binding to the T7 RNAP-elongation substrate complex, and kpol is the maximum rate constant of NMP incorporation measured by 2AP fluorescence changes or radiometry.
Rapid Chemical Quench-Flow Experiments
Pre-steady-state kinetic experiments was performed at 25 °C using a Model RQF-3 chemical quench-flow apparatus (KinTek Corp., Austin, TX) 13. The pre-formed complex of T7 RNAP-elongation substrate (1.5 μM: 0.75 μM, final) with 5’-32P-labeled RNA from syringe A was rapidly mixed with UTP (10-400 μM) from syringe B to initiate RNA synthesis. The reaction was terminated by mixing with 200 mM EDTA from syringe C after predefined time intervals. RNA products were resolved on a 7M ureadenatured sequencing gel consisting of 20% polyacrylamide-1.5% Bis-acrylamide. RNA was quantified on a Typhoon 9410 PhosphorImager (Amersham Biosciences) using the ImageQuaNT software (GE Healthcare). The fraction of RNA primer converted to products was determined from the ratio of their respective counts to the total counts, and the concentration of products was determined by multiplying the fraction with the concentration of the RNA primer. The kinetics was fit to Eq.1, with Ft standing for the fraction or molar amount of products, F0 is the y-intercept or background, A is the amplitude or the total amount of products formed during the reaction, and kobs is the observed rate constant of product formation. The observed rate, kobs, plotted as a function of [NTP] was fit to Eq.2 to derive the maximum rate constant of NMP incorporation, kpol, and an apparent dissociation constant Kd .
Acknowledgement
This work was supported by a NIH grant (GM51966) to S.S.P.
Footnotes
Publisher's Disclaimer: This is a PDF file of an unedited manuscript that has been accepted for publication. As a service to our customers we are providing this early version of the manuscript. The manuscript will undergo copyediting, typesetting, and review of the resulting proof before it is published in its final citable form. Please note that during the production process errors may be discovered which could affect the content, and all legal disclaimers that apply to the journal pertain.
REFERENCES
- 1.Gralla JD, Carpousis AJ, Stefano JE. Productive and abortive initiation of transcription in vitro at the lac UV5 promoter. Biochemistry. 1980;19:5864–9. doi: 10.1021/bi00566a031. [DOI] [PubMed] [Google Scholar]
- 2.Martin CT, Muller DK, Coleman JE. Processivity in early stages of transcription by T7 RNA polymerase. Biochemistry. 1988;27:3966–74. doi: 10.1021/bi00411a012. [DOI] [PubMed] [Google Scholar]
- 3.Villemain J, Guajardo R, Sousa R. Role of open complex instability in kinetic promoter selection by bacteriophage T7 RNA polymerase. J Mol Biol. 1997;273:958–77. doi: 10.1006/jmbi.1997.1358. [DOI] [PubMed] [Google Scholar]
- 4.Jia Y, Patel SS. Kinetic mechanism of transcription initiation by bacteriophage T7 RNA polymerase. Biochemistry. 1997;36:4223–32. doi: 10.1021/bi9630467. [DOI] [PubMed] [Google Scholar]
- 5.Hsu LM. Promoter clearance and escape in prokaryotes. Biochim Biophys Acta. 2002;1577:191–207. doi: 10.1016/s0167-4781(02)00452-9. [DOI] [PubMed] [Google Scholar]
- 6.Tang GQ, Roy R, Bandwar RP, Ha T, Patel SS. Real-time observation of the transition from transcription initiation to elongation of the RNA polymerase. Proc Natl Acad Sci U S A. 2009;106:22175–80. doi: 10.1073/pnas.0906979106. [DOI] [PMC free article] [PubMed] [Google Scholar]
- 7.Johnson KA. Conformational coupling in DNA polymerase fidelity. Annu Rev Biochem. 1993;62:685–713. doi: 10.1146/annurev.bi.62.070193.003345. [DOI] [PubMed] [Google Scholar]
- 8.Kunkel TA, Bebenek K. DNA replication fidelity. Annu Rev Biochem. 2000;69:497–529. doi: 10.1146/annurev.biochem.69.1.497. [DOI] [PubMed] [Google Scholar]
- 9.Joyce CM, Benkovic SJ. DNA polymerase fidelity: kinetics, structure, and checkpoints. Biochemistry. 2004;43:14317–24. doi: 10.1021/bi048422z. [DOI] [PubMed] [Google Scholar]
- 10.Johnson KA. The kinetic and chemical mechanism of high-fidelity DNA polymerases. Biochim Biophys Acta. 2010;1804:1041–8. doi: 10.1016/j.bbapap.2010.01.006. [DOI] [PMC free article] [PubMed] [Google Scholar]
- 11.Foster JE, Holmes SF, Erie DA. Allosteric binding of nucleoside triphosphates to RNA polymerase regulates transcription elongation. Cell. 2001;106:243–52. doi: 10.1016/s0092-8674(01)00420-2. [DOI] [PubMed] [Google Scholar]
- 12.Nedialkov YA, Gong XQ, Hovde SL, Yamaguchi Y, Handa H, Geiger JH, Yan H, Burton ZF. NTP-driven translocation by human RNA polymerase II. J Biol Chem. 2003;278:18303–12. doi: 10.1074/jbc.M301103200. [DOI] [PubMed] [Google Scholar]
- 13.Anand VS, Patel SS. Transient state kinetics of transcription elongation by T7 RNA polymerase. J Biol Chem. 2006;281:35677–85. doi: 10.1074/jbc.M608180200. [DOI] [PubMed] [Google Scholar]
- 14.Holmes SF, Santangelo TJ, Cunningham CK, Roberts JW, Erie DA. Kinetic investigation of Escherichia coli RNA polymerase mutants that influence nucleotide discrimination and transcription fidelity. J Biol Chem. 2006;281:18677–83. doi: 10.1074/jbc.M600543200. [DOI] [PubMed] [Google Scholar]
- 15.Huang J, Brieba LG, Sousa R. Misincorporation by wild-type and mutant T7 RNA polymerases: identification of interactions that reduce misincorporation rates by stabilizing the catalytically incompetent open conformation. Biochemistry. 2000;39:11571–80. doi: 10.1021/bi000579d. [DOI] [PubMed] [Google Scholar]
- 16.Temiakov D, Anikin M, McAllister WT. Characterization of T7 RNA polymerase transcription complexes assembled on nucleic acid scaffolds. J Biol Chem. 2002;277:47035–43. doi: 10.1074/jbc.M208923200. [DOI] [PubMed] [Google Scholar]
- 17.Tahirov TH, Temiakov D, Anikin M, Patlan V, McAllister WT, Vassylyev DG, Yokoyama S. Structure of a T7 RNA polymerase elongation complex at 2.9 A resolution. Nature. 2002;420:43–50. doi: 10.1038/nature01129. [DOI] [PubMed] [Google Scholar]
- 18.Yin YW, Steitz TA. Structural basis for the transition from initiation to elongation transcription in T7 RNA polymerase. Science. 2002;298:1387–95. doi: 10.1126/science.1077464. [DOI] [PubMed] [Google Scholar]
- 19.Sidorenkov I, Komissarova N, Kashlev M. Crucial role of the RNA:DNA hybrid in the processivity of transcription. Mol Cell. 1998;2:55–64. doi: 10.1016/s1097-2765(00)80113-6. [DOI] [PubMed] [Google Scholar]
- 20.Daube SS, von Hippel PH. Functional transcription elongation complexes from synthetic RNA-DNA bubble duplexes. Science. 1992;258:1320–4. doi: 10.1126/science.1280856. [DOI] [PubMed] [Google Scholar]
- 21.Kireeva M, Nedialkov YA, Gong XQ, Zhang C, Xiong Y, Moon W, Burton ZF, Kashlev M. Millisecond phase kinetic analysis of elongation catalyzed by human, yeast, and Escherichia coli RNA polymerase. Methods. 2009;48:333–45. doi: 10.1016/j.ymeth.2009.04.008. [DOI] [PMC free article] [PubMed] [Google Scholar]
- 22.Ujvari A, Martin CT. Thermodynamic and kinetic measurements of promoter binding by T7 RNA polymerase. Biochemistry. 1996;35:14574–82. doi: 10.1021/bi961165g. [DOI] [PubMed] [Google Scholar]
- 23.Jia Y, Patel SS. Kinetic mechanism of GTP binding and RNA synthesis during transcription initiation by bacteriophage T7 RNA polymerase. J Biol Chem. 1997;272:30147–53. doi: 10.1074/jbc.272.48.30147. [DOI] [PubMed] [Google Scholar]
- 24.Bandwar RP, Patel SS. Peculiar 2-aminopurine fluorescence monitors the dynamics of open complex formation by bacteriophage T7 RNA polymerase. J Biol Chem. 2001;276:14075–82. doi: 10.1074/jbc.M011289200. [DOI] [PubMed] [Google Scholar]
- 25.Frey MW, Sowers LC, Millar DP, Benkovic SJ. The nucleotide analog 2-aminopurine as a spectroscopic probe of nucleotide incorporation by the Klenow fragment of Escherichia coli polymerase I and bacteriophage T4 DNA polymerase. Biochemistry. 1995;34:9185–92. doi: 10.1021/bi00028a031. [DOI] [PubMed] [Google Scholar]
- 26.Dunlap CA, Tsai MD. Use of 2-aminopurine and tryptophan fluorescence as probes in kinetic analyses of DNA polymerase beta. Biochemistry. 2002;41:11226–35. doi: 10.1021/bi025837g. [DOI] [PubMed] [Google Scholar]
- 27.Fidalgo da Silva E, Mandal SS, Reha-Krantz LJ. Using 2-aminopurine fluorescence to measure incorporation of incorrect nucleotides by wild type and mutant bacteriophage T4 DNA polymerases. J Biol Chem. 2002;277:40640–9. doi: 10.1074/jbc.M203315200. [DOI] [PubMed] [Google Scholar]
- 28.Purohit V, Grindley ND, Joyce CM. Use of 2-aminopurine fluorescence to examine conformational changes during nucleotide incorporation by DNA polymerase I (Klenow fragment). Biochemistry. 2003;42:10200–11. doi: 10.1021/bi0341206. [DOI] [PubMed] [Google Scholar]
- 29.Zhang H, Cao W, Zakharova E, Konigsberg W, De La Cruz EM. Fluorescence of 2-aminopurine reveals rapid conformational changes in the RB69 DNA polymerase-primer/template complexes upon binding and incorporation of matched deoxynucleoside triphosphates. Nucleic Acids Res. 2007;35:6052–62. doi: 10.1093/nar/gkm587. [DOI] [PMC free article] [PubMed] [Google Scholar]
- 30.Datta K, Johnson NP, von Hippel PH. Mapping the conformation of the nucleic acid framework of the T7 RNA polymerase elongation complex in solution using low-energy CD and fluorescence spectroscopy. J Mol Biol. 2006;360:800–13. doi: 10.1016/j.jmb.2006.05.053. [DOI] [PubMed] [Google Scholar]
- 31.Daube SS, von Hippel PH. RNA displacement pathways during transcription from synthetic RNA-DNA bubble duplexes. Biochemistry. 1994;33:340–7. doi: 10.1021/bi00167a044. [DOI] [PubMed] [Google Scholar]
- 32.Kashkina E, Anikin M, Tahirov TH, Kochetkov SN, Vassylyev DG, Temiakov D. Elongation complexes of Thermus thermophilus RNA polymerase that possess distinct translocation conformations. Nucleic Acids Res. 2006;34:4036–45. doi: 10.1093/nar/gkl559. [DOI] [PMC free article] [PubMed] [Google Scholar]
- 33.Tang GQ, Patel SS. Rapid binding of T7 RNA polymerase is followed by simultaneous bending and opening of the promoter DNA. Biochemistry. 2006;45:4947–56. doi: 10.1021/bi052292s. [DOI] [PubMed] [Google Scholar]
- 34.Tsai YC, Johnson KA. A new paradigm for DNA polymerase specificity. Biochemistry. 2006;45:9675–87. doi: 10.1021/bi060993z. [DOI] [PMC free article] [PubMed] [Google Scholar]


