

Abstract
We present a joint experimental/theoretical investigation into the roles of spatial structure and time in the competition between two pathogens for a single host. We suggest a natural mechanism by which competing pathogens can coexist when host evolution and competitive dynamics occur on similar timescales. Our experimental system consisted of a single bacterial host species and two competing bacteriophage strains grown on agar plates, with a serial transfer of samples of the bacteriophage population to fresh host populations after each incubation cycle. The experiments included two incubation times and two transfer protocols that either maintained or disrupted the spatial structure of the viruses at each transfer. The same bacteriophage acted as the dominant competitor under both transfer protocols. A striking difference between the treatments is that the weak competitor was able to persist in the long-incubation experiments but not in the short-incubation experiments. Mathematical and experimental evidence suggest that coexistence is due to the appearance of resistant mutant host cells that provide a transient “spatiotemporal refuge” for the weaker competitor. Our mathematical model is individual based, captures the stochastic spatial dynamics down to the level of individual cells, and helps to explain the differences in behavior under the various experimental conditions.
Keywords: bacteriophage, bacteria, spatial, experimental evolution, mathematical
Introduction
When evolutionary and ecological dynamics are intertwined, evolutionary outcomes depend on the ecological forces acting on a population. Such is the case, for example, with frequency-dependent selection and with viral pathogens such as influenza and HIV. Evolutionary forces can also feed back to drive ecological dynamics (Bull et al. 2006). One of the key ecological forces influencing evolutionary dynamics is competition, both within and between species. In the case of pathogens or predators, competition for hosts can be intense and evolutionary strategies can be diverse. Viruses, for example, can compete on several levels, including within-cell competition for host resources and progeny production and between-cell races to infect new cells. The arsenal of tricks at the disposal of a virus for succeeding in such competitions determines, in part, the possible directions that evolution can take.
Many previous models of competition assumed that populations are well mixed (Hochberg et al. 1990). However, most populations occur in a spatially structured environment and have limited dispersal abilities. Well-mixed populations may therefore be the exception rather than the rule. Competition in spatially structured settings may have substantially different sets of rules and opportunities than those that occur in well-mixed populations. This can potentially lead to differences in evolutionary dynamics and in the resulting competitive outcomes.
Here we present an integrated approach to studying the joint effects of spatial and temporal structure on competition involving organisms for which ecological and evolutionary dynamics occur on similar timescales. Our strategy is to combine an experimental virus-host model system with mathematical modeling to explore factors that influence the competitive outcomes between competing viruses. By spatial structure, we mean the spatially explicit interactions that occur in the community and not some underlying heterogeneity of the environment itself.
Our experimental system involves two bacteriophages (phage) and a single bacterial host growing on nutrient-rich agar plates. Phage are viruses that infect bacteria. Phage-bacteria populations form excellent laboratory systems for investigating evolutionary and ecological questions about host-pathogen and predator-prey systems (Levin et al. 1977; Bohannan and Lenski 1997; Abedon 2006). Such studies are facilitated by the rapid generation times of bacteria and phage. Key components of the phage life cycle are attachment, which occurs when free phage particles bind to the host bacterium; infection, which involves the injection of the phage genome into the cell; progeny production, which leads to the creation and assembly of many progeny phage in each infected cell; and lysis, or the bursting of the cell and the attendant release of phage progeny into the environment. The rates at which these events occur depend on both phage and bacteria and are prone to rapid evolution. Typically, in laboratory systems, cells that are resistant to a given phage arise and rapidly replace the host population. This is sometimes followed by mutations in the phage that permit infection of the mutant cells. In our experiments, we periodically killed resistant cells and transferred a sample of the phage population to plates that contained fresh host cells and nutrients to prevent an arms race between host cells and the phage. We began our experiments with an initial configuration in which each competing strain of phage covered one-half of a petri dish so that there was one “line” of competition down the center of the plate. This can be thought of as mimicking the type of competition that begins when two infective waves collide. Indeed, localized infections by phage in a “lawn” of bacteria lead to radially expanding clearings (plaques) in the lawn as the phage kills bacteria and spreads (Abedon 2006). This is much like the radial expansion of an epidemic that begins with a localized outbreak (Wei and Krone 2005).
The mathematical model we employ is known as an interacting particle system (also known as a stochastic cellular automaton), and it combines discrete spatial structure and stochastic dynamics down to the level of individual bacterial cells. The goal of the model is to capture essential features of the experimental system to the extent that we can (1) make predictions about how such host-pathogen systems will behave in spatially structured environments, (2) explain the mechanisms underlying the observed behavior in the experiments, and (3) propose testable hypotheses for further empirical work. Interacting particle systems and related spatial models have been widely applied to various biological systems (Durrett and Levin 1994a, 1994b, 1997, 1998; Tilman and Kareiva 1997), including some that involve microbial communities (Durrett and Levin 1997; Kerr et al. 2002; Kreft and Bonhoeffer 2005; Wei and Krone 2005; Krone and Guan 2006). The reader can consult these references for more details on such models and for further references.
Traditional models based on mass-action differential equations predict that indefinite coexistence among species competing for the same resource is impossible in most well-mixed environments unless there is some sort of resource partitioning or a trade-off that leads to frequency dependence (Anderson and May 1991). The aforementioned lack of coexistence is often referred to as the “competitive exclusion principle” (Hardin 1960). More recently, experimental (Chao and Levin 1981; Schrag and Mittler 1996; Rainey and Travisano 1998; Buckling et al. 2000; Brockhurst et al. 2006) and theoretical (Hassell et al. 1994; Durret and Levin 1997; Chesson 2000; Kerr et al. 2002; Krone and Guan 2006) studies have shown that coexistence of competitors or of predator and prey is possible under conditions that lead to spatiotemporal segregation of competitors.
Material and Methods
Experimental Procedures
Strains
For all passages, laboratory isolates of bacteriophages φX174 (GenBank AF176034) and α3 (GenBank DQ085810) were grown on Escherichia coli C. Assays for presence or absence of phage strains were performed on Salmonella typhimurium LT2 strain IJ750, which is susceptible to φX174 but resistant to α3, and E. coli B ATCC #11303, which is susceptible to α3 but resistant to φX174. Escherichia coli C and S. typhimurium LT2 are further described in Bull et al. (1997).
φX174-resistant E. coli C were isolated by plating E. coli C using enough φX174 to result in near-total lysis of the plate. Plates were incubated overnight, resulting in cleared plates with phage-resistant bacterial colonies. Strains derived from 13 colonies were tested for resistance to φX174 and α3; all 13 were resistant to φX174 and two were also resistant to α3. Three of the φX174-resistant/α3-sensitive strains were used in experiment 3 (below). Each of these strains was derived from an independent culture of E. coli C and displayed a different colony morphology, suggesting that they have different resistance mechanisms.
General Procedures
Three experiments were performed: (1) evolution in a spatially structured environment (hereafter referred to as “structured”), (2) evolution with spatial structure disrupted at each passage (hereafter referred to as “mixed”), and (3) evolution in a structured environment with ~4,000 φX174-resistant/α3-sensitive E. coli C cells added at the beginning of each incubation cycle (hereafter referred to as “resistant host”). The following methods were used in all treatments, except where otherwise noted. To initiate an experiment, E. coli C hosts were added to 4 mL top agar, vortexed, and spread on a petri dish. Phage were then inoculated onto nonoverlapping halves of this plate (fig. 1A); in subsequent passages, phage were transferred such that the spatial arrangement was preserved except as noted below. In all experiments, bacteriophage φX174 was competed against bacteriophage α3 on bacterial host E. coli C. Each experiment involved two time treatments consisting of a 5-h or an 18-h incubation period (hereafter referred to as “short” and “long” incubations, respectively). Each experiment consisted of 15 incubation periods and was replicated in triplicate. All experiments were performed on LB agar plates with 2 mM CaCl2. Plate assays were performed using 4 × 10⁷ host cells in LB top agar with 2 mM CaCl2.
Figure 1.
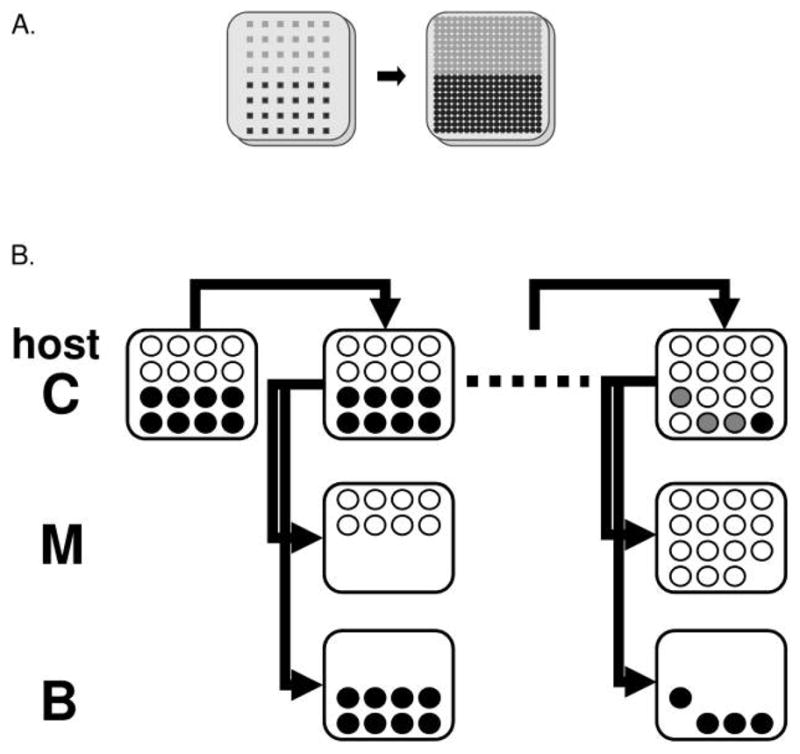
Design of plate passages and phage genotyping. A, Configuration of phage strains on the initial plate and after the first transfer (actual grid size not shown). Light gray points represent φX174 inoculation, and dark points represent α3 inoculation. B, Protocol for phage genotyping. For simplicity, only a 4 ×4 grid is shown. Open circles represent φX174, black circles represent α3, and gray circles show areas where both phages are present. Experiments were performed on Escherichia coli C (host C); φX174 was detected by replica plating on Salmonella typhimurium (host M) and α3 was detected by replica plating on E. coli B (host B).
Experiment 1: Structured Environment
For the initial passage (one complete incubation), phage derived from a fresh plaque were aliquotted into 48 wells of a standard microtiter plate and wells were sealed with LB agar to prevent contamination between wells. A Boekel multi-pronged replicator (Fisher Scientific) was used to transfer phage in a 6 × 8-point grid from the microtiter plate onto a 100-mm square petri dish freshly plated with 4 × 10⁷ E. coli C in LB top agar with 2 mM CaCl2. Prongs on the replicator were spaced 10 mm apart and had a footprint of 1.5 × 1.5 mm2. One half of each petri dish (6 × 4-prong area of the grid) contained the phage φX174 and the other half contained α3. Three short-incubation and three long-incubation replicates were established from the same initial microtiter plate. Plates were incubated for 5 or 18 h at 37°C. After incubation, the remaining bacterial cells were killed by placing the plate over chloroform-saturated blotting paper (Schleicher and Schuell, Keene, NH) for 45 min to prevent transfer of resistant cells to the next plate. (An independent time course experiment determined that a 45-min exposure was sufficient to kill the remaining hosts. Unless resistant cells are killed at each passage, their outgrowth will interfere with assays to determine the distribution of each phage type, as described below.) For the second and subsequent passages, a fine-prong replicate picker was used to transfer a 16 × 20-point grid of phage to a fresh plate of E. coli C, as described above (fig. 1A). These prongs were spaced 3.5 mm apart and had a 2-mm-diameter circular footprint. Each passage consisted of chloroforming, transfer of a 16 × 20 grid of phage onto a plate of naive hosts, and incubation. Transfers contained enough phage to clear the plates.
The spatial distribution of φX174 and α3 was assayed after each passage by repeating the transfer onto an assay host and incubating for 5 h (fig. 1B). Assays to detect φX174 were performed on a plate containing 4 × 10⁷ S. typhimurium in LB top agar with 2 mM CaCl2; assays to detect α3 were performed on 4 × 10⁷ E. coli B in LB top agar with 2 mM CaCl2. The distribution of a phage was determined by scoring the area covered by the plaque around each prong of the replicate picker as 1 or 0 for the presence or absence of phage growth, respectively; each prong corresponds to a spatial data point. We will refer to this as “genotyping.” One limitation of the method was that the transferred phage could spread to adjacent prongs during the assay incubation, potentially resulting in a slightly enlarged “occupancy” region for each phage during genotyping. A second limitation was that growth of φX174 on S. typhimurium was more robust than growth of α3 on E. coli B, so this spreading may have occurred more with φX174 than with α3. Thus, scoring on the assay hosts is a rough approximation of the area covered by each strain. Despite limitations, this assay clearly demonstrates the advance or retreat of phage types relative to each other on the experimental host.
Experiment 2: Mixed Environment
The experiment and assays in the mixed environment were performed in the same manner as in the structured environment, except that the spatial structure was disrupted by mixing at each transfer. The initial plate was set up in the same manner as for the structured environment (above), except that phage was combined in equal proportions and added to each of the microplate wells. After incubation, the relative areas covered by φX174 and α3 were determined by the genotyping method described in the structured experiments above. After this step, phage were mixed in the following manner: the top agar from each plate (containing phage and remaining host cells) was scraped into 5 mL LB broth with 1 mL chloroform, vortexed thoroughly for ~1 min, and then centrifuged at 3,000 g to separate. Following the first incubation, an aliquot of the supernatant containing about 105 phage was added to 4 × 10⁷ E. coli C and 4 mL top agar and plated to begin the next generation. The number of phage to be transferred was determined by estimating the total number of phage transferred with the replicate picker following the first incubation cycle. The volume of supernatant containing that number of phage was determined. This transfer volume was then kept constant throughout the remainder of the transfers to allow for a consistent proportion of the total phage population (rather than a fixed number of phage) to be transferred.
Experiment 3: Resistant Host
The experimental conditions and assays for the resistant host experiments were performed as described for the structured environment, except that ~4,000 E. coli C resistant to φX174 but susceptible to α3 were added in addition to 4 × 10⁷ susceptible E. coli C at the start of each incubation. As before, this provided bacterial hosts with uniformly distributed cells of each type. The number of resistant host cells used in the experiment was determined by adding 105 φX174 phage to 4 × 10⁷ E. coli C and taking an average (N = 5) of the number of resistant cells that grew on a petri dish (81 cm2) after 5 h.
Parameter Estimation
Mathematical models require input of biological parameters. For the interacting particle system model, estimates of the rates used to characterize attachment time and latent period, as well as the burst range, were estimated using empirical measurements for the two phage strains. Parameter estimation is further discussed in “Results.” The baseline mutation rate for E. coli C was taken from the literature and then increased slightly to account for the fact that, unlike in the simulations, bacteria do not form monolayers; in a thick colony, the “effective mutation rate” at a given location is higher than the per-cell rate (Taylor 1963). This type of adjustment is necessary when using two-dimensional models for populations with some three-dimensional structure (see Krone et al. 2007). Attachment and latent-period parameters were estimated in liquid environments because of the experimental difficulties of estimating these parameters on petri dishes. We estimated attachment time as the amount of time from inoculation of the culture with free phage to attachment of the phage to host cells. We estimated latent period as the time between attachment and lysis of the host cell releasing viable phage progeny. We estimated a proxy for burst range, the area occupied by progeny phage particles following lysis of a single infected host cell, using the spread of the advancing infective wave front. The methodologies are given below.
Attachment time was estimated by adding 5 × 10⁵ phage to 10 mL LB broth with 109 E. coli C in exponential growth phase and incubated in a water bath, shaking at 200 rpm at 37°C for 30 min. Samples were taken starting at 1 min and continuing at 2-min intervals. A 10-μL aliquot of the sample was immediately plated onto LB plates with 107 E. coli C in LB top agar and incubated overnight at 37°C to estimate the total number of phage present. The remainder of the sample from each time point was placed in a microcentrifuge at full speed for 2 min to pellet cells (with adsorbed phage). A 10-μL aliquot of the supernatant was plated in the same manner with fresh E. coli C and incubated overnight to estimate the total amount of free phage in the sample. The amount of attached phage was calculated as the difference between the initial number of phage and number of unattached phage (Ptotal − Punattached = Pattached), and the time to attachment was indicated by the initial increase in the number of attached phage.
Latent period was estimated by suspending a fresh plaque (~106 phage) in 1 mL LB broth with 108 E. coli C. Phage and host cells were incubated for 1 h at 14°C to allow attachment but not phage injection, and then they were centrifuged at 13,000 g for 5 min at 4°C. The resulting pellet, which included approximately 105 adsorbed phage, was immediately suspended in 1 mL LB, added to a flask containing 9 mL LB that was prewarmed to 37°C, and incubated in a water bath, shaking at 200 rpm at 37°C for 30 min. Samples were taken at 1-min intervals starting 6 min after inoculation, plated onto LB plates with top agar and 107 E. coli C, and incubated overnight at 37°C. We used the time to first increase in phage titer as the latent period.
After attachment time and latent period estimates were put in as model parameters, the burst range (the radius of the circle surrounding a host cell in which phage progeny spread after cell lysis) was set to provide a fit to the observed wave speed of the spreading plaque. Because burst range of individual cells cannot be measured directly, we resorted to an indirect measurement. We chose burst ranges for the simulations to reflect the radial rates of plaque expansion for φX174 and α3. For the spatial model, burst range is more relevant than burst size; it is influenced by burst size, attachment rates, diffusivity, and so on.
To synchronize simulations with experiments, we assumed a doubling time for E. coli C of 20 min, which corresponds to 7.2 × 10⁷ simulation steps. Using this as a reference, we calculated the number of simulation steps that correspond to the short- and long-incubation periods as 1.08 × 10⁹ and 4.32 × 10⁹ steps, respectively. The relative number of steps between the short- and long-incubation simulations (4.32/1.08 = 4) is slightly higher than the relative time in the actual incubations (18/5 = 3.6), to allow for the fact that there is a short lag phase between initial plating and the start of cell replication.
Mathematical Model and Computer Simulations
Our simulations take place on a 600 × 600-square lattice of sites. In our model, each site can be vacant, occupied by one of two uninfected bacterial host types, or occupied by an infected host cell. The site can also be occupied by free bacteriophage φX174 or α3 or both. The host types considered are either the wild-type strain, which is susceptible to both φX174 and α3, or the resistant mutant strain, which is resistant to the dominant phage φX174 but susceptible to α3. A susceptible cell at a site containing a free phage particle will become infected at a rate that depends on the phage type and the probability of infection for a given period of time. We use the term “attachment time” to refer to the time period that begins with the first colocation of phage and host cell at a site and ends when the phage attaches to the cell. We assume that attachment is irreversible and ignore the difference between attachment and infection, using these terms interchangeably. If both phage types occupy the site, we only allow one phage to attach and infect a cell, with the winner determined by the timing of the arrivals of the phage particles and the time it takes each to attach. This is a simplification in the model, because coinfection is probably common in this system.
If a site contains an infected cell, the cell will lyse and release phage progeny into that site and neighboring sites after a time that we refer to as the latent period, defined here as the amount of time from attachment to cell lysis and release of phage progeny. The neighborhood of sites in which phage are released is determined by the burst range, defined here as the radius of the area occupied by phage progeny after host cell lysis. For simplicity, the model does not distinguish between different phage numbers at a site; only the presence or absence of a given phage is tracked. In particular, when a cell lyses, each site within the burst range receives a copy of the phage.
Cell death in the model is assumed to result only from phage infection. Cells reproduce by depositing daughter cells at randomly chosen neighboring sites that do not already contain a cell; if there are no vacant neighboring sites, the reproduction event is suppressed. Thus, the model does not allow for the “piling up” of cells on our two-dimensional lattice (which prevents excessive simulation run times). Nutrients are not explicitly modeled and, in the model, cells retain their original susceptibility to phage infection even when they can no longer reproduce due to crowding.
Transfer was simulated using an 8 × 8 grid of sampling “prongs,” with each prong consisting of a 5 × 5 square of neighboring sites and with 65 sites between sampling prongs. The ratio of host cells to phage was about 100: 1 at the beginning of each incubation period for all experiments and simulations. Mixed transfer in simulations was performed by taking 1% of all phage particles at the end of each incubation period and uniformly distributing them onto a new lattice space with host cells for the next incubation. The spatial scale in the simulations corresponds to ~1 μm per site. We performed three replicates of each simulation.
A precise description of the interacting particle system model requires a listing of the possible states for each given site, plus rules for when and how sites change their states. Because this is a continuous-time (i.e., asynchronously updated) stochastic model, the time until a site changes its state is determined by various rates. These rates typically depend on the configuration of states at nearby sites. Each such rate determines a random “waiting time” (the time it takes for the site to change state) that is mathematically described by an exponential random variable with a mean that is given by the inverse of the corresponding rate. See appendix for further details on how rates are specified in the mathematical model.
Results
Overview of Experimental Results
The outcomes of our initial experiments (experiment 1 and experiment 2) can be summarized as follows: φX174 appeared to be the “dominant” phage in all experiments. φX174 plaques spread faster than those of α3 and tended to drive α3 to extinction or to very low frequencies under most conditions (fig. 2). When φX174 spread across the plate, it either excluded α3 or coexisted with it; α3 was never able to competitively exclude φX174. In the spatially structured experiment, α3 became extinct or was driven to very low densities in the short incubation (5-h) treatment (fig. 2A, top; fig. 3A). In contrast, in the spatially structured long-incubation (18-h) treatment, α3 and φX174 coexisted at high densities through the termination of the experiment (fig. 2B, top; fig. 3C). In the mixed-transfer experiments, α3 became extinct in the short-incubation treatment at around the eighth cycle (fig. 2C, top; fig. 4A). In the mixed-transfer, long-incubation treatment, α3 population densities fluctuated dramatically and were still persisting by the end of the experiment (fig. 2D, top; fig. 4C), although at much lower densities than in the structured long-incubation experiments. Thus, there were differences in phage spread and persistence due to both the extent to which spatial structure was maintained or disrupted and the length of incubation. These differences were explored by simulations of the mathematical model and in additional experiments described below.
Figure 2.

Examples of results from experiments and simulations (one replicate is illustrated for clarity). Each square represents the distribution of phage on a petri dish at the end of an incubation period, from the initial configuration (left) until the final incubation period (right). For each condition, experimental results are shown directly above simulation results. Yellow corresponds to regions where only φX174 was detected at the sampled location, blue to regions where only α3 was detected, and light green to regions in which both φX174 and α3 were detected. Dark green within yellow regions represents clusters of φX174-resistant/α3-sensitive cells (simulations only).
Figure 3.

Frequency of phage types with structured transfer. Results for all three replicates are shown. Frequencies were determined from the number of points showing growth of each phage type in replica plates on indicator hosts. A, Experimental results, short incubation period. B, Simulation results, short incubation period. C, Experimental results, long incubation period. D, Simulation results, long incubation period.
Figure 4.

Frequency of phage types with mixed transfer. Results for all three replicates are shown. Frequencies were determined from the number of points showing growth of each phage type in replica plates on indicator hosts. A, Experimental results, short incubation period. B, Simulation results, short incubation period. C, Experimental results, long incubation period. D, Simulation results, long incubation period.
Parameter Estimation
Table 1 lists the measured estimates of parameter values from actual experiments, and table 2 lists the parameter values used in our simulations. We assume that the values for attachment time and latent period are the same on the petri dishes (in which the experiments took place and on which we model the computer simulations) and in the liquid environments (in which they were measured).
Table 1.
Estimates of experimental parameters
| A. Estimated parameters and initial condition for bacteriophages φX174 and α3 | |||
|---|---|---|---|
| Bacteriophage | Attachment time (min) | Latent period (min) | Initial population size |
| φX174 | 3 | 13–14 | 1.5 × 10⁵ |
| α3 | 3–7 | 12–17 | 1.5 × 10⁵ |
| B. Estimated parameters and initial condition for Escherichia coli C, which was used as the bacterial host in all experiments | |||
| Bacterial host | Doubling time (min) | Mutation rate (per individual) | Initial population size |
| E. coli C | 20 | 10−8–10−6 | 4 × 10⁷ |
Table 2.
Simulation parameters and initial conditions. Parameters are based on experimental measurements for A, φX174 and α3; and B, Escherichia coli C
| A. Simulation parameters for bacteriophages φX174 and α3 | |||||
|---|---|---|---|---|---|
| Parameter | Attachment time (min) | Latent period (min) | Burst range diameter (no. sites) | Initial population frequency (no. per site) | Initial population size |
| φX174 | 3 | 13 | 6 (105) | 2.5 × 10⁻³ | 90 |
| 14 | |||||
| α3 | 3 | 12 | 5 (77) | 2.5 × 10⁻³ | 90 |
| 5 | 15 | ||||
| 7 | 17 | ||||
| B. Simulation parameters for E. coli C, which was used as the bacterial host in all experiments | |||||
| Bacterial host | Doubling time (min) | Mutation rate | Initial population frequency (no. per site) | Initial population size | |
| E. coli C | 20 | 5 × 10⁻⁶ | .5 | 1.8 × 10⁵ | |
The empirical estimates of attachment time were slightly longer and more variable for α3 than for φX174. The attachment times for α3 were measured to have a range of 3–7 min. To account for this variability, we modeled α3 attachment time as a random variable with values 3, 5, and 7 min, all equally likely (table 2, pt. A). The attachment times for φX174 averaged 3 min, with no measured variation (table 1). We thus modeled the φX174 attachment time as the constant 3 min.
The empirical estimates of latent period are also slightly longer and more variable for α3 than for φX174. The latent period for α3 had a range of 12–17 min, so we modeled it as a random variable with values of 12, 15, and 17 min, all equally likely. We performed only two measurements for latent period for φX174. Both measurements fell between 13 and 14 min (table 1) and agreed with previous measurements performed in the lab. We modeled the φX174 latent period as a random variable with values of 13 and 14 min, both of which were equally likely.
The variation in latent period is likely due in part to cells being at different stages in their life cycle when exposed to phage. φX174 appears to cause cell lysis by inhibiting a component of cell wall synthesis and thus presumably tying lysis to cell division, unlike phages with larger genomes (Bernhardt et al. 2000, 2001). Because of similarities in genome structure, the same may be true of α3. Of course, even if this is the case, differences between φX174 and α3 latent periods may still exist if these different phages have different effects on cell growth. We use a slightly shorter “generation time” (attachment time + latent period) for the phage than for the host cells in the simulations. This accounts for the likely variability of “ages” of host cells that are within the burst range of a newly lysed cell; for example, a cell that is infected at the beginning of its generation time (just after cell division) will take longer to lyse than a cell that is infected 1 min into its generation time.
The empirical estimates of burst range were about 1.2 times larger for φX174 than for α3 (table 1). The fact that φX174 has a larger burst range is consistent with liquid measurements indicating that φX174 has a larger average burst size (number of progeny) than α3 (data not shown).
Distribution of Phages: Simulation and Experimental Results
Overall, with parameters chosen as described above, the simulations closely resembled the experimental results, both in global behavior (such as time to extinction and overall density) and in the spatial distribution of the phages. In figure 2, we show examples of replicates for each of the experimental and simulation conditions: structured or mixed transfer, short or long incubations, and with or without resistant cells added at the beginning of each incubation period. Each row shows the spatial patterns at the end of each of the 15 incubation periods on the basis of what was detected at the sample prongs (in both experiments and simulations). In the structured transfer experiments, there is a discrepancy between the amounts of overlap (area of coexistence) between experimental and simulation results in the first few transfers; this difference tends to be less pronounced in the later transfers. This difference may be due to the spread of phage during genotyping in the experiments or due to the different spatial scale of the simulations. During genotyping, phage go through one or more rounds of growth on their selective host cells, allowing the phage to spread and increasing the apparent range of each phage. We did not include this effect in the main simulations. However, we performed additional simulations to determine its effect; see “Discussion.”
Structured Transfer with Short Incubation Times
In short-incubation experiments and simulations, α3 frequencies decayed to 0 or close to 0, and φX174 frequencies (i.e., relative densities) quickly reached 1 in all replicates (fig. 2A; fig. 3A, 3B). In this setting, φX174 is clearly the dominant competitor. Differences in phage generation time and burst range appear to be critical to the dominance of φX174. In fact, if we constrain either of these parameters to be equal between the two phages in the simulations, then the dominant phage is completely determined by the other parameter. In other words, the phage with the larger burst range drives the other phage to extinction in the simulations for which the phage generation times are the same. Similarly, the phage with the shorter generation time drives the other phage to extinction in the simulations where we hold the burst range to be equal between the phage (data not shown). Because φX174 has a shorter generation time and, probably, a larger burst range than α3, it is not surprising that it is the dominant phage.
Structured Transfer with Long Incubation Times
The long-incubation experiments and simulations produced outcomes that were very different from the short-incubation experiments and simulations. φX174 quickly spread across the entire plate, but α3 persisted through the end of the experiment and eventually spread across most of the plate in all replicates (fig. 2B; fig. 3C, 3D). We hypothesized that the coexistence of the two phages, despite the dominance of φX174, was due to the appearance and subsequent population expansion of φX174-resistant/α3-sensitive host cell clusters. In fact, in simulations without resistant cells, α3 went extinct in the long-incubation as well as the short-incubation experiments (data not shown). In separate experiments, we also counted numbers of φX174-resistant host cells that arose during a single incubation cycle initiated with 105 φX174 and 4 × 10⁷ E. coli C mixed on a plate. We found 6.3 × 10⁴ resistant cells on the 5-h plates and 3.9 × 10⁸ on the 18-h plates; testing a small sample of these φX174-resistant cells indicated that ~85% were susceptible to α3.
To illustrate how the difference in incubation times affects the spread of resistant cells, consider cells that double every 30 min, neglecting crowding, nutrient depletion, and so on. A resistant cell that arises at the beginning of a 5-h incubation cycle will result in 210 = 1,024 cells at the end of the cycle, whereas 18 h of incubation will result in 236 ≈ 6.9 × 10¹⁰ cells; this is 6.7 × 10⁷ times the number of cells for the 5-h incubation. Otherwise put, if each round of replication leads to an increase in the radius of the colony, we expect the radius of such a resistant colony to be 3.6 times larger in the 18-h incubation than in the 5-h incubation, resulting in an area that is approximately 13 times larger. In addition, during the 18-h incubation, there will be more resistant cell colonies that spontaneously arise through new mutations.
The role of resistant cells is also consistent with the observed oscillations in α3 frequency in the experiments (see “Discussion”). (Here and below, the “frequency” of a given phage refers to the fraction of sampled picker sites that contained that phage. Note that, because a prong can contact many phage, it is possible for the frequencies of both phages to be 1. Also, because the number of each type sampled by the prongs may differ, the frequency refers to the number of sites occupied and not the absolute frequency of phage types.) The simulations produced similar results, although the oscillations in α3 frequencies were not as pronounced as they were in the experiments (figs. 3, 4). We hypothesize that this is due in part to the difference in the sample area transferred between the experiments and simulations. In fact, when we used larger sampling “prongs,” the oscillations in α3 frequencies in the simulations became more pronounced (fig. 7).
Figure 7.

Effects of the scale of genotyping on oscillations in structured-transfer simulations. The figures on left-hand side are for short incubation times, and those on the right-hand side are for long incubation times. A, B, Picker counting with larger prong size (10 × 10 sites) and distance (100 sites) between prongs. C, D, Picker counting with smaller prong size (5 × 5 sites) and distance (65 sites) between prongs. E, F, Exact counting. In picker counting, samples were taken for the prong size and spacing specified, and each prong was scored 1 or 0 for the presence or absence of each phage strain.
Although it is quite labor intensive to extend the number of experimental passages, the simulations can be extended quite easily. To check whether the apparent persistence of α3 in the simulations was real or if α3 simply experienced a slower rate of extinction than in the short-incubation simulations, we also ran the long-incubation simulations for 200 transfers. In all three replicates (data not shown), the pattern was very stable, with α3 easily persisting the entire time and having frequencies between 0.6 and 0.85. We also performed “invasion-when-rare” simulations (data not shown) to see whether an equilibrium population of φX174 and bacteria could be invaded by α3 starting at low density. The simulations began with φX174 spreading to its equilibrium density across the entire lattice. A sample of the φX174 was then transferred with the sampling prongs to fresh host cells, as in the previous simulations. To this, 108 randomly located α3 were added, and then incubation and transfer were performed as before. In the short-incubation simulations, α3 failed to invade and quickly died out. In the long-incubation simulations, however, α3 quickly increased in density and then leveled off to the same equilibrium behavior observed in the other long-incubation simulations.
Mixed Transfer and Short Incubation Times
With short incubation times, the mixed-transfer experiments resulted in the rapid extinction of α3 and the spread of φX174 over the entire plate in both the experiments and the simulations (fig. 2C; fig. 4A, 4B). Note that the short incubation times preclude any substantial growth of φX174-resistant cells, similar to the short-incubation, structured-transfer experiments and simulations discussed above. Interestingly, in the experimental treatment but not in the simulations, there was a dramatic resurgence in α3 frequencies at roughly the same time in all three replicates. This observation was confirmed in an independent set of replicate experiments (data not shown) and may be due to phage evolution, which was not included in the mathematical model.
In the three long-incubation replicates, phenotypic changes in plaque morphology were evident on the phage-typing plates in a subset of the persisting α3. This morphological variant was observed by the eighth passage in the long-incubation, structured-transfer replicates and by the third passage in the long-incubation, mixed-transfer replicates. We confirmed that evolution had occurred in these morphologically distinct types by sequence analysis of one such phage from each of the three long-incubation, structured replicates. The genetic basis and adaptive consequences of this evolution are being pursued as part of a separate study. Here we explore how much of the population dynamics can be explained by accounting for spatial structure and host mutation while ignoring phage evolution. That phage evolution would have a more immediate effect in mixed transfers is probably explained by the fact that α3 mutants arising and multiplying in one incubation cycle would be dispersed throughout the plate in the next cycle and thus their ability to compete with φX174 seen everywhere. It is not clear why the resurgence in α3 is only temporary in these mixed-transfer experiments; perhaps an arms race with φX174 ensued. Evidence that the α3 mutants were not the primary determining factor for coexistence in the unmixed transfers comes from the fact that the mathematical model without mutant phage does an excellent job of capturing the dynamics in both short and long incubations. In addition, unless the phage mutation rate is incredibly high, there will be only small localized clusters of mutant α3 in early (unmixed) generations, and so these would seem not to account for the fairly rapid spread of α3.
Mixed Transfer and Long Incubation Times
Increasing the incubation time in the mixed-transfer experiments and simulations (fig. 2D; fig. 4C, 4D) led to long-term persistence of α3, although at significantly lower levels than in the structured-transfer, long-incubation experiments and simulations. There were large oscillations in the frequency of α3. These oscillations were not reflected in the simulations, again, presumably because they were a result of phage evolution.
We hypothesize that the low densities of α3 relative to φX174 in the mixed experiments (as compared with the structured-transfer, long-incubation experiments) are due to disruption of the spatial structure of the system. In the mixed-transfer experiments, the phage are well mixed and then redistributed at each transfer. After mixing, α3 is likely to be at low but uniform densities across the entire plate (rather than in the “clumped” distribution of the structured plates). In this case, α3 is closer to any particular point on the plate and so is able to infect and lyse φX174-resistant cells before they have much time to replicate. This prevents high densities of φX174-resistant host cells from building up and thus limits the host resource for α3, effectively limiting population growth for α3. Nevertheless, the φX174-resistant host cells are likely to be important for the long-term persistence of α3 even in the mixed-transfer case.
Resistant Host Cells
To better understand the role of resistant host cells in the structured-transfer experiments, we artificially added ~4,000 φX174-resistant/α3-sensitive E. coli C in addition to the usual 4 × 10⁷ susceptible E. coli C at the beginning of each incubation period. The number of resistant cells added was a conservative estimate of the number present on the plate after 5 h of incubation (i.e., 10-fold less than the number of resistant cells measured by titering). We hypothesized that α3 would persist in the presence of these resistant host cells even in structured-transfer, short-incubation experiments.
Resistant Host Cells, Structured Transfer, and Short Incubation Times
The introduction of a low density of resistant host cells at the start of each incubation period dramatically altered the fate of α3 in short-incubation experiments and simulations. In both experiments and simulations, α3 rapidly spread across the entire plate and persisted at high densities throughout the experiment (fig. 2E; fig. 5A, 5B). These results are similar to the experimental results with structured transfer and long incubation times and as such are consistent with the hypothesis that persistence of α3 in the long-incubation experiments is due to the evolution of resistance in the host cells to the dominant phage.
Figure 5.

Frequency of phage types with structured transfer and φX174-resistant/α3-sensitive host cells added at the beginning of each transfer. Results for all three replicates are shown. Frequencies were determined from the number of points showing growth of each phage type in replica plates on indicator hosts. A, Experimental results, short incubation period. B, Simulation results, short incubation period. C, Experimental results, long incubation period. D, Simulation results, long incubation period.
Resistant Host Cells, Structured Transfer, and Long Incubation Times
The introduction of resistant host cells to the long-incubation experiments and simulations did not alter the long-term outcome for α3 relative to the analogous long-incubation experiments without additional resistant host cells (see fig. 2B, 2F). In both long-incubation experiments, α3 spread across the plate and persisted at high densities through the termination of the experiment. However, with the addition of resistant cells, the spread of α3 was slightly faster in the long-incubation experiments than in the short-incubation experiments (see fig. 2E, 2F).
Discussion
We have developed an experimental model system and a complementary mathematical model to explore the impacts of spatial and temporal factors on competition between parasites on a single host. The empirical system consists of two bacteriophages, φX174 and α3, competing on their common bacterial host, Escherichia coli C. The mathematical model is an interacting particle system that captures stochastic spatial dynamics down to the level of individual cells. Life-history parameters would predict that φX174 should rapidly exclude α3 under our experimental conditions, and yet α3 persists in some experiments, especially those with long incubation times at each passage. We hypothesize that coexistence is the result of evolution of the host species. During each passage, host cells arise that are resistant to phage; in particular, φX174-resistant/α3-sensitive cells provide a population of hosts that can be infected by the “weaker” phage and that may thereby provide a refuge. Consistent with this, coexistence occurred under conditions that promote the evolution and spread of resistant host cells (long incubation times) but not under conditions in which the spread of resistant host cells are limited (short incubation times). In further support of our hypothesis, addition of a small fraction of φX174-resistant/α3-sensitive host cells at each passage allows coexistence of the competing phage in the short-incubation treatments. There may, of course, be other factors contributing to the coexistence of φX174 and α3 in long-incubation experiments. For example, if some α3-infected cells were to significantly delay lysis, their progeny might appear and be transferred only if incubation periods were sufficiently long.
In simulations, resistant cells were able to form “percolating clusters” in long-incubation, structured-transfer treatments, thus providing a spatial refuge for α3 in otherwise φX174-dominated territory. This effect is even more striking if one runs the simulations for various values of incubation time. There seems to be a critical value for incubation time; for incubation times below this value, α3 becomes extinct; for incubation times above this value, α3 persists (see fig. 6). Simulations that allowed for the appearance of mutant cells that are α3-resistant/φX174-sensitive in addition to the usual φX174-resistant/α3-sensitive cells did not have significantly different outcomes. This was not surprising, because the new mutants would benefit only φX174, which already dominated the spatial landscape. Changing the model to include only α3-resistant/φX174-sensitive mutant cells or to include no mutant cells at all always led to the extinction of α3, even in long-incubation simulations.
Figure 6.

Effect of incubation time on persistence of α3 in structured-transfer simulations. Short incubation times led to the extinction of α3; sufficiently long incubation times led to the coexistence of α3 and φX174.
Limitations and Strengths of the Mathematical Model
Obviously, as with any model, there are numerous departures from reality. Nevertheless, the mathematical model employed here is quite complex, with much of this complexity a consequence of accounting for rudimentary spatial structure. The goal is to see whether the model can capture the behavior of competing phages in the experimental system, to help explain the mechanisms responsible for observed behavior, and to suggest directions for future experimental exploration.
In an effort to keep the model relatively simple and the simulation times reasonable, certain properties of the phage/bacteria experimental system were not addressed. For example, plate cultures allow for three-dimensional growth of cells and phage, whereas our mathematical model is based on a flat, two-dimensional lattice. This means, for example, that cell growth cannot proceed past the point at which the lattice fills up, and this happens much more quickly than the time it takes to reach the stationary phase on agar. We have accounted for some of this effect by assuming that cells remain susceptible even after growth has stopped. A full three-dimensional model would require a drastic increase in simulation time.
Despite the fact that our 600 × 600 lattice is considerably larger than most interacting particle system simulations in the literature to date, the spatial scale for simulations is still smaller than it is for experiments. Assuming cell sizes of 1–2 μm and intercellular distances of 1–10 μm, our 600 × 600 lattice translates to a square region of just a few millimeters per side. The area of the petri plates, on the other hand, is 9 cm per side. Another discrepancy between the simulations and the experiments is in the transferred samples. In the experiments, the picker prongs were about 1 mm across and about 3 mm apart. In the model, we chose to keep the sample area proportional to the size of the plate rather than proportional to the cell size. (In the experiments, the prong-to-plate ratio = 1 mm/90 mm ≈ 0.01; in the mathematical model, the sample-to-grid area = 5 sites/600 sites ≈ 0.01). Thus, in the simulations, the transferred samples used a much finer scale for prong size and between-prong distance than in the experimental system.
All of this reinforces the point that one should not think of the mathematical model as an exact replica of the experimental system. The model seeks to incorporate essential features of the real system in an effort to understand the mechanisms that determine important outcomes. The difference of scale, together with the simplifying assumptions of the model and the fact that certain experimental parameters are difficult to measure, means that the findings of the mathematical model should be considered to be more qualitative than quantitative. The goal is not to perfectly capture the dynamics of competition between φX174 and α3 on a given bacterial host and in a specific experimental system but rather to discover mechanisms that are robust enough to play significant roles in competitions between a variety of viruses or even more general classes of competitors.
Despite the aforementioned limitations, our model captures stochastic and individual details at a microscopic level that differential equation models can only treat in bulk averages. For example, the simulations allowed us to test hypotheses about life-history parameters in determining phage dominance. In addition, we were able to test the hypothesis that coexistence was due to the spread of mutant host cells resistant to the dominant phage, and the simulations allowed us to see how such a mechanism could work in great detail. Unlike the experiments, where observing what is present and inferring mechanisms is fraught with difficulty, the simulations can be observed with absolute clarity, broad ranges of parameters that would be impossible to explore in most experimental situations can be tested, and mechanisms can be controlled and manipulated.
Exploring Experimental Features Not Captured by the Simulations
Although the simulations captured many features of the experimental data, doing so required ongoing input from the experimental system. For example, early simulations suggested that φX174 would outcompete α3 under our experimental conditions. The observation in the experimental system that the length of incubation affected the outcome of competition led to the hypothesis that host evolution could explain the difference between long and short incubation times. Demonstration that most φX174-resistant phage were α3 sensitive supported this hypothesis. This is a case where the experiments informed the simulations; including the evolution of host resistance in the simulations led to a more accurate tracking of experimental results. But, although this hypothesis could be tested experimentally by the addition of resistant hosts to the structured competitions, it could be more completely explored in the mathematical model. Simulations of the effects of increasing incubation time on α3 persistence suggested a transition between α3 loss and persistence (fig. 6); as incubation time increased, the extinction time of α3 increased and eventually extinction was averted. This result could now be explored experimentally.
Another feature of the experiments that was not captured by the simulations was the large oscillations in the frequencies of α3. These oscillations were more pronounced in long-term than in short-term incubations and were especially pronounced in the mixed transfers. We consider three factors that might explain these oscillations: methods of genotyping, host evolution, and phage evolution. Of course, these explanations are not mutually exclusive. Other possibilities include density-dependent phage or host behaviors that were not modeled in this study.
Genotyping Effects on Phage Oscillations
In the experiments, genotyping was performed by replica plating phage on assay hosts with the multiprong picker and scoring how many prongs showed growth on each such host. The assay assessed the presence or absence of phage at each site but did not measure the number of phage. Also, observations on the assay host required time for host and phage growth, and during that time, phage were able to spread to areas inoculated by adjacent prongs on the picker. Unless the strain covered the entire plate, this resulted in an overestimate of the area occupied by each type. In simulations, we can view the spatial distribution of phages with complete clarity immediately after each passage, and thus there is no corresponding overestimate of phage distribution. In the simulations, we can also sample the phage as with a picker and can even vary the area covered by a prong and the distance between prongs. Thus, we have three measures of phage density: the experimental method of “genotyping” and two simulation methods, “exact counting,” which is the actual frequency of phage on the plate after each passage, and “picker counting,” which mimics genotyping. In picker counting, each prong is scored as a 1 or a 0 for the presence or absence of each phage strain, but the transfer to the next passage maintains the actual count and configuration of phage.
Comparing these types of sampling in simulations showed that picker counting had the effect of accentuating the natural oscillations of phage frequencies due to a sampling effect (cf. fig. 7E, 7F with fig. 7C, 7D). Enlarging picker prongs and spacing them farther apart in the simulations (which more closely resembled the experimental conditions) resulted in larger oscillations that were more consistent with what was observed in the experiments (fig. 7A, 7B). In figures 3–6, simulation frequencies are determined by picker counting of the sample transferred to the next passage. Although this introduces sampling bias, it more accurately reflects the experimental design.
Another effect of picker counting was a kind of “genotyping bloat” in which the spatial coexistence region appears enlarged because the large phage sample on each prong can lead to a classification of coexistence even if one phage type greatly outnumbers the other; smaller picker prongs lead to smaller coexistence zones (fig. 7). This effect is even more pronounced with genotyping in the experimental system because phage grow out from each prong. We were able to capture this effect in simulations and thus increase the width of the coexistence regions by allowing for extra spread during picker counting (data not shown). The effects of prong size and distribution on oscillations observed in global densities and on genotyping bloat are examples of experimental artifacts that can be readily explored with appropriate simulation models. Nevertheless, α3 oscillations were more pronounced in the experimental data than in the simulations and were more pronounced with mixed than with structured transfer, suggesting that some factor not included in the simulations contributes to these oscillations.
Host Evolution Effects on Phage Oscillations
The role of resistant cells is also consistent with the observed oscillations in α3 frequency in the experiments. When α3 frequencies are low, the maintenance of spatial structure at transfer means that there will be large contiguous regions of the plate containing no α3 at the start of the next incubation period. φX174-resistant/α3-sensitive cells appearing in these regions are safe from α3 infection (and thus early death) during the early stages of the incubation and can reproduce, forming large population clusters. If, later in the incubation period, α3 comes into contact with a cluster of φX174-resistant cells—for example, if such a cell cluster grows into an area already occupied by α3—the α3 will be able to spread throughout this large population of α3-sensitive host cells. Of course, these regions likely also contain φX174 from transfers and replication in sensitive E. coli C, resulting in an area of coexistence. In subsequent transfers, the presence of α3 in these areas will suppress the expansion of the φX174-resistant/α3-sensitive clusters, and φX174 will outcompete α3 in sensitive E. coli C, resulting in oscillations of α3 frequency. This process will be most pronounced in long-incubation, structured-transfer experiments, where resistant cells have more opportunity to replicate. Thus, the combination of spatial structure and long incubation time provides a spatial refuge for the weak competitor, allowing coexistence and contributing to oscillations in α3 frequency. In fact, α3 oscillations were more pronounced in long-incubation experiments.
Phage Evolution Effects on Phage Oscillations
In this experimental system, it is not only the hosts that are subject to rapid evolution; the phage also evolve in response to the novel host environment, including competition within and between strains. In fact, one expects phage evolution to be more pronounced than host evolution because the resistant hosts are killed at the end of each passage and replaced with naive hosts. The phage, on the other hand, can continue to evolve throughout the experiment. In fact, α3 evolution was evident on the genotyping plates by changes in plaque morphology in some areas on all structured replicates. (The evolution of α3 was confirmed by sequencing but was not pursued for this study.)
Phage evolution would be expected to contribute the most to oscillations in the mixed-transfer experiments because any competitive phage variant arising on the plate would be spread more rapidly in the mixed than in the structured transfers. In fact, α3 oscillations are very pronounced in the mixed transfers. The short-incubation, mixed-transfer replicates show especially noteworthy oscillations (fig. 4A) in that they are synchronous and quite pronounced. The most likely explanation for this pattern is a short arms race between φX174 and α3. Initially φX174 dominated, almost pushing α3 to extinction. We speculate that evolution of α3 led to its resurgence and subsequent evolution of φX174 in response led to defeat and extinction of α3. Phage evolution has not yet been incorporated into our mathematical model.
Future Directions
Our combined experimental/theoretical approach allowed us to explore a possible mechanism for the unexpected coexistence of competing viral pathogens where one was predicted to be a superior competitor under our experimental conditions. The mechanism for coexistence in this system appears to depend on the evolution of resistance to the dominant competitor by the host species. Additionally, the host that is resistant to the dominant phage must experience sufficient population growth to support a viable subordinate phage population. These results were supported both experimentally and in the simulations, and they suggest that host evolution may play an important role in determining whether competitive exclusion occurs in such spatially structured systems. Future work with this model will focus on the role of phage evolution in the dynamics of competing parasites.
Acknowledgments
This work was supported in part by the National Institutes of Health grant P20 RR 16448 from the Centers of Biomedical Research Excellence program of the National Center for Research Resources. We thank B. Fane and D. Rokyta for discussions about phage, Y. Guan for advice on the simulations, K. Pepin for discussions on experimental methods, and L. Scott for comments on an earlier draft.
APPENDIX
Mathematical Model
In this appendix, we specify the rates at which states change at a site in the mathematical model. For this we use the notation V = vacant site, N = nonresistant cell, R = resistant cell (resistant to φX174 but susceptible to α3), φ = phage φX174, and α = phage α3.
Because we permit various combinations of cells and phage at a site, when specifying states we use the convention that a plus sign between adjacent cell and phage symbols means that they are at the same site but the phage has not attached to the cell; an asterisk between adjacent cell and phage symbols means that the phage has attached to the cell. Thus, N + φ indicates the presence of N and φ at the same site, but the phage has not (yet) attached, and N *φ indicates that φ has attached to N. Other cell and phage types lead to similar notations, and we also allow for multiple phage types at a site by notation such as N + φ + α or N *α + φ. Addition of phages is an “or” operation in the sense that φ + φ = φ, and so on. This just reflects the fact that our model keeps track of only the presence or absence of different phage particles at a site but does not distinguish between the actual numbers when the phage is present. We use the letter I to denote an infection rate, β to denote a cell reproduction rate, and λ to denote a rate of cell lysis; in each case, a subscript φ or α (respectively, N or R) on these rates identifies the phage (respectively, bacterial strain) to which it corresponds. Thus, for example, φX174 has mean attachment time 1/Iφ and mean latent period 1/λφ; resistant cells have mean doubling time 1/βR. Reproduction rates at a site x depend on the fraction of sites in the 3 × 3 local neighborhood of site x that contain the cell type in question; thus, fN(x) represents the fraction of the eight sites neighboring site x that contain an uninfected nonresistant cell and f R(x) represents the fraction of neighboring sites containing an uninfected resistant cell.
Because we are ignoring cell death other than through lysis of an infected cell, there are only four types of transitions: those involving attachment, cell reproduction, cell mutation, and the lysis of an infected cell. The transition rates are as follows: reproduction by nonresistant cell, V → N at rate βN · fN (x); reproduction by resistant cell, V → R at rate βR · fR (x); mutation of nonresistant cell, N → R at rate μ; attachment by φX174, N + φ → N*φ or N + φ + α → N*φ + α, each at rate Iφ; attachment by α3, N + α → N*α, N + φ + α → N*α + φ, R + α → R*α, or R + α + φ → R*α + φ, each at rate Iα; lysis of a φX174-infected cell, N*φ → φ or N *φ + α → φ + α, each at rate λφ; and lysis of an α3-infected cell, N*α → α, R*α → α, N*α + φ → α + φ, or R*α + φ → α + φ, each at rate λα. The last two transitions affect more than one site, with phage progeny deposited at all sites within the burst range; all other transitions affect only a single site at a time.
Literature Cited
- Abedon ST. Phage ecology. In: Calendar R, Abedon ST, editors. The bacteriophages. Oxford University Press; Oxford: 2006. pp. 37–46. [Google Scholar]
- Anderson RM, May RM. Infectious diseases of humans: dynamics and control. Oxford University Press; Oxford: 1991. [Google Scholar]
- Bernhardt TG, Roof WD, Young R. Genetic evidence that the bacteriophage φX174 lysis protein inhibits cell wall synthesis. Proceedings of the National Academy of Sciences of the USA. 2000;97:4297–4302. doi: 10.1073/pnas.97.8.4297. [DOI] [PMC free article] [PubMed] [Google Scholar]
- Bernhardt TG, Struck DK, Young R. The lysis protein E of φX174 is a specific inhibitor of the MraY-catalyzed step in peptidoglycan synthesis. Journal of Biological Chemistry. 2001;276:6093–6097. doi: 10.1074/jbc.M007638200. [DOI] [PubMed] [Google Scholar]
- Bohannan JMB, Lenski RE. Effect of resource enrichment on a chemostat community of bacteria and bacteriophage. Ecology. 1997;78:2303–2315. [Google Scholar]
- Brockhurst MA, Buckling A, Rainey PB. Spatial heterogeneity and the stability of host-parasite coexistence. Journal of Evolutionary Biology. 2006;19:374–379. doi: 10.1111/j.1420-9101.2005.01026.x. [DOI] [PubMed] [Google Scholar]
- Buckling A, Kassen R, Bell G, Rainey PB. Disturbance and diversity in experimental microcosms. Nature. 2000;408:961–964. doi: 10.1038/35050080. [DOI] [PubMed] [Google Scholar]
- Bull JJ, Badgett MR, Wichman HA, Huelsenbeck JP, Hillis DM, Gulati A, Ho C, Molineux IJ. Exceptional convergent evolution in a virus. Genetics. 1997;147:1497–1507. doi: 10.1093/genetics/147.4.1497. [DOI] [PMC free article] [PubMed] [Google Scholar]
- Bull JJ, Millstein J, Orcutt J, Wichman HA. Evolutionary feedback mediated through population density, illustrated with viruses in chemostats. American Naturalist. 2006;167:39–51. doi: 10.1086/499374. [DOI] [PubMed] [Google Scholar]
- Chao L, Levin BR. Structured habitats and the evolution of anticompetitor toxins in bacteria. Proceedings of the National Academy of Sciences of the USA. 1981;78:6324–6328. doi: 10.1073/pnas.78.10.6324. [DOI] [PMC free article] [PubMed] [Google Scholar]
- Chesson P. Mechanisms of maintenance of species diversity. Annual Review of Ecology and Systematics. 2000;31:343–366. [Google Scholar]
- Durrett R, Levin SA. The importance of being discrete (and spatial) Theoretical Population Biology. 1994a;46:363–394. [Google Scholar]
- Durrett R, Levin SA. Stochastic spatial models: a user’s guide to ecological applications. Philosophical Transactions of the Royal Society B: Biological Sciences. 1994b;343:329–350. [Google Scholar]
- Durrett R, Levin SA. Allelopathy in spatially distributed populations. Journal of Theoretical Biology. 1997;185:165–172. doi: 10.1006/jtbi.1996.0292. [DOI] [PubMed] [Google Scholar]
- Durrett R, Levin SA. Spatial aspects of interspecific competition. Theoretical Population Biology. 1998;53:30–43. doi: 10.1006/tpbi.1997.1338. [DOI] [PubMed] [Google Scholar]
- Hardin G. The competitive exclusion principle. Science. 1960;131:1292–1298. doi: 10.1126/science.131.3409.1292. [DOI] [PubMed] [Google Scholar]
- Hassell MP, Comins HN, May RM. Species coexistence and self-organizing spatial dynamics. Nature. 1994;370:290–292. [Google Scholar]
- Hochberg EM, Hassell PM, May RM. The dynamics of host-parasitoid-pathogen interaction. American Naturalist. 1990;135:74–94. [Google Scholar]
- Kerr B, Riley MA, Feldman MW, Bohannan BJM. Local dispersal promotes biodiversity in a real-life game of rock-paper-scissors. Nature. 2002;418:171–174. doi: 10.1038/nature00823. [DOI] [PubMed] [Google Scholar]
- Kreft JU, Bonhoeffer S. The evolution of groups of cooperating bacteria and the growth rate versus yield trade-off. Comments on Microbiology. 2005;151:637–641. doi: 10.1099/mic.0.27415-0. [DOI] [PubMed] [Google Scholar]
- Krone SM, Guan Y. Spatial self-organization in a cyclic resource-species model. Journal of Theoretical Biology. 2006;241:14–25. doi: 10.1016/j.jtbi.2005.11.005. [DOI] [PubMed] [Google Scholar]
- Krone SM, Lu R, Fox R, Suzuki H, Top EM. Modelling the spatial dynamics of plasmid transfer and persistence. Microbiology. 2007;153:2803–2816. doi: 10.1099/mic.0.2006/004531-0. [DOI] [PMC free article] [PubMed] [Google Scholar]
- Levin BR, Stewart MF, Chao L. Resource-limited growth, competition, and predation: a model and experimental studies with bacteria and bacteriophage. American Naturalist. 1977;111:3–24. [Google Scholar]
- Rainey PB, Travisano M. Adaptive radiation in a heterogeneous environment. Nature. 1998;394:69–72. doi: 10.1038/27900. [DOI] [PubMed] [Google Scholar]
- Schrag SJ, Mittler JE. Host-parasite coexistence: the role of spatial refuges in stabilizing bacteria-phage interactions. American Naturalist. 1996;148:348–377. [Google Scholar]
- Taylor LA. Bacteriophage-induced mutation in Escherichia coli. Proceedings of the National Academy of Sciences of the USA. 1963;53:1043–1051. doi: 10.1073/pnas.50.6.1043. [DOI] [PMC free article] [PubMed] [Google Scholar]
- Tilman D, Kareiva PM. Spatial ecology: the role of space in population dynamics and interspecific interactions. Princeton University Press; Princeton, NJ: 1997. [Google Scholar]
- Wei W, Krone SM. Spatial invasion by a mutant pathogen. Journal of Theoretical Biology. 2005;236:335–348. doi: 10.1016/j.jtbi.2005.03.016. [DOI] [PMC free article] [PubMed] [Google Scholar]