Lack of an inducible mouse model of glaucoma has hampered the application of the powerful mouse genetic technology to the study of the disease. The authors report a highly effective and reproducible method of inducing chronic elevation of intraocular pressure and glaucomatous optic neuropathy in mice by anterior chamber injection of polystyrene microbeads.
Abstract
Purpose.
To characterize a glaucoma model of mice, the authors adopted and modified a method of inducing the chronic elevation of intraocular pressure (IOP) by anterior chamber injection of polystyrene microbeads.
Methods.
Chronic elevation of IOP was induced unilaterally in adult C57BL/6J mice by injecting polystyrene microbeads to the anterior chamber. Effectiveness of microbeads of different sizes (small, 10 μm; large, 15 μm) on inducing IOP elevation was compared, and IOP was measured every other day using a tonometer. After maintaining elevated IOP for 2, 4, or 8 weeks, the degree of RGC and axon degeneration was assessed quantitatively using electron microscopy, fluorogold, retrograde labeling, and immunohistochemistry.
Results.
Eighty-one of 87 mice that received anterior chamber injection of microbeads exhibited consistent IOP elevation above that of control eyes. Injection of small microbeads induced longer and higher peak value of IOP elevation compared with that of the large microbeads. A single injection of small microbeads resulted in a 4-week elevation of IOP that was maintained to an 8-week period after a second injection of microbeads in week 4. As the duration of IOP elevation increased, RGC bodies and their axons degenerated progressively and reached an approximately 50% loss after an 8-week elevation of IOP.
Conclusions.
Anterior chamber injection of microbeads effectively induced IOP elevation and glaucomatous optic neuropathy in mice. Development of an inducible mouse model of elevated IOP will allow applications of mouse genetic technology to the investigation of the mechanisms and the evaluation of treatment strategies of glaucoma.
Glaucoma is a leading cause of blindness worldwide.1 It is characterized by progressive loss of retinal ganglion cells (RGCs), atrophy of optic nerve, and eventual loss of vision.2,3 Although it is known that elevation of intraocular pressure (IOP) is a major risk factor for glaucoma,4 the pathophysiology of the disease remains poorly understood. Current therapy that is directed at lowering IOP cannot completely stop the progression of the disease.5 Thus, further elucidating the mechanisms underlying RGC degeneration and developing new therapies that can prevent or delay progressive optic neuropathy in glaucoma are of critical importance.
Progress in understanding the pathogenesis of glaucoma has been largely hampered by the lack of an inducible mouse model of glaucoma. Animal models of glaucoma that simulate the RGC and optic nerve pathology in the human disease are of considerable importance in elucidating the mechanisms of the disease and in evaluating therapies. Although mouse models of glaucoma are uniquely useful because of the development of mouse genetic technology,6 the small size of the mouse eye has made both the induction and the measurement of IOP elevation challenging. In recent years, mice carrying spontaneous mutations that result in chronic age-related glaucoma, such as DBA/2J mice, have been documented.7–9 A distinguishing feature of DBA/2J mice is the development of iris illumination defects associated with pigment dispersion into the anterior chamber and accumulation of pigment granules in the trabecular meshwork that block the drainage system and lead to IOP elevation.8 However, although these are inbred mice carrying a fixed genetic background, they exhibit a high degree of individual variability and asymmetry in disease development.10 Moreover, use of DBA/2J mice has been limited by the difficult and lengthy process of introducing genetic mutations or applying mouse genetic technologies to this mouse line. Development of an effective and reproducible method of inducing chronic IOP elevation and glaucomatous neurodegeneration in mice would prove to be extremely useful.11
A well-studied method for inducing IOP elevation in animals such as monkeys and rats is the application of laser burns to outflow tissues.12 Inducible models of glaucoma in mice have also been reported, using laser photocoagulation of episcleral veins13,14 or sclerosis of episcleral veins by injecting hypertonic saline15 to obstruct aqueous humor outflow. Complications of these methods include thermal damage to the sclera, induction of intraocular inflammation, and irreversible ocular surface damage. Moreover, the small size of the mouse eye poses significant difficulties in applying these approaches to induce consistent elevations of IOP and in using a variety of conventional technologies. A recent study16 described a simple and reproducible means to elevate IOP in the rodent eye by injection of polystyrene microbeads into the anterior chamber. Here, to further develop and characterize a glaucoma model in mice, we applied a modified version of this protocol to elevate IOP and reported that this method induced RGC and axon degeneration similar to that in glaucoma.
Materials and Methods
Animal Use
The experimental procedures and use of animals were approved and monitored by the Animal Care Committee of the Schepens Eye Research Institute and conformed to the ARVO Statement for the Use of Animals in Ophthalmic and Vision Research. In total, 36 mice that received anterior chamber injection of PBS served as controls; 87 mice that received injections of either 10 or 15 μm polystyrene microbeads were used as experimental groups. Excluding the 6 mice that did not exhibit IOP elevation after microbead injection, there were 27 mice that received injection of 15 μm microbeads, 42 mice that received a single injection of 10 μm microbeads, and 12 mice that received two injections of 10 μm microbeads at days 0 and 23, respectively. The 42 mice with a single 10-μm microbead injection were killed at 2 and 4 weeks after injection, and the 12 mice that received two injections were killed at 8 weeks. Among them, 18 were used for electron microscopy, and 12 received Fluoro-Gold (FG) injection and were analyzed by FG and β-III-tubulin double immunolabeling. Thirty additional mice were analyzed by β-III-tubulin immunolabeling alone. Thus, in total 81 mice injected with microbeads were analyzed.
Induction of IOP Elevation in Mice
Mice were anesthetized by intraperitoneal injection of a ketamine (120 mg/kg)/xylazine (12 mg/kg) mixture (Phoenix Pharmaceutical, Inc., St. Joseph, MO) supplemented by topical proparacaine HCl (0.5%; Bausch & Lomb, Tampa, FL). Elevation of IOP was induced unilaterally in adult C57BL/6J mice by injection into the anterior chamber of polystyrene microbeads of the right eye with a uniform diameter of either 10 or 15 μm (Invitrogen, Carlsbad, CA). The microbeads had been resuspended in phosphate-buffered saline (PBS) at a final concentration of 7.2 × 10⁶ (10 μm beads) or 5.0 × 10⁶ (15 μm beads) beads per milliliter. To control precisely the small volume (2 μL) of anterior chamber injection, we used a glass micropipette connected with a Hamilton syringe. The right cornea was gently punctured near the center using a 30-gauge needle to generate easy entry for glass micropipette injection. After this entry wound, 2 μL microbeads were injected into the right anterior chamber using a glass micropipette. Another group of mice that served as controls received an injection of 2 μL PBS to the right anterior chamber. Our protocol differed from that of an earlier similar study16 that tested only the effects of 15 μm microbeads without using an initial corneal entry wound with a 30-gauge needle. In addition, the earlier study used the opposing eye injected with an equivalent volume of PBS as an internal control.
IOP Measurement
IOP was measured every other day in both eyes using a tonometer (TonoLab; Colonial Medical Supply, Espoo, Finland) as previously described.17 Briefly, IOP measurements were conducted consistently at the same time in the morning. Mice were anesthetized by isoflurane inhalation (2%–4%; Webster Veterinary, Sterling, MA) that was delivered in 100% oxygen with a precision vaporizer. Measurement was initiated within 2 to 3 minutes after animals lost consciousness, which was defined as failure to detect motion in response to forced movement and absence of eye blinking. The tonometer takes six measurements by internal software and, after elimination of high and low readings, generates and displays an average. We considered this machine-generated average as one reading; six readings were obtained from each eye, and the means of six readings were calculated to determine the IOP.
Quantification of RGC Axon Loss with Electron Microscopy
Procedures for quantification of RGC axonal loss after IOP elevation were essentially as described.18 Briefly, mice received 10 μm microbeads or PBS on days 0 and 23 were killed at 2, 4, and 8 weeks after the first injection. Optic nerves were dissected and fixed in Karnovsky solution (50% in phosphate buffer) overnight. Semithin cross-sections of the nerve taken at 1.5 mm posterior to the globe were stained with toluidine blue to reveal the nerve structure. Ultrathin (60–90 nm) optic nerve cross-sections were then prepared and stained with uranyl acetate and lead citrate and were examined with a transmission electron microscope (EM410; Philips, Eindhoven, The Netherlands). Thirteen standard rectangular regions (234 μm2) randomly selected from each optic nerve section were photographed at 4400× magnification. All axons in the photomicrograph were counted, and axonal densities were calculated by averaging the data obtained from 13 regions. The areas of optic nerve cross-sections were determined with ImageJ software (developed by Wayne Rasband, National Institutes of Health, Bethesda, MD; available at http://rsb.info.nih.gov/ij/index.html), and the percentage of axon loss was calculated by dividing the number of axons in nerve sections of PBS- or microbead-injected eyes with that of the contralateral eye.
Retrograde Labeling of RGCs by FG
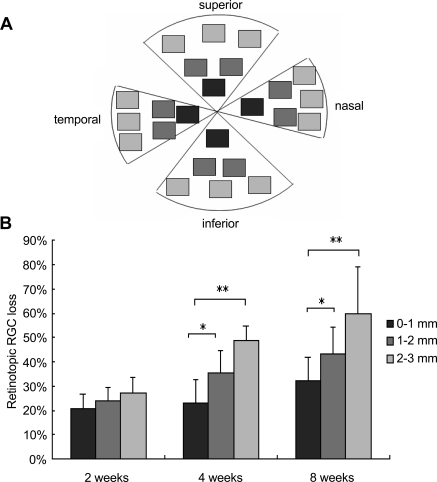
A standard procedure for RGC labeling and quantification was used essentially as described previously by us.18–20 In brief, mice were anesthetized, and a midline incision was made in the scalp above the superior colliculus (SC). A 1-mm3 piece of sterile sponge (Gelfoam; Upjohn, Kalamazoo, MI) was soaked in FG solution (Fluorochrome, Denver, CO; 2% in PBS) and inserted over the SC, the primary central target for RGCs in rodents.21 FG transported retrogradely to RGC somas in the retina, where the labeling persisted for at least 30 days.22 Considering that glaucoma alters the retrograde transport of RGC axons,23 FG was injected into the SC 7 days before microbead or PBS (control) injection. At 2, 4, and 8 weeks after microbead or PBS injection, mice were killed, and the retinas were dissected and fixed in 4% paraformaldehyde overnight. Retinal flat mounts or sections were prepared and examined under a Nikon (Tokyo, Japan) microscope equipped with fluorescence illumination. For RGC counting, the retinal flat mounts were divided into quadrants: superior, temporal, nasal, and inferior. Using the optic nerve head (ONH) as the origin, six standard regions that were distributed at a 1-mm interval along the radius (0.09 mm2) were selected from each quadrant: three were from the peripheral region (2 mm from the ONH), two were from the intermediate region (1 mm from the ONH), and one was from the central region (see Fig. 8A). Therefore, in total 24 rectangular regions of each eye were photographed at 40× magnification with confocal microscopy. Total areas of retinal flat mounts were measured using Image J software. All FG-positive cells in the GCL that were photomicrographed were counted. Average RGC densities of the entire retina and of the central, intermediate, and peripheral regions were calculated, respectively. The percentage of RGC loss was determined by comparing RGC density with that obtained from the corresponding regions of the contralateral control eyes.
Figure 8.
Retinotopic RGC loss in mice with elevated IOP. (A) Schematic illustration of RGC sampling and counting in the flat mount retina. (B) Quantification of RGC loss in the central, intermediate, and peripheral retinal regions of retinal flat mounts. Significant difference in the rate of RGC loss between the central and peripheral retina was noted at 4 and 8 weeks, but not at 2 weeks, after IOP elevation. MB, microbeads. Values are mean ± SD. *P < 0.01; **P < 0.001.
Retinal Histology and Immunohistochemistry
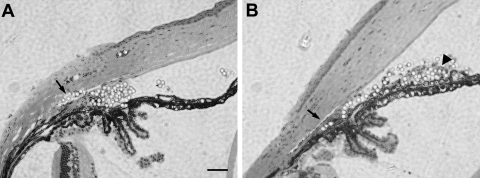
The procedure for immunohistochemistry was essentially as described.24 Mice that received 10 μm microbeads or PBS injections were killed at 1 to 8 weeks after injection, and eyes and optic nerves were dissected and fixed in 4% paraformaldehyde overnight. Retinal flat mounts or transverse sections (14 μm) were incubated with a primary antibody against an RGC-specific marker, β-III-tubulin25,26 (Tuj1; Sigma-Aldrich, St. Louis, MO), followed by an Alexa Fluor 488–conjugated secondary antibody (Invitrogen). The degree of RGC loss was assessed in both retinal flat mounts and sections, as previously described,24 and all cells in the GCL positively labeled by Tuj1 were counted. The results were compared with those obtained through FG labeling. In some groups, FG-labeled retinal sections or flat mounts were double-immunostained with Tuj1 antibody, and both FG-positive and Tuj1-positive cells were counted as described. Retinal areas were measured using Image J software, and RGC density was calculated. The percentage of RGC loss was determined by dividing the RGC number and density with those of the corresponding regions of the contralateral uninjected eyes. To minimize the loss of microbeads during tissue processing and to allow assessment of microbead distribution after anterior chamber injection, plastic sections were used (Fig. 1) in which tissues were held tightly in the embedding media. To this end, eyeballs were fixed in 4% paraformaldehyde overnight and embedded in glycol methacrylate. Plastic retinal sections (1 μm) were stained for hematoxylin and eosin to reveal general retinal and anterior chamber morphology.
Figure 1.
Distribution of microbeads in the anterior chamber after injection. Photomicrograph of hematoxylin and eosin–stained eye sections taken from mice at (A) 7 and (B) 28 days after anterior chamber injection of 10 μm polystyrene microbeads. Note the accumulation of microbeads in the anterior chamber angle and Schlemm's canal (arrows). Scale bar, 50 μm.
Statistical Analysis
Statistical significance of all the quantification studies, defined by P < 0.05, were determined by two-tailed paired Student's t-test or one-way ANOVA followed by a Bonferroni test. Data are expressed as mean ± SD.
Results
Microbead-Induced Elevation of IOP in Mice
To develop an efficient means that allows application of mouse genetic technology to the study of glaucoma, we adopted and modified a method of inducing IOP elevation by anterior chamber injection of polystyrene microbeads.16 After injection, microbeads were found to accumulate at the angle of the anterior chamber or they entered the Schlemm's canal by day 7 after microbead injection (Fig. 1A), causing blockage of the outflow of aqueous humor. Microbeads of differently sized 10- and 15-μm beads were compared for their ability and efficacy in elevating IOP. We noted that more 10-μm microbeads entered the Schlemm's canal than 15-μm microbeads (Fig. 1; n = 3/group). By day 28, however, very few microbeads were found in the Schlemm's canal (Fig. 1B). By slit lamp examination, we noted no signs of inflammatory responses (opaque cornea or edema, iris exudation) or overt damage in the anterior segment of mice that received microbead injection. Of the 87 mice injected with microbeads, six showed corneal opacity or signs of inflammation in the anterior chamber (e.g., cloudy anterior chamber) and were excluded from the study.
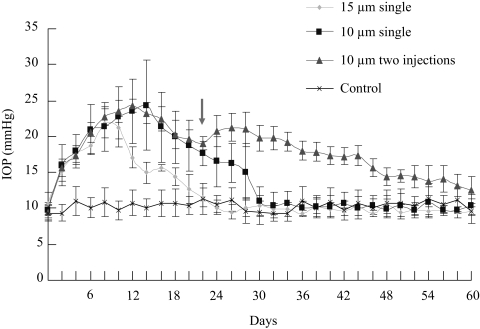
To examine IOP elevation, mouse IOP was measured every other day before and after microbead injection. Uninjected C57BL/6J mice (n = 10) revealed a normal IOP at 10.0 ± 1.5 mm Hg. Mice that received PBS (n = 10) injection into the anterior chamber exhibited a steady IOP level (average, 10.3 ± 1.6 mm Hg) throughout the period measured that was not significantly different from that of the normal (uninjected) group (Fig. 2). Significant elevation of IOP above that of the control-injected groups was induced within 2 days after a single injection of either 10 or 15 μm microbeads (Fig. 2). IOP elevation after 15-μm microbead injection lasted approximately 2 weeks and reached a peak between days 7 and 10 after injection, with an average peak value of 21.8 ± 2.1 mm Hg (Fig. 2). A single injection of 10 μm microbeads induced an IOP elevation that lasted for 4 weeks, 1 week longer than was observed in the 15 μm microbead-injected group. In the first 7 days, 10 μm microbeads induced IOP elevation kinetics similar to those of the 15 μm microbead-injected group; after day 7, the IOP level of the 10 μm microbead-injected group continued to climb and reached a peak of 24.4 ± 6.2 mm Hg between days 12 and 17 (Fig. 2). Together, all 81 mice that received microbead injection into the anterior chamber exhibited significant IOP elevation compared with the PBS-injected group. Thus, anterior chamber injection of microbeads effectively induces chronic and reversible elevation of IOP in mice. Injection of the smaller (10 μm) microbeads is more effective because it induces a longer and higher peak of IOP elevation than the larger beads.
Figure 2.
Assessment of IOP elevation after microbead injection. Mice that received PBS injection (control) had a steady IOP level that was maintained at an average value of 10.3 ± 1.6 mm Hg throughout the period (n = 10). A single injection of 15 μm microbeads (15 μm single) induced a transient elevation of IOP that lasted for more than 2 weeks (n = 27), whereas injection of 10 μm microbeads (10 μm single) induced IOP elevation lasting for 4 weeks (n = 42). A second dose of microbead injection on day 23 (arrow) maintained the elevation of IOP up to 8 weeks (two 10-μm injections; n = 12). Values are mean ± SD.
To determine whether repeated application of microbeads could extend IOP elevation for a longer period, in another group of mice, a second dose of 10 μm microbeads was injected to the mouse anterior chamber on week 4 (day 23), before the IOP had returned to normal. Similar to what was shown in rats,16 we found that the second injection of microbeads extended the period of IOP elevation at least to 8 weeks in mice (Fig. 2). Thus, anterior chamber injection of microbeads in mice successfully induced IOP elevation, and this IOP elevation could be extended to 8 weeks by repeated injections.
RGC Axon Loss after IOP Elevation
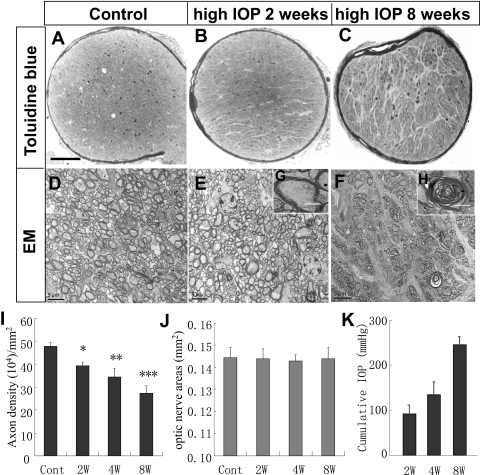
Given that RGC axon degeneration is a hallmark of glaucoma, we started evaluating elevated IOP-induced glaucomatous changes by quantifying axon numbers and densities in optic nerve cross-sections at various times after microbead injection. Mice that received anterior chamber injection of 10 μm microbeads were killed at 2, 4, and 8 weeks after injection; mice killed at week 8 received the second injection of microbeads during week 4. RGC axons of the control nerve were densely packed, forming fascicles and being covered by intact myelin sheath (Figs. 3A, 3D). IOP elevation induced a significant reduction of axonal density in optic nerve sections (Figs. 3B, 3C, 3E, 3F). Many axons in these nerves showed signs of degeneration (Figs. 3E, 3F). Retinal ganglion cell axons with intact myelin sheath and abundant prominent microtubules or mitochondria were considered healthy and were counted. We noted that as the duration of IOP elevation increased over time, numbers of axons decreased with a drop of axon densities from 39.4 ± 1.6 × 10⁴ axons/mm2 at 2 weeks after IOP induction to 34.4 ± 3.7 × 10⁴ axons/mm2 at 4 weeks and 27.3 ± 3.3 × 10⁴ axons/mm2 at 8 weeks, respectively, after IOP induction. No significant changes in retinal areas were detected before or after IOP elevation (Fig. 3J). Thus, we calculated equivalent to 22.4% ± 2.1% (2 weeks), 28.0% ± 3.1% (4 weeks), and 42.0% ± 3.8% (8 weeks) axonal loss, respectively, compared with the control optic nerve sections (Fig. 3G). These data are in agreement with those of a previous study that reported a 20% to 27% loss of RGC axons at 4 to 5 weeks after microbead injection in rodents.16 We did observe a higher rate of RGC axon loss in central optic nerve sections than in peripheral sections, especially at 8 weeks after IOP elevation. These data further demonstrate that anterior chamber injection of microbeads induced glaucomatous RGC axon degeneration in mice that progressed as the duration of IOP elevation increased.
Figure 3.
Elevated IOP-induced RGC axon degeneration. (A–C) Photomicrographs of toluidine blue–stained optic nerve sections taken from (A) control eye and the eyes at (B) 2 and (C) 8 weeks after IOP elevation. Note the increase of glial scarring in the optic nerve cross-section taken at 8 weeks after induction of IOP elevation. Scale bar, 100 μm. (D–F) Electronic microscopy photomicrographs of optic nerve sections taken from the (D) control or at (E) 2 or (F) 8 weeks after microbead injection. Scale bar, 5 μm. Insets: high-magnification images of (G) healthy and (H) degenerating axons. Scale bar, 2 μm. (I) Quantification of RGC axon densities in control (cont) or at 2 (2W), 4 (4W), and 8 (8W; with a second injection of microbeads on day 23) weeks after the induction of IOP elevation. Values are mean ± SD (n = 6/group; Student's t-test; *P < 0.05; **P < 0.01; ***P < 0.001 compared with the control group). (J) Measurement of the areas of optic nerve cross-sections in mice. No significant differences in optic nerve areas were noted among the groups examined. (K) Cumulative exposure to elevated IOP in experimental groups presented in (I) at 2, 4, and 8 weeks after the induction of IOP elevation.
Elevated-IOP Induced RGC Loss Assessed by FG-Retrograde Labeling
To further characterize glaucomatous changes in the retina of the microbead-injected mouse model, we quantified RGC loss at various time points after IOP elevation. We used a classic method that labeled RGCs by placing a retrograde neuronal tracer, FG, into their central target, the SC.22 FG labeling relies on axonal transport to reach RGCs, which is thought to be affected by IOP elevation.23 Given that FG labeling has been shown to persist in RGCs for at least 30 days after injection,22 we placed FG bilaterally into the SC 7 days before rendering IOP elevation. Mice were then injected unilaterally with 10 μm microbeads to the anterior chamber and were killed on days 14 and 28 after injection. The retinas were flat mounted, and RGC numbers and cell densities were quantified.
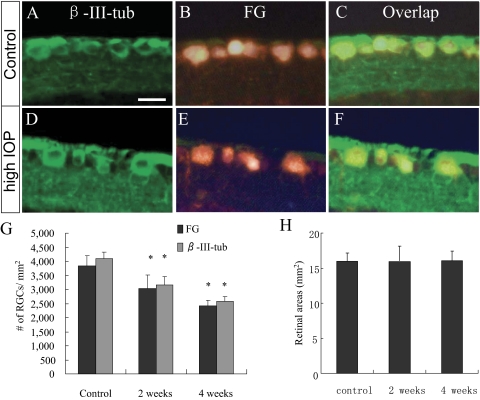
Significant reductions of RGC number and densities were noted in the eyes that received microbead injection compared with the contralateral control eyes, as revealed by FG retrograde labeling (Fig. 4). Mice that received PBS injection had an average RGC density of 3828 ± 355 cells/mm2, similar to what was seen in uninjected contralateral controls (Fig. 5). No significant difference in retinal area changes was noted before or after the induction of IOP elevation (Fig. 5H). Thus, we calculated that mice injected with microbeads and killed on day 14 showed an RGC density of 3040 ± 465 cells/mm2, corresponding to a 25.5% ± 5.6% loss of RGCs compared with contralateral eyes. By 28 days, mice receiving a single injection of 10 μm microbeads displayed a 38.3% ± 5.7% RGC loss compared with the contralateral control eyes. Thus, microbead-induced IOP elevation induces typical glaucomatous RGC degeneration in mice.
Figure 4.
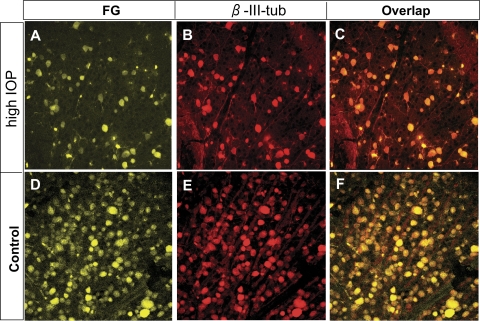
Retrograde labeling of RGCs by FG and β-III-tubulin immunohistochemistry. Epifluorescence photomicrographs of retinal flat mounts showing RGCs double-labeled by FG (A, C, D, F) and immunodetection of β-III-tubulin (β-III-tub) (B, C, E, F) in both the control (D–F) and the IOP-elevated (A–C) retinas. These images were taken from the corresponding intermediate regions of the mouse retinas. Note complete overlap of FG and β-III-tubulin labeling and similar immunofluorescence intensity of anti–β-III-tubulin staining in individual RGCs of the control and IOP-elevated retinas. Scale bar, 10 μm.
Figure 5.
Complete overlapping of FG-positive cells with anti–β-III-tubulin immunolabeling. (A–F) Epifluorescence photomicrographs of retinal sections showing FG-positive RGCs that were immunostained by anti–β-III-tubulin in both the control (A–C) and the IOP-elevated (D–F) retinas. Note the similar immunofluorescence intensity of anti–β-III-tubulin staining in individual RGCs of the control and the IOP-elevated retinas. Scale bar, 10 μm. (G) Comparison of RGC counts assessed by anti–β-III-tubulin immunostaining and FG retrograde labeling (n = 6/group). Counts of β-III-tubulin–positive cells revealed significant loss of RGCs compared with what was counted using FG labeling. Values are mean ± SD. *P < 0.05 compared with the control group by Student's t-test. Note that no significant differences in RGC counts were noted between the two methods used (P = 0.24). (H) Areas of retinal flat mounts in control and microbead-injected eye. No significant differences among groups were noted.
β-III-Tubulin as a Marker for RGC Quantification in Glaucoma Model
Next, we compared RGC counts obtained by FG labeling with those of immunolabeling with β-III-tubulin, a marker of neuronal lineage cells that is highly expressed in the RGC layer. Although it is associated with RGC bodies, it is only weakly detectable in a subpopulation of amacrine and bipolar cells in the inner nuclear layer.27 Thus, β-III-tubulin is commonly used as a marker for identifying RGCs in the retina and for quantifying RGC loss in various optic nerve injury models.26–31
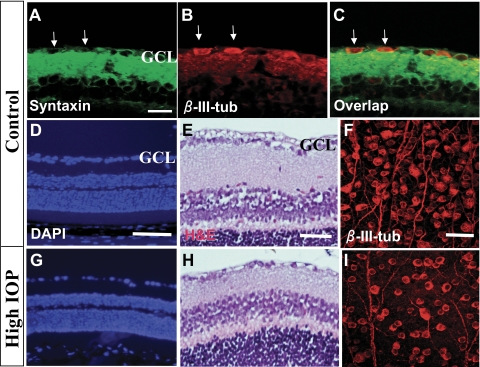
To compare β-III-tubulin immunolabeling with FG labeling of RGCs, FG was placed bilaterally in the SC 7 days before microbead injection. Mice were then injected unilaterally with 10 μm microbeads to the anterior chamber and were killed on days 14 and 28 after injection. Either retinal flat mounts or sections were prepared and subjected to immunolabeling with anti–β-III-tubulin. FG-labeled cells overlapped almost completely with β-III-tubulin–positive cells when they were examined in both retinal flat mount (Fig. 4) and retinal sections (Figs. 5A–F), suggesting that β-III-tubulin can be used equivalently as FG to label RGCs. Counts of β-III-tubulin–positive cells revealed a significant loss of RGCs comparable to that was shown by FG labeling (Fig. 5G). No significant changes in retinal areas were detected before or after IOP elevation (Fig. 5H). Moreover, double immunolabeling of β-III-tubulin with the amacrine cell marker syntaxin revealed that anti–β-III-tubulin strongly labeled the RGC bodies, but not the displaced amacrine cells, in the GCL (Figs. 6A–C). Weak to moderate labeling of β-III-tubulin with some cellular processes of a small population of displaced amacrine cells was also noted. These data are consistent with the previous reports that established β-III-tubulin as a marker for RGC quantification after injury.24–32 Unlike Thy-1 and other reported RGC markers,33 quantitative analysis of anti–β-III-tubulin immunolabeling intensity of individual RGCs, using ImageJ, did not detect any significant changes in IOP-elevated eyes and their contralateral normal eyes or in PBS-injected eyes (data not shown). Thus, β-III-tubulin can serve as a reliable marker for RGC labeling and quantification in an experimental mouse model of glaucoma.
Figure 6.
RGC loss associated with IOP elevation. (A–C) Epifluorescence photomicrographs of retinal sections double-immunolabeled with primary antibodies against the amacrine cell marker Syntaxin (red; A, C) and β-III-tubulin (β-III-tub; green; B, C). Arrows: Syntaxin-positive/β-III-tub cells. (D–I) Photomicrographs of retinal sections stained with nuclear marker DAPI (D, G) or hematoxylin and eosin (E, H) to reveal retinal morphology. (F, I) Anti–β-III-tubulin–stained retinal flat mounts taken at the intermediate region showing RGC morphology. These retinal samples were taken at 8 weeks after PBS (Control; A–F) or microbead (High IOP; G–I) injection. Scale bars: 100 μm (D, G), 50 μm (E, H), 20 μm (A–C, F, I).
Time-Dependent Study of RGC Loss Using β-III-Tubulin Immunohistochemistry
After confirmation of β-III-tubulin as a reliable marker for RGCs, we performed more extensive and longer term quantifications of RGC loss after IOP elevation. Mice that received anterior chamber injection of microbeads were killed at 2, 4, and 8 weeks after injection, as described. Retinal flat mounts and sections were prepared and immunolabeled with anti–β-III-tubulin. The number of RGCs was counted in both preparations, and the results were compared.24
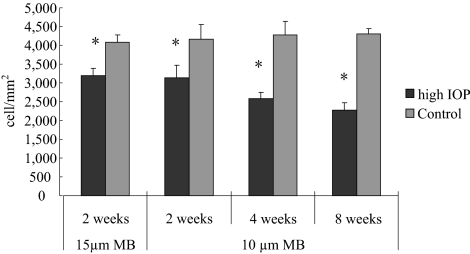
RGC counts obtained from retinal flatmounts and sections using β-III-tubulin immunohistochemistry showed a consistent progressive loss of RGCs. Reduction of RGC density was noted in the eyes that received microbead injection compared with the contralateral control eyes, as was shown by DAPI and hematoxylin and eosin staining and by β-III-tubulin immunolabeling (Figs. 6D–I). No significant differences in the thickness of the other retinal layers, including the INL and ONL, were noted (Figs. 6D, 6E, 6G, 6H). The data suggest that injection of microbeads induces IOP elevation and glaucomatous RGC loss without affecting other retinal layers. Mice that received PBS injection displayed an average RGC density of 4101 ± 237 cells/mm2, similar to that obtained from the uninjected contralateral control eyes. Mice that received 10 μm microbead injection displayed an average RGC density of 3150 ± 309 cells/mm2 by day 14 or a 23.8% ± 2.3% loss of RGCs compared with the control eyes (Fig. 7). By the end of 4 weeks, mice receiving a single injection of 10 μm microbeads displayed a 35.8% ± 4.4% RGC loss compared with the contralateral control eyes. By 8 weeks, mice that received a second injection of microbeads at week 4 had a 45.3% ± 3.9% RGC loss compared with contralateral controls (Fig. 7). Mice receiving 15 μm microbead and killed on day 14 showed an RGC density of 3183 ± 208 cells/mm2, corresponding to a 21.2% ± 5.0% loss of RGCs compared with the contralateral eyes. Thus, when examined on day 14, no significant difference of RGC loss was found between mice that received 10 μm and 15 μm microbead injections, suggesting a close correlation between the RGC loss and IOP elevation rather than with the size of beads. Together, these results indicate a loss of RGCs correlating with the increased duration of IOP elevation.
Figure 7.
Quantification of RGC loss after IOP elevation. RGC counts in retinal sections of mice that received microbead injection, in which RGCs were labeled with anti–β-III-tubulin immunohistochemistry. Mice that received anterior chamber injection of 15 μm microbeads were killed at 2 weeks (n = 10), and those that received 10 μm microbeads were killed at 2 (n = 8), 4 (n = 6), and 8 (n = 8) weeks after injection. Mice killed at week 8 received a second injection of microbeads at week 4 to maintain the elevated IOP. RGC counts taken from the uninjected contralateral eyes were used as controls. *P < 0.001 compared with the corresponding controls by Student's t-test.
Retinotopic RGC Loss in Mice with Elevated IOP
To examine further whether microbead injection-induced RGC degeneration follows a specific retinotopic pattern, such as that seen in glaucoma patients and that is usually higher in the peripheral than the central retina,33,34 we compared the degree of RGC loss in different regions of the mouse retina. RGC densities were counted in retinal flat mounts with radial coordinates. RGCs doubled labeled by anti–β-III-tubulin and FG were counted at a 1-mm intervals along the radius, with six selected frames within each quadrant (Fig. 8A). Consistent with what has been reported,35 RGC densities in normal mice showed no significant difference in the inferior and the superior retina, whereas the density of the nasal retina was significantly higher than that of the temporal retina (data not shown). At day 14 after IOP elevation, we did not detect a significant difference in the rate of RGC loss between the peripheral (27.2% ± 6.8%) and the central (20.6% ± 6.1%) retina. At 4 weeks, however, the rate of RGC loss was significantly higher in the peripheral (48.5% ± 6.3%; P < 0.001) and the intermediate retinal regions (35.6% ± 8.5%; P < 0.05) than in the central retina (23.2% ± 9.7%; Fig. 8B). At 8 weeks, the differences in the rate of RGC loss between the peripheral (60.0% ± 19.3%; P < 0.01), intermediate (43.5% ± 10.9%; P < 0.05), and central (32.4% ± 9.2%) regions of the retina became even more apparent (Fig. 8B). Cell counts of anti–β-III-tubulin–labeled and FG-labeled retinal whole mounts yielded a similar result. Consistent with other reports, we also noticed clustered or segmental loss of RGCs,36 especially prominent in the peripheral retina, on a background of diffused loss. These data suggest an induction of chronic RGC degeneration that follows a retinotopic pattern after microbead injection and IOP elevation in mice.
Discussion
In the present study, we applied a highly effective and reproducible method modified from a recent application of microbead injection to induce IOP elevation in mice.16 A single injection of polystyrene fluorescence microbeads to the mouse anterior chamber induced IOP elevation up to 4 weeks, without causing overt ocular structure damage or inflammatory responses while inducing RGC and axon degeneration that simulates glaucomatous changes. A second injection of microbeads extends the period of IOP elevation to 8 weeks, resulting in 50% RGC loss.
An intriguing finding has been that anterior chamber injection of 10 μm beads induced longer duration and higher peak value of IOP elevation compared with injection of 15 μm beads. Anterior chamber injection of microbeads induced IOP elevation by obstructing the trabecular meshwork and Schlemm's canal and reducing ocular flow. There appeared to be a causal correlation between the number of beads that entered the Schlemm's canal and the magnitude of IOP elevation. At day 7 after injection, when elevated IOP was reaching its peak, many microbeads were found in the Schlemm's canal. In agreement with this observation, more 10-μm microbeads were seen to enter the canal than 15-μm beads, consistent with the fact that the smaller beads induced longer and higher IOP elevation. It is unlikely that these differences were caused by the loss of larger beads during tissue handling. When evaluating microbead distribution in the eye, we processed tissue sections using plastic embedding (glycerol methacrylate), which is known to hold tissues firmly. Moreover, microbeads that had entered the Schlemm's canal were tightly embraced by surrounding tissues and did not easily become loose. The result also suggests that microbeads that stayed in the anterior chamber and trabecular meshwork might have been less effective at blocking ocular flow than those that entered Schlemm's canal. Elevated IOP was observed after day 28 following the injection of microbeads, when few beads were seen in the Schlemm's canal but were seen in the anterior chamber surrounding the trabecular meshwork. Although future studies are warranted for further characterization of the actions of beads in the eye, this observation suggests that, by applying beads of different sizes, it may be possible to vary the duration and magnitude of IOP elevation in mice.
It is also fascinating to note that RGC loss after 4 weeks in a microbead-induced model of IOP elevation appeared to follow a retinotopic fashion. This is in agreement with an earlier report that examined RGC degeneration in a rat model of elevated IOP, which reported an increase in cell death in the peripheral retina at the sixth week but not during the initial period of IOP elevation.37 By comparison of RGC density with the corresponding positions in the contralateral retina, we found a uniform loss of RGCs in the peripheral and central retina at 2 weeks after IOP elevation; from 4 weeks onward, there was a significant increase in RGC loss in the peripheral retina compared with the central retina. At present, the reason peripheral RGCs are more susceptible to elevated IOP remains unclear.
Another interesting finding in the present study was that counts of RGCs using both anti–β-III-tubulin immunolabeling and FG-labeling yielded similar results. Our calculated total number of RGCs in control mice was slightly lower than that reported by another group that used a similar FG-labeling method to obtain RGC counts.38 Such variation falls within the normal range of the reported RGC counts in mice, which vary between 40,000 and 75,000 RGCs per retina.39 In all likelihood this variation can be attributed to procedures and duration of retinal fixation and flat mount preparation and to the individual accountability of the different groups. We noted that the level of expression of β-III-tubulin in individual RGCs appeared to remain constant, or at least was not reduced, after the induction of IOP elevation. Although anti–β-III-tubulin is known to label weakly a subpopulation of amacrine and bipolar cells, this labeling is usually found in the inner nuclear layer, not the ganglion cell layer where RGCs reside.27 Thus, the antibody has been commonly used for quantification of RGC survival in optic injury models.26–32 However, elevation of IOP has been reported to result not only in the slowly progressive death of RGCs but also in the downregulation of expression of a large number of RGC-associated genes.40,41 Quantification of RGC loss in animal models of glaucoma is usually carried out by FG retrograde labeling.22 However, the technique has its limitations: labeling of RGCs depends on active axonal transport, a cellular function that is often compromised under elevated IOP.42 Thus, finding reliable markers that can be readily used to identify RGCs in the glaucomatous retina is important. A recent report has identified γ-synuclein as a highly specific marker for RGCs.43 Here, we show that β-III-tubulin immunolabeling also colocalizes completely with RGCs prelabeled by FG before the initiation of IOP elevation. In agreement with previous reports,24–32 anti–β-III-tubulin antibody specifically recognized RGC bodies while labeling weakly cellular processes of displaced amacrine cells or other retinal neurons. No apparent decrease in the intensity of β-III-tubulin immunolabeling was noted before or after IOP elevation. These data thus suggest that β-III-tubulin can be used as a reliable marker for RGC labeling and quantification in experimental models of glaucoma.
It should be noted that the magnitude and time course of IOP elevation in the present study appeared to differ from those of a recent application of microbead injections.16 In that study, which used tonometry to measure IOP, a single injection of 1 μL of 15 μm microbeads resulted in a total of approximately 1000 microbeads in the anterior chamber. With that number, IOP was elevated by approximately 30% in 2 to 3 days after injection and lasted for approximately 4 weeks. In our model, a single 2-μL injection of either 10 or 15 μm beads resulted in an estimated injection of 5000 to 7000 beads and caused IOP elevation 50% above baseline in 2 days. The IOP level continued to increase after day 2 and reached a peak that doubled the baseline IOP value at 7 to 14 days. We attribute these differences to our methods of assessing IOP values and to the higher numbers and volumes of microbeads injected. In the present study, the tonometer, which is specifically designed for rodent animals, was used to allow more accurate assessment of IOP and its fluctuation than the tonometer that was used in the previous report.16 Moreover, we used a 30-gauge needle to generate an easy entry for glass micropipette injection, which might create a larger wound that could result in the requirement for a longer period of IOP elevation before it reached the maximal levels. The higher concentration of microbead injection might also have contributed to the different kinetic and maximal values of IOP evaluation compared with the previous report. However, despite these differences, this modified procedure of elevating IOP resulted in an approximately 28% decrease in RGC axons in the nerve, whereas the earlier report by Sappington et al.16 resulted in a 20% to 27% loss of axons over 4 to 5 weeks. In any case, both these methods demonstrate a consistent and reversible induction of chronic IOP elevation in mice with microbead injection without causing irreversible damage to the ocular structures.
In summary, we have applied a convenient and effective method of inducing IOP elevation in mice. The degeneration of RGCs in our model was not uniformly distributed across the retinal surface, consistent with what has been shown in the rat model of IOP elevation.44 Development of this method offers a novel in vivo model for application of genetic mouse technology to study the pathogenesis of glaucoma and will greatly facilitate the identification of treatment strategies.
Footnotes
Supported by National Eye Institute Grant EY017641 and American Health Foundation Grant G2007–058 (DFC).
Disclosure: H. Chen, None; X. Wei, None; K.-S. Cho, None; G. Chen, None; R. Sappington, None; D.J. Calkins, None; D.F. Chen, None
References
- 1. Quigley HA, Broman AT. The number of people with glaucoma worldwide in 2010 and 2020. Br J Ophthalmol. 2006;90:262–267 [DOI] [PMC free article] [PubMed] [Google Scholar]
- 2. Quigley HA, Reacher M, Katz J, Strahlman E, Gilbert D, Scott R. Quantitative grading of nerve fiber layer photographs. Ophthalmology. 1993;100:1800–1807 [DOI] [PubMed] [Google Scholar]
- 3. Foster PJ. The epidemiology of primary angle closure and associated glaucomatous optic neuropathy. Semin Ophthalmol. 2002;17:50–58 [DOI] [PubMed] [Google Scholar]
- 4. Singh K, Shrivastava A. Intraocular pressure fluctuations: how much do they matter? Curr Opin Ophthalmol. 2009;20:84–87 [DOI] [PubMed] [Google Scholar]
- 5. Varma R, Peeples P, Walt JG, Bramley TJ. Disease progression and the need for neuroprotection in glaucoma management. Am J Manag Care. 2008;14(suppl):S15–S19 [PubMed] [Google Scholar]
- 6. Lindsey JD, Weinreb RN. Elevated intraocular pressure and transgenic applications in the mouse. J Glaucoma. 2005;14:318–320 [DOI] [PubMed] [Google Scholar]
- 7. John SW. Mechanistic insights into glaucoma provided by experimental genetics the Cogan lecture. Invest Ophthalmol Vis Sci. 2005;46:2649–2661 [DOI] [PubMed] [Google Scholar]
- 8. John SW, Smith RS, Savinova OV, et al. Essential iris atrophy, pigment dispersion, and glaucoma in DBA/2J mice. Invest Ophthalmol Vis Sci. 1998;39:951–962 [PubMed] [Google Scholar]
- 9. Chang B, Smith RS, Hawes NL, et al. Interacting loci cause severe iris atrophy and glaucoma in DBA/2J mice. Nat Genet. 1999;21:405–409 [DOI] [PubMed] [Google Scholar]
- 10. Schlamp CL, Li Y, Dietz JA, Janssen KT, Nickells RW. Progressive ganglion cell loss and optic nerve degeneration in DBA/2J mice is variable and asymmetric. BMC Neurosci. 2006;7:66. [DOI] [PMC free article] [PubMed] [Google Scholar]
- 11. Pang IH, Clark AF. Rodent models for glaucoma retinopathy and optic neuropathy. J Glaucoma. 2007;16:483–505 [DOI] [PubMed] [Google Scholar]
- 12. Gelatt KN, Brooks DE, Samuelson DA. Comparative glaucomatology, II: The experimental glaucomas. J Glaucoma. 1998;7:282–294 [PubMed] [Google Scholar]
- 13. WoldeMussie E, Ruiz G, Wijono M, Wheeler LA. Neuroprotection of retinal ganglion cells by brimonidine in rats with laser-induced chronic ocular hypertension. Invest Ophthalmol Vis Sci. 2001;42:2849–2855 [PubMed] [Google Scholar]
- 14. Aihara M, Lindsey JD, Weinreb RN. Experimental mouse ocular hypertension: establishment of the model. Invest Ophthalmol Vis Sci. 2003;44:4314–4320 [DOI] [PubMed] [Google Scholar]
- 15. Morrison JC, Moore CG, Deppmeier LM, Gold BG, Meshul CK, Johnson EC. A rat model of chronic pressure-induced optic nerve damage. Exp Eye Res. 1997;64:85–96 [DOI] [PubMed] [Google Scholar]
- 16. Sappington RM, Carlson BJ, Crish SD, Calkins DJ. The microbead occlusion model: a paradigm for induced ocular hypertension in rats and mice. Invest Ophthalmol Vis Sci. 2010;51:207–216 [DOI] [PMC free article] [PubMed] [Google Scholar]
- 17. Saeki T, Aihara M, Ohashi M, Araie M. The efficacy of TonoLab in detecting physiological and pharmacological changes of mouse intraocular pressure–comparison with TonoPen and microneedle manometery. Curr Eye Res. 2008;33:247–252 [DOI] [PubMed] [Google Scholar]
- 18. Cho KS, Yang L, Lu B, et al. Re-establishing the regenerative potential of central nervous system axons in postnatal mice. J Cell Sci. 2005;118:863–872 [DOI] [PMC free article] [PubMed] [Google Scholar]
- 19. Li RS, Chen BY, Tay DK, Chan HH, Pu ML, So KF. Melanopsin-expressing retinal ganglion cells are more injury-resistant in a chronic ocular hypertension model. Invest Ophthalmol Vis Sci. 2006;47:2951–2958 [DOI] [PubMed] [Google Scholar]
- 20. Yang H, Hirooka K, Fukuda K, Shiraga F. Neuroprotective effects of angiotensin II type 1 receptor blocker in a rat model of chronic glaucoma. Invest Ophthalmol Vis Sci. 2009;50:5800–5804 [DOI] [PubMed] [Google Scholar]
- 21. Huang W, Hui Y, Zhang M. Retrograde labeling of adult rat retinal ganglion cells with the fluorogold. Yan Ke Xue Bao. 2000;16:29–33 [PubMed] [Google Scholar]
- 22. Chiu K, Lau WM, Yeung SC, Chang RC, So KF. Retrograde labeling of retinal ganglion cells by application of fluoro-gold on the surface of superior colliculus. J Vis Exp. June 17;(16). pii: 819 doi 10.3791/819 [DOI] [PMC free article] [PubMed] [Google Scholar]
- 23. Quigley HA, McKinnon SJ, Zack DJ, et al. Retrograde axonal transport of BDNF in retinal ganglion cells is blocked by acute IOP elevation in rats. Invest Ophthalmol Vis Sci. 2000;41:3460–3466 [PubMed] [Google Scholar]
- 24. Koprivica V, Cho KS, Park JB, et al. EGFR activation mediates inhibition of axon regeneration by myelin and chondroitin sulfate proteoglycans. Science. 2005;310:106–110 [DOI] [PubMed] [Google Scholar]
- 25. Fournier AE, McKerracher L. Tubulin expression and axonal transport in injured and regenerating neurons in the adult mammalian central nervous system. Biochem Cell Biol. 1995;73:659–664 [DOI] [PubMed] [Google Scholar]
- 26. Fitzgerald M, Bartlett CA, Evill L, Rodger J, Harvey AR, Dunlop SA. Secondary degeneration of the optic nerve following partial transection: the benefits of lomerizine. Exp Neurol. 2009;216:219–230 [DOI] [PubMed] [Google Scholar]
- 27. Sharma RK, Netland PA. Early born lineage of retinal neurons express class III beta-tubulin isotype. Brain Res. 2007;1176:11–17 [DOI] [PubMed] [Google Scholar]
- 28. Hu Y, Cui Q, Harvey AR. Interactive effects of C3, cyclic AMP and ciliary neurotrophic factor on adult retinal ganglion cell survival and axonal regeneration. Mol Cell Neurosci. 2007;34:88–98 [DOI] [PubMed] [Google Scholar]
- 29. Smith PD, Sun F, Park KK, et al. SOCS3 deletion promotes optic nerve regeneration in vivo. Neuron. 2009;64:617–623 [DOI] [PMC free article] [PubMed] [Google Scholar]
- 30. Mellough CB, Cui Q, Spalding KL, et al. Fate of multipotent neural precursor cells transplanted into mouse retina selectively depleted of retinal ganglion cells. Exp Neurol. 2004;186:6–19 [DOI] [PubMed] [Google Scholar]
- 31. Pimentel B, Sanz C, Varela-Nieto I, Rapp UR, De Pablo F, de La Rosa EJ. c-Raf regulates cell survival and retinal ganglion cell morphogenesis during neurogenesis. J Neurosci. 2000;20:3254–3262 [DOI] [PMC free article] [PubMed] [Google Scholar]
- 32. Cui Q, Yip HK, Zhao RCH, So K-F, Harvey AR. Intraocular elevation of cyclic AMP potentiates ciliary neurotrophic factor-induced regeneration of adult rat retinal ganglion cell axons. Mol Cell Neurosci. 2003;22:49–61 [DOI] [PubMed] [Google Scholar]
- 33. Portillo JA, Okenka G, Kern TS, Subauste CS. Identification of primary retinal cells and ex vivo detection of proinflammatory molecules using flow cytometry. Mol Vis. 2009;15:1383–1389 [PMC free article] [PubMed] [Google Scholar]
- 34. Seamone C, LeBlanc R, Rubillowicz M, Mann C, Orr A. The value of indices in the central and peripheral visual fields for the detection of glaucoma. Am J Ophthalmol. 1988;106:180–185 [DOI] [PubMed] [Google Scholar]
- 35. Stewart WC, Shields MB. The peripheral visual field in glaucoma: reevaluation in the age of automated perimetry. Surv Ophthalmol. 1991;36:59–69 [DOI] [PubMed] [Google Scholar]
- 36. Jakobs TC, Libby RT, Ben Y, et al. Retinal ganglion cell degeneration is topological but not cell type specific in DBA/2J mice. J Cell Biol. 2005;171:313–325 [DOI] [PMC free article] [PubMed] [Google Scholar]
- 37. Fitzgerald M, Payne SC, Bartlett CA, Evill L, Harvey AR, Dunlop SA. Secondary retinal ganglion cell death and the neuroprotective effects of the calcium channel blocker, lomerizine. Invest Ophthalmol Vis Sci. 2009;50:5456–5462 [DOI] [PubMed] [Google Scholar]
- 38. Danias J, Lee KC, Zamora MF, et al. Quantitative analysis of retinal ganglion cell (RGC) loss in aging DBA/2NNia glaucomatous mice: comparison with RGC loss in aging C57/BL6 mice. Invest Ophthalmol Vis Sci. 2003;44:5151–5162 [DOI] [PubMed] [Google Scholar]
- 39. Strom RC, Williams RW. Cell production and cell death in the generation of variation in neuron number. J Neurosci. 1998;18:9948–9953 [DOI] [PMC free article] [PubMed] [Google Scholar]
- 40. McKinnon SJ, Schlamp CL, Nickells RW. Mouse models of retinal ganglion cell death and glaucoma. Exp Eye Res. 2009;88:816–824 [DOI] [PMC free article] [PubMed] [Google Scholar]
- 41. Steele MR, Inman DM, Calkins DJ, Horner PJ, Vetter ML. Microarray analysis of retinal gene expression in the DBA/2J model of glaucoma. Invest Ophthalmol Vis Sci. 2006;47:977–985 [DOI] [PubMed] [Google Scholar]
- 42. Buckingham BP, Inman DM, Lambert W, et al. Progressive ganglion cell degeneration precedes neuronal loss in a mouse model of glaucoma. J Neurosci. 2008;28:2735–2744 [DOI] [PMC free article] [PubMed] [Google Scholar]
- 43. Surgucheva I, Weisman AD, Goldberg JL, Shnyra A, Surguchov A. Gamma-synuclein as a marker of retinal ganglion cells. Mol Vis. 2008;14:1540–1548 [PMC free article] [PubMed] [Google Scholar]
- 44. Laquis S, Chaudhary P, Sharma SC. The patterns of retinal ganglion cell death in hypertensive eyes. Brain Res. 1998;784:100–104 [DOI] [PubMed] [Google Scholar]


