

Abstract
Objective:
Beyond age, having a family history is the most significant risk factor for Alzheimer disease (AD). This longitudinal brain imaging study examines whether there are differential patterns of regional gray matter atrophy in cognitively healthy elderly subjects with (FH+) and without (FH−) a family history of late-onset AD.
Methods:
As part of the KU Brain Aging Project, cognitively intact individuals with a maternal history (FHm, n = 11), paternal history (FHp, n = 10), or no parental history of AD (FH−, n = 32) similar in age, gender, education, and Mini-Mental State Examination (MMSE) score received MRI at baseline and 2-year follow-up. A custom voxel-based morphometry processing stream was used to examine regional differences in atrophy between FH groups, controlling for age, gender, and APOE ϵ4 (APOE4) status. We also analyzed APOE4-related atrophy.
Results:
Cognitively normal FH+ individuals had significantly increased whole-brain gray matter atrophy and CSF expansion compared to FH−. When FH+ groups were split, only FHm was associated with longitudinal measures of brain change. Moreover, our voxel-based analysis revealed that FHm subjects had significantly greater atrophy in the precuneus and parahippocampus/hippocampus regions compared to FH− and FHp subjects, independent of APOE4 status, gender, and age. Individuals with an ε4 allele had more regional atrophy in the frontal cortex compared to ε4 noncarriers.
Conclusions:
We conclude that FHm individuals without dementia have progressive gray matter volume reductions in select AD-vulnerable brain regions, specifically the precuneus and parahippocampal gyrus. These data complement and extend reports of regional cerebral metabolic differences and increases in amyloid-β burden in FHm subjects, which may be related to a higher risk for developing AD.
Late-onset Alzheimer disease (AD) is a neurodegenerative disease caused by complex genetic and environmental mechanisms.1 Age is the most significant risk factor for developing AD, followed by a family history of AD,2 with maternal transmission significantly more frequent than paternal transmission.3 First-degree relatives of individuals with AD are at a 4- to 10-fold higher risk for AD compared to individuals with no family history.2 Since it is unknown how familial transmission of AD biologically increases susceptibility for AD, clarifying mechanisms of familial risk for AD are a step toward developing enhanced treatment and prevention strategies.
Various forms of neuroimaging have attempted to characterize genetic and familial risk factors for late-onset AD by studying heritable traits in healthy individuals with no cognitive impairment.1 There are several studies showing that individuals without dementia who are offspring of AD-affected mothers may have changes in memory performance,4 reductions in brain glucose metabolism in parieto-temporal cortices and posterior cingulate,5 and increased Aβ load primarily in the frontal cortex, posterior cingulate, and precuneus.6 At cross-section, we found that cognitively normal individuals with a maternal history (FHm) of late-onset AD had reduced gray matter volume in AD-related brain regions compared to those with a paternal (FHp) or a negative family history (FH−) of AD.7 However, no studies have yet assessed if there is progressive atrophy over several years in individuals with a family history of AD.
Recently, 3-dimensional-mapping methods8 have been developed to characterize spatial patterns of atrophy as a biomarker for studying disease progression due to their ability to predict conversion from mild cognitive impairment (MCI) to AD.9 We used an optimized voxel-based 3-dimensional longitudinal analysis method to identify brain atrophy in the absence of significant clinical progression over 2 years in individuals with risk for AD due to a first-degree family member with AD.
METHODS
Standard protocol approvals, registrations, and patient consent.
This study was approved by the University of Kansas School of Medicine Human Subjects Committee. All participants provided informed consent according to institutional guidelines.
Demographics.
Subjects without dementia aged 60 and over were enrolled in the University of Kansas Brain Aging Project. Participants were recruited from a referral-based memory clinic and by media appeals. All subjects received a standard diagnostic evaluation that included medical (history, physical, and laboratory), neuropsychological, and MRI examinations at baseline and at 24 months. The absence of cognitive and functional decline was determined by a board-certified neurologist with specialized training in the evaluation of dementia using the Clinical Dementia Rating (CDR).10 The clinical assessment included a semi-structured interview with the participant and with a collateral source knowledgeable about the participant. Persons with neurologic disease other than AD, history of ischemic heart disease, history of significant mental illness, diabetes mellitus, or other illness that might impair participation were not eligible for the study.
Subjects in this sample were 63–83 years of age at baseline, had education ≥12 years, CDR of zero, and Mini-Mental State Examination (MMSE) ≥28.11 Subjects completed thorough family history examinations with a nurse clinician.7 Briefly, a family history of dementia included at least one first-degree relative whose dementia onset was between the ages of 60 and 80 years, and was taken using a standard family history form. Participants self-reported names, dates of birth, age at death, age at onset of disease, and clinical information of affected and unaffected family members. Subjects were not included if both of their parents had not lived to the age at risk of late-onset AD (i.e., 60 years). Only subjects with a positive family history with a single parent with AD (FH+) were included in the present study. These subjects were divided into maternal (FHm) and paternal (FHp) FH groups and compared with subjects without a family history of dementia (FH−). Of 66 individuals who participated in the study at both timepoints, 13 were excluded based on a lack of complete family history data (2), both parents having a family history of AD (3), brain imaging data not qualified at baseline or follow-up (6), or conversion to early AD (1 FH− individual, plus 2 of the individuals who had both parents with a family history of AD).
A trained psychometrician administered a psychometric battery including standard measures of memory, language, executive function, and visuospatial ability at baseline and at 24 months (tests described in detail elsewhere12). Cognitive performance scores were converted to Z scores based on the mean and SD of a larger cohort of individuals without dementia.12 The mean of each participant's Z scores was determined to create an index of global cognitive performance, and the mean of each participant's Z scores on memory tests were used to create an index of global memory performance. Z scores from baseline and 24 months were used to calculate cognitive change scores for each individual.
Covariates.
We also examined several covariates that have been linked to aspects of brain health and may potentially be involved in risk for AD.13 Measured covariates included habitual level of physical activity, activities of daily living, the Geriatric Depression Scale, and laboratory assessment of lipids, inflammation, and vascular factors. Details on laboratory assessments of cholesterol, triglycerides, C-reactive protein, and hemoglobin A1c are provided elsewhere.14 The participant's level of habitual physical activity was estimated using the Physical Activity Scale in the Elderly. Activities of daily living were indexed using the Alzheimer's Disease Cooperative Study Activities of Daily Living Scale for MCI.15 APOE genotypes were determined by restriction enzyme isotyping.
Brain imaging.
Baseline and 2-year follow-up whole-brain structural MRI data were obtained using the same Siemens 3.0 Tesla Allegra MRI Scanner. High-resolution T1-weighted anatomic images were acquired (magnetization-prepared rapid gradient echo; 1 × 1 × 1 mm3 voxels, repetition time = 2,500, echo time = 4.38 msec, inversion time = 1,100 msec, field of view = 256 × 256, flip angle = 8 degrees) and each scan was checked for image artifacts and gross anatomic abnormalities.
Image analysis.
Data analysis for 53 subjects was performed using SPM8 algorithms (Wellcome Department of Cognitive Neurology, London, UK) running under MATLAB 7.2 (The MathWorks, Natick, MA) on Linux. Voxel-based morphometry (VBM) methodologies were used to compare changes over time in regional tissue volume between family history groups. In short, the baseline gray matter segmented images and Jacobian determinants (containing information about the follow-up image) were multiplied to form a gray matter volume change image (GMChange) (see appendix e-1 on the Neurology® Web site at www.neurology.org, which contains citations 16–18, for details). The normalized, modulated, and smoothed (8 mm) GMChange maps for each individual were then inputted into statistical analysis in SPM8.
Gray matter, white matter, and CSF segmentations for baseline and follow-up images were used to calculate total intracranial volume, normalized gray matter, white matter, and CSF volumes. Annualized rate of change was calculated by dividing the difference in volume between time points by the time (in years) between the 2 scans.
Image statistics.
First, the baseline and annualized rates of change for normalized whole brain volume values were compared between groups using the general linear model (GLM) univariate analysis with post hoc t tests in SPSS 17.0. Then, as part of our primary VBM analysis in SPM8, a GLM full factorial analysis with post hoc t tests was used to examine the anatomic distribution of gray matter volume changes between groups, including age, gender, and APOE4 carrier status as confounding variables. These analyses were done on the smoothed gray matter change maps to test for differential changes over time, reflecting an interaction of groups and time. First, we examined whether there were significant regional gray matter atrophy differences between FH− and FH+ (FHm and FHp combined) groups. Second, we examined whether there were parent gender effects on regional gray matter atrophy by comparing the 3 groups (FH− vs FHp vs FHm). To focus our analyses on AD-related regions, we used a masking image of regional gray matter volumes significantly decreased in subjects with early AD compared to elderly subjects without dementia from a previous study,19 which we applied to the full volume of data for each contrast.7 Results were considered significant at p < 0.05 after correction for multiple comparisons (familywise error). Since we previously identified brain regions showing gray matter volume differences across FH groups at baseline,7 we also include results at p < 0.001 uncorrected, with clusters exceeding an extent threshold of 100 voxels and Z >3.0.
As a secondary analysis, we performed a t test to analyze regional atrophy differences between the 14 subjects carrying an APOE4 allele (ϵ2/ϵ4, n = 0; ϵ4/ϵ3, n = 12; ϵ4/ϵ4, n = 2) and the 39 who did not ϵ2/ϵ3, n = 9; ϵ3/ϵ3, n = 30), controlling for age and gender. We then tested for overlap of these regional atrophy changes to our family history regional atrophy changes using a conjunction analysis. As in the family history analysis above, we focused the APOE4 analysis on AD-related regions, as listed above.
Statistical analyses.
SPSS 17.0 was used for all statistical analysis outside of imaging space. Continuous demographic, cognitive, and imaging variables were compared between the family history groups at baseline and 2-year follow-up using analysis of variance. χ2 was used to compare categorical variables between groups. For all analyses, results were considered significant at p < 0.05.
RESULTS
There were no significant differences between the FH groups in age, gender distribution, years of education, or neurocognitive measures (table 1). The prevalence of APOE4 carriers was significantly lower in FH− (15%) and FHp (20%) as compared with FHm (63%). There were no differences between groups in antihypertensive, β-blocker, or cholesterol agent use at follow-up. There were also no differences in baseline or change over 2 years between groups on the Geriatric Depression Scale, activities of daily living, or in physical activity level.
Table 1.
Subject characteristics by family history groupsa
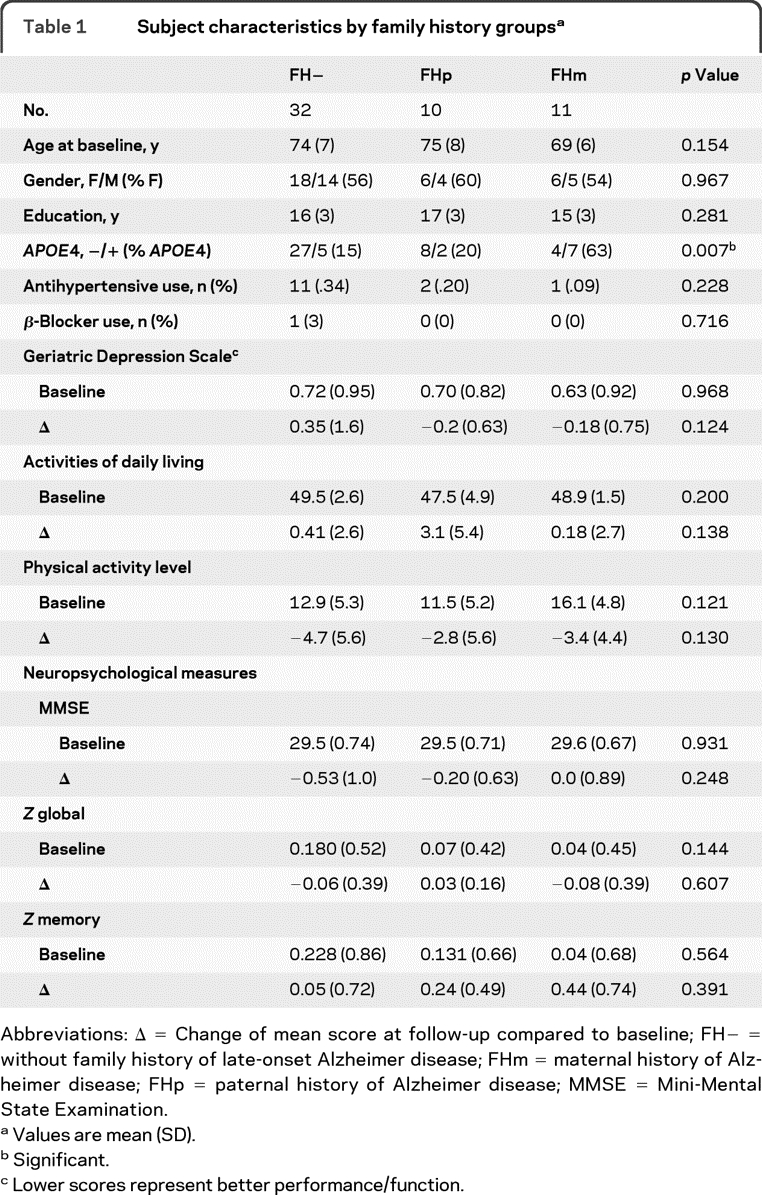
Abbreviations: Δ = Change of mean score at follow-up compared to baseline; FH− = without family history of late-onset Alzheimer disease; FHm = maternal history of Alzheimer disease; FHp = paternal history of Alzheimer disease; MMSE = Mini-Mental State Examination.
Values are mean (SD).
Significant.
Lower scores represent better performance/function.
Elderly FH− individuals had a trend for higher systolic pressure (p = 0.053) and diastolic pressure (p = 0.063) compared with FH+ individuals. There were no significant differences between circulating C-reactive protein levels between groups, or vascular factors, including levels of lipids, fasting glucose, and hemoglobin A1c (table e-1). There were no significant group differences in 2-year change on any measures (data not shown).
FH+ individuals had significantly more whole brain atrophy (gray matter + white matter) compared to FH− individuals (table e-2). Specifically, FHm individuals had significantly more gray matter atrophy and CSF expansion than the FH− and FHp groups. When we compared just the FHm and FHp groups, the FHm group also had significantly more normalized whole brain atrophy per year compared to the FHp group. We controlled for age, gender, and APOE4 in these analyses.
For our voxel-based regional analysis of atrophy, we first compared FH− and FH+ groups. There were no regions showing significantly more AD-related gray matter volume atrophy in the FH− vs FH+ group as a whole. However, at p < 0.001 uncorrected, FH+ subjects had a trend for greater AD-related atrophy in the anterior cingulate and medial frontal cortex, the hippocampus/parahippocampal gyrus, and the precuneus (see figure 1 and table e-3). Furthermore, our familywise error corrected analysis of the 3 groups (FH− vs FHp vs FHm) revealed that there were significant increases in atrophy driven by the FHm group in 2 regions: the left precuneus and the left parahippocampal gyrus. At an uncorrected level (p < 0.001, t > 3.47, cluster size > 100), FHm individuals also had greater atrophy over 2 years in the anterior cingulate, the bilateral middle temporal gyrus, the right hippocampus, right precuneus, and posterior cingulate compared to the FH− group. FHm individuals had greater atrophy in the left anterior cingulate than the FHp group. There were no regions where the FH− or FHp group had greater atrophy than the FHm group (see figures 1 and 2 and table 2).
Figure 1. Statistical parametric maps showing gray matter atrophy in cognitively healthy subjects with family history of late-onset Alzheimer disease (FH+) compared with subjects without family history of late-onset Alzheimer disease (FH−).

Areas of regional 2-year atrophy are represented on a red (FH− < FH+) and blue (FH− < FHm) color-coded scale, reflecting Z scores between 2 and 4. Overlapping regions are shown in pink. Results are displayed on the axial and sagittal views of a standard, spatially normalized MRI. Anatomic location and description of brain regions for A and B are in tables 2 and e-3.
Figure 2. Increased regional atrophy in maternal history of Alzheimer disease (FHm) group compared to subjects without family history of late-onset Alzheimer disease (FH−) and paternal history of Alzheimer disease (FHp) groups.

(A) Longitudinal voxel-based results thresholded at Z >3.0, overlaid on 3-dimensional surface demonstrating precuneus and parahippocampal atrophy. (B) Mean gray matter volume loss was extracted from the clusters showing maximal statistical difference at p < 0.05 familywise error corrected for precuneus cluster (B.a) and parahippocampal cluster (B.b), organized by family history group. Line represents mean volume change within the cluster for the whole group.
Table 2.
Brain regions showing gray matter volume atrophy in FHm subjects compared with FHp and FH−a

Abbreviations: FH− = without family history of late-onset Alzheimer disease; FHm = maternal history of Alzheimer disease; FHp = paternal history of Alzheimer disease.
Analyses controlled for age, gender, and APOE4. Regions are listed rostral to caudal. Coordinates from Talairach and Tournoux.
Regions significant at p < 0.05 familywise error corrected, k >100; all others were p < 0.001 uncorrected, k >100.
Our secondary analysis tested whether the progressive regional atrophy changes in the maternal family history group were driven by APOE4 genotype. We found that individuals with an ε4 allele had progressive atrophy primarily in the frontal cortices, specifically in the left inferior frontal cortex and the left superior frontal cortex (figure 3, table e-4), and that these regional atrophy changes did not statistically overlap with the FHm regional atrophy changes in the precuneus and parahippocampal gyrus.
Figure 3. Atrophy in APOE4 carriers compared to noncarriers, and individuals with family history of late-onset Alzheimer disease (FH+) compared to without family history of late-onset Alzheimer disease (FH−).

Blue regions indicate areas of increased atrophy in APOE4 carriers compared to noncarriers in the prefrontal, frontal, and parietal cortex. Pink regions indicate areas of increased atrophy in the medial temporal, temporal, parietal, and some frontal cortex in individuals with a family history of AD, as detailed in tables 2 and e-4. First column of images (A) are the left lateral (A.a) and medial pial surface (A.b), middle column of images (B) were the caudal (B.a) and rostral (B.b) view, right column of images (C) were the right lateral (C.a) and medial (C.b) surface. Results at p < 0.001 uncorrected, clusters >100.
DISCUSSION
These results extend our cross-sectional analyses by identifying regional degeneration over 2 years in individuals with a maternal family history of AD in several regions known to be affected in early AD, namely the precuneus and parahippocampal gyrus.7 This regionally specific atrophy appears to precede any evidence of cognitive decline, and remained significant after accounting for potential risk factors for late-onset AD such as age, gender, and APOE4 genotype. These findings complement reports that FHm individuals have a unique imaging endophenotype of AD, which may be important for identifying individuals in a prodromal state of AD.5,6,20,21
Longitudinally, all FH groups showed changes in brain volume between baseline and follow-up, typical of the yearly rate of 0.5%–1% among healthy elderly individuals.22 We report significant, progressive atrophy in the precuneus/parietal cortex and parahippocampal cortex of FHm individuals compared to both FHp and FH− groups. The paternal group did not have increased regional atrophy compared to the FHm group, which supports data showing a stronger imaging endophenotype of AD in FHm subjects.5,20 Our data are consistent with volumetric studies characterizing regions vulnerable to progressive atrophy in the earliest stages of AD.23,24 For instance, individuals with MCI who convert to AD have significantly less hippocampal gray matter density and volume, amygdalar volume, and temporal and parietal lobe cortical thickness compared to individuals with MCI who do not convert to AD, with changes in medial temporal lobe atrophy best predicting disease progression over time.25,26 Moreover, a recent study of family history in the ADNI sample found a significant effect of positive maternal history of dementia on hippocampal atrophy in individuals with MCI and AD, independent of age and APOE4.27 While we did not identify any differences in hippocampal atrophy between FH groups, our parahippocampal atrophy finding in the FHm group is in close proximity. Our results complement several studies showing progressive temporal and parietal hypometabolism in FHm individuals over time.5 Mosconi et al.6 recently reported that FHm subjects without dementia had higher 11C-Pittsburgh compound B PET retention in the anterior and posterior cingulate cortex, precuneus, parietal, temporal, occipital, and frontal cortices compared to the other 2 family history groups. Our primary findings of progressive atrophy in the precuneus and medial temporal cortex overlap with regions of fibrillar Aβ burden identified by Mosconi et al., although in our volumetric analysis we did not find significant differences between family history groups in the frontal or occipital cortices. Regional Aβ load may overlap with atrophy in regions of highest amyloid load, namely the posterior cingulate and precuneus, in individuals at risk for developing AD based on family history. Our FHm subjects showed a similar regional pattern of atrophy to individuals with high amyloid load,28 suggesting that precuneus atrophy in particular may reflect underlying pathologic processes associated with increased predisposition for AD.
The precuneus has widespread connections, a variety of functions (reviewed by Cavanna and Trimble29), and a high metabolism during the brain's resting state, and plays a pivotal role in the default mode network.30 Individuals with early AD have been shown to have abnormal default mode network activation, with significantly less deactivation in the precuneus, possibly associated with decreased metabolism.31 Impairment of the posterior cingulate and precuneus may be a key marker to distinguish early forms of AD from healthy aging,32 and an early manifestation of Aβ deposition may affect resting state connectivity changes seen by fMRI.33 While hippocampal volume and atrophy have been a primary biomarker thus far for imaging studies of AD risk, convergent evidence in FH+ individuals may indicate change in the precuneus as an early endophenotype for AD risk.
In the current study, we investigated the relationship of APOE4 to brain atrophy because there was a higher APOE ϵ4 frequency in our FHm group, similar to another report.34 The ϵ4 allele has been associated with AD-like reductions in brain volume (reviewed in reference 1). To account for these possible effects, we both controlled for APOE4, and analyzed APOE4 groups separately, which demonstrated that APOE4 did not fully explain the progressive regional atrophy we observed in the FHm group. However, due to unequal sample sizes and an underpowered sample when split, we were unable to properly test whether FHm APOE4 carriers show more severe atrophy compared to the other groups. Future studies with larger, even sample sizes will be necessary to replicate our data, and to specifically examine interactions between APOE and FH.
Our primary finding of progressive atrophy in cognitively normal FHm individuals contributes to growing data pointing toward a possible maternal transmission of risk for AD. While a number of AD endophenotypes are heritable, including metabolic deficits,5 Aβ load,6 reduced blood oxygen level-dependent signal on fMRI,21 and brain atrophy, the genetic basis for the transmission of these phenotypes is unknown.35 One potential genetic basis is mitochondrial DNA (mtDNA), given both its maternal transmission and evidence supporting a role for mtDNA abnormalities in AD. Mitochondrial dysfunction may be responsible for alterations in glucose metabolism in AD brain tissue,36 consistent with data showing selective metabolic impairment in children of mothers with AD.20 Previous studies of mitochondrial function in AD have also shown altered oxidative metabolism in the AD brain prior to AD pathology.37 Moreover, neuronal nuclear genes influencing mitochondrial energy metabolism are underexpressed in early AD,39 particularly in the regions like the precuneus.38 Thus, the early impact of mitochondrial protein changes on neuronal death may be one possible mechanism for specific regional atrophy in individuals with a maternal transmission.
Our study is limited by a lack of neuropathologic confirmation of parental AD, and it is possible that parents who developed dementia may not have had AD but another dementia. If the relatives of our subjects did not have AD, it would have likely reduced our ability to detect group differences. FH questionnaires such as ours, however, have been shown to agree with neuropathologic findings.40 The small sample size may have limited our power to resolve group differences in longitudinal atrophy in this otherwise healthy sample, in particular in the FHp group. However, our 3-dimensional mapping methods provide increased ability to resolve brain differences among smaller groups and have been shown to have high statistical power.9 Despite these limitations, the regional specificity of our longitudinal findings in AD-vulnerable regions in individuals without dementia complement and extend reports of cerebral metabolic differences and increased Aβ load in parietal and temporal cortices in subjects with a maternal family history.
Supplementary Material
ACKNOWLEDGMENT
The University of Kansas General Clinical Research Center (M01RR023940) provided essential space, expertise, and nursing support. The authors thank the research participants of the KU Brain Aging Project.
Supplemental data at www.neurology.org
- AD
- Alzheimer disease
- CDR
- Clinical Dementia Rating
- FH+
- with family history of late-onset Alzheimer disease
- FH−
- without family history of late-onset Alzheimer disease
- FHm
- maternal history of Alzheimer disease
- FHp
- paternal history of Alzheimer disease
- GLM
- general linear model
- GMChange
- gray matter volume change image
- MCI
- mild cognitive impairment
- MMSE
- Mini-Mental State Examination
- mtDNA
- mitochondrial DNA
- VBM
- voxel-based morphometry
AUTHOR CONTRIBUTIONS
Statistical analysis was conducted by Dr. Robyn Honea and Dr. Eric Vidoni.
DISCLOSURE
Dr. Honea reports no disclosures. Dr. Swerdlow has served on speakers' bureaus for Pfizer Inc. and Accera, Inc.; has received speaker honoraria from Medivation, Inc. and Accera, Inc.; and has received research support from Medivation, Inc., the NIH, and the Parkinson Foundation of the Heartland. Dr. Vidoni receives research support from the Foundation for Physical Therapy. Dr. Burns has served on a scientific advisory board for the American Academy of Physician Education; has received publishing royalties for Early Diagnosis and Treatment of Mild Cognitive Impairment (Wiley Press, 2008) and Dementia: An Atlas of Investigation and Diagnosis (Clinical Publishing, Oxford, England, 2007); serves on speakers' bureaus for Pfizer Inc. and Novartis; has served as a consultant for Medacorp Consulting, Johnson County Clinical Trials, and PRA International; receives research support from Elan Corporation, Janssen, Wyeth, Pfizer Inc., Danone, and the Dana Foundation; and has served as an expert witness in legal proceedings regarding competency.
REFERENCES
- 1. Reiman EM. Linking brain imaging and genomics in the study of Alzheimer's disease and aging. Ann NY Acad Sci 2007;1097:94–113 [DOI] [PubMed] [Google Scholar]
- 2. Cupples LA, Farrer LA, Sadovnick AD, et al. Estimating risk curves for first-degree relatives of patients with Alzheimer's disease: the REVEAL study. Genet Med 2004;6:192–196 [DOI] [PubMed] [Google Scholar]
- 3. Gomez-Tortosa E, Barquero MS, Baron M, et al. Variability of age at onset in siblings with familial Alzheimer disease. Arch Neurol 2007;64:1743–1748 [DOI] [PubMed] [Google Scholar]
- 4. Xu G, McLaren DG, Ries ML, et al. The influence of parental history of Alzheimer's disease and apolipoprotein E epsilon4 on the BOLD signal during recognition memory. Brain 2009;132:383–391 [DOI] [PMC free article] [PubMed] [Google Scholar]
- 5. Mosconi L, Mistur R, Switalski R, et al. Declining brain glucose metabolism in normal individuals with a maternal history of Alzheimer disease. Neurology 2009;72:513–520 [DOI] [PMC free article] [PubMed] [Google Scholar]
- 6. Mosconi L, Rinne JO, Tsui WH, et al. Increased fibrillar amyloid-β burden in normal individuals with a family history of late-onset Alzheimer's. Proc Natl Acad Sci USA 2010;107:5949–5954 [DOI] [PMC free article] [PubMed] [Google Scholar]
- 7. Honea RA, Swerdlow RH, Vidoni ED, et al. Reduced gray matter volume in normal adults with a maternal family history of Alzheimer disease. Neurology 2010;74:113–120 [DOI] [PMC free article] [PubMed] [Google Scholar]
- 8. Leow AD, Klunder AD, Jack CR, Jr, et al. Longitudinal stability of MRI for mapping brain change using tensor-based morphometry. Neuroimage 2006;31:627–640 [DOI] [PMC free article] [PubMed] [Google Scholar]
- 9. Hua X, Lee S, Yanovsky I, et al. Optimizing power to track brain degeneration in Alzheimer's disease and mild cognitive impairment with tensor-based morphometry: an ADNI study of 515 subjects. Neuroimage 2009;48:668–681 [DOI] [PMC free article] [PubMed] [Google Scholar]
- 10. Morris JC. The Clinical Dementia Rating (CDR): current version and scoring rules. Neurology 1993;43:2412b–2414 [DOI] [PubMed] [Google Scholar]
- 11. Folstein MF, Folstein SE, McHugh PR. Mini-mental state: a practical method for grading the cognitive state of patients for the clinician. J Psychiatr Res 1975;12:189–198 [DOI] [PubMed] [Google Scholar]
- 12. Burns JM, Donnelly JE, Anderson HS, et al. Peripheral insulin and brain structure in early Alzheimer disease. Neurology 2007;69:1094–1104 [DOI] [PubMed] [Google Scholar]
- 13. van Exel E, Eikelenboom P, Comijs H, et al. Vascular factors and markers of inflammation in offspring with a parental history of late-onset Alzheimer disease. Arch Gen Psychiatry 2009;66:1263–1270 [DOI] [PubMed] [Google Scholar]
- 14. Burns JM, Donnelly JE, Anderson HS, et al. Peripheral insulin and brain structure in early Alzheimer disease. Neurology 2007;69:1094–1104 [DOI] [PubMed] [Google Scholar]
- 15. Galasko D, Bennett D, Sano M, et al. An inventory to assess activities of daily living for clinical trials in Alzheimer's disease: The Alzheimer's Disease Cooperative Study. Alzheimer Dis Assoc Disord 1997;2(suppl):S33–S39 [PubMed] [Google Scholar]
- 16. Ashburner J, Andersson JL, Friston KJ. Image registration using a symmetric prior: in three dimensions. Hum Brain Mapp 2000;9:212–225 [DOI] [PMC free article] [PubMed] [Google Scholar]
- 17. Ashburner J, Friston KJ. Unified segmentation. Neuroimage 2005;26:839–851 [DOI] [PubMed] [Google Scholar]
- 18. Ashburner J. A fast diffeomorphic image registration algorithm. Neuroimage 2007;38:95–113 [DOI] [PubMed] [Google Scholar]
- 19. Honea RA, Thomas GP, Harsha A, et al. Cardiorespiratory fitness and preserved medial temporal lobe volume in Alzheimer disease. Alzheimer Dis Assoc Disord 2009;23:188–197 [DOI] [PMC free article] [PubMed] [Google Scholar]
- 20. Mosconi L, Brys M, Switalski R, et al. Maternal family history of Alzheimer's disease predisposes to reduced brain glucose metabolism. Proc Natl Acad Sci USA 2007;104:19067–19072 [DOI] [PMC free article] [PubMed] [Google Scholar]
- 21. Johnson SC, Schmitz TW, Trivedi MA, et al. The influence of Alzheimer disease family history and apolipoprotein E epsilon4 on mesial temporal lobe activation. J Neurosci 2006;26:6069–6076 [DOI] [PMC free article] [PubMed] [Google Scholar]
- 22. Fjell AM, Walhovd KB, Fennema-Notestine C, et al. One-year brain atrophy evident in healthy aging. J Neurosci 2009;29:15223–15231 [DOI] [PMC free article] [PubMed] [Google Scholar]
- 23. Mosconi L, Sorbi S, de Leon MJ, et al. Hypometabolism exceeds atrophy in presymptomatic early-onset familial Alzheimer's disease. J Nucl Med 2006;47:1778–1786 [PubMed] [Google Scholar]
- 24. Karas G, Scheltens P, Rombouts S, et al. Precuneus atrophy in early-onset Alzheimer's disease: a morphometric structural MRI study. Neuroradiol 2007;49:967–976 [DOI] [PubMed] [Google Scholar]
- 25. Risacher SL, Saykin AJ, West JD, et al. Baseline MRI predictors of conversion from MCI to probable AD in the ADNI cohort. Curr Alzheimer Res 2009;6:347–361 [DOI] [PMC free article] [PubMed] [Google Scholar]
- 26. Risacher SL, Shen L, West JD, et al. Longitudinal MRI atrophy biomarkers: relationship to conversion in the ADNI cohort. Neurobiol Aging 2010;31:1401–1418 [DOI] [PMC free article] [PubMed] [Google Scholar]
- 27. Andrawis JP, Hwang KS, Green AE, et al. Effects of ApoE4 and maternal history of dementia on hippocampal atrophy. Neurobiol Aging Epub 2010 Sept 15. [DOI] [PMC free article] [PubMed] [Google Scholar]
- 28. Chetelat G, Villemagne VL, Bourgeat P, et al. Relationship between atrophy and beta-amyloid deposition in Alzheimer disease. Ann Neurol 2010;67:317–324 [DOI] [PubMed] [Google Scholar]
- 29. Cavanna AE, Trimble MR. The precuneus: a review of its functional anatomy and behavioural correlates. Brain 2006;129:564–583 [DOI] [PubMed] [Google Scholar]
- 30. Fransson P, Marrelec G. The precuneus/posterior cingulate cortex plays a pivotal role in the default mode network: Evidence from a partial correlation network analysis. Neuroimage 2008;42:1178–1184 [DOI] [PubMed] [Google Scholar]
- 31. Rombouts SA, Barkhof F, Goekoop R, et al. Altered resting state networks in mild cognitive impairment and mild Alzheimer's disease: an fMRI study. Hum Brain Mapp 2005;26:231–239 [DOI] [PMC free article] [PubMed] [Google Scholar]
- 32. Bai F, Zhang Z, Yu H, et al. Default-mode network activity distinguishes amnestic type mild cognitive impairment from healthy aging: a combined structural and resting-state functional MRI study. Neurosci Lett 2008;438:111–115 [DOI] [PubMed] [Google Scholar]
- 33. Sheline YI, Raichle ME, Snyder AZ, et al. Amyloid plaques disrupt resting state default mode network connectivity in cognitively normal elderly. Biol Psychiatry 2010;67:584–587 [DOI] [PMC free article] [PubMed] [Google Scholar]
- 34. Duara R, Barker WW, Lopez-Alberola R, et al. Alzheimer's disease: interaction of apolipoprotein E genotype, family history of dementia, gender, education, ethnicity, and age of onset. Neurology 1996;46:1575–1579 [DOI] [PubMed] [Google Scholar]
- 35. Mosconi L, Berti V, Swerdlow RH, et al. Maternal transmission of Alzheimer's disease: prodromal metabolic phenotype and the search for genes. Hum Genomics 2010;4:170–193 [DOI] [PMC free article] [PubMed] [Google Scholar]
- 36. Lin MT, Beal MF. Mitochondrial dysfunction and oxidative stress in neurodegenerative diseases. Nature 2006;443:787–795 [DOI] [PubMed] [Google Scholar]
- 37. Swerdlow RH, Khan SM. The Alzheimer's disease mitochondrial cascade hypothesis: an update. Exp Neurol 2009;218:308–315 [DOI] [PMC free article] [PubMed] [Google Scholar]
- 38. Liang WS, Reiman EM, Valla J, et al. Alzheimer's disease is associated with reduced expression of energy metabolism genes in posterior cingulate neurons. Proc Natl Acad Sci USA 2008;105:4441–4446 [DOI] [PMC free article] [PubMed] [Google Scholar]
- 39. Lynn BC, Wang J, Markesbery WR, Lovell MA. Quantitative changes in the mitochondrial proteome from subjects with mild cognitive impairment, early stage, and late stage Alzheimer's disease. J Alzheimers Dis 2010;19:325–339 [DOI] [PMC free article] [PubMed] [Google Scholar]
- 40. Kawas C, Segal J, Stewart WF, et al. A validation study of the Dementia Questionnaire. Arch Neurol 1994;51:901–906 [DOI] [PubMed] [Google Scholar]
Associated Data
This section collects any data citations, data availability statements, or supplementary materials included in this article.