

Abstract
The target-induced clustering of magnetic nanoparticles is typically used for the identification of clinically relevant targets and events. A decrease in the water proton transverse NMR relaxation time, or T2, is observed upon clustering, allowing the sensitive and accurate detection of target molecules. We have discovered a new mechanistically unique nanoparticle-target interaction resulting in T2 increase, and demonstrate herein that this increase, and its associated r2 relaxivity decrease, is also observed upon the interaction of the nanoparticles with ligands or molecular entities. Small molecules, proteins, and a 15-bp nucleic acid sequence were chemically conjugated to polyacrylic-acid-coated iron oxide nanoparticles, and all decreased the original nanoparticle r2 value. Further experiments established that the r2 decrease was inversely proportional to the number of ligands bound to the nanoparticle and the molecular weight of the bound ligand. Additional experiments revealed that the T2-increasing mechanism was kinetically faster than the conventional clustering mechanism. Most importantly, under conditions that result in T2 increases, as little as 5.3 fmol of Bacillus anthracis plasmid DNA (pX01 and pX02), 8 pmol of the cholera toxin B subunit (Ctb), and even a few cancer cells in blood were detected. Transition from the binding to the clustering mechanism was observed in the carbohydrate-, Ctb- and DNA-sensing systems, simply by increasing the target concentration significantly above the nanoparticle concentration, or using Ctb in its pentameric form as opposed to its monomer. Collectively, these results demonstrate that the molecular architectures resulting from the interaction between magnetic nanosensors and their targets directly govern water proton NMR signal relaxation. We attribute the observed T2 increases to the bound target molecules partially obstructing the diffusion of solvent water molecules through the iron oxide nanoparticles’ outer relaxation spheres of the superparamagnetic nanoparticles. Finally, we anticipate that this novel interaction can be incorporated into new clinical and field detection applications, due to its faster kinetics relative to the conventional nanoparticle-clustering assays.
Introduction
Considerable efforts in the design and synthesis of targeted nanoparticle conjugates have resulted in the generation of a wide variety of highly sensitive and selective nanoparticle-based diagnostics.1–3 Among the advantages of using nanomaterials for diagnostic purposes are (1) the small size of the nanoparticle (1–100 nm) results in large surface-to-volume ratios, and (2) the unique, and sometimes enhanced, physical and chemical properties that some materials exhibit in the nano-regime.1, 2, 4–6 Another important characteristic of these nanomaterials is their exceptional size-dependent properties, such as the distinct light-scattering pattern of gold nanoparticles and the discrete luminescent behavior that semi-conductor quantum dots exhibit due to their size and shape.7–9 Furthermore, the clustering and self-assembly of some of these nanoparticles induces physical changes that depend on the nature and concentration of the agents inducing the nanoassembly.9, 10 For example, it is well-established that the clustering of gold nanoparticles in solution results in a cooperative interaction of the surface plasmons of the individual nanoparticles resulting in prominent changes in the solution’s surface plasmon peak.9, 10 When gold nanoparticles in solution were conjugated with non-complementary oligonucleotides, it was observed that the color of the solution changed from red to blue in the presence of target sequences, pointing towards the use of this technique in DNA diagnostics.11, 12 Since then, this principle has been adopted in multiple reports for the design of highly sensitive diagnostics techniques.13–20
In addition, it has been observed that when superparamagnetic iron oxide nanoparticles self-assemble in solution, the nanoparticles become more efficient at decreasing the lifetime of the proton nuclear magnetic resonance (NMR) signal of the surrounding water molecules.21–23 This process, referred to as transverse or spin-spin relaxation, results in significant changes in the transverse or spin-spin relaxation time of bulk water protons (T2) that can be measured by a simple relaxometer, NMR or magnetic resonance imaging (MRI) instrument. This principle has allowed the design of magnetic nanoparticle conjugates (denoted as magnetic relaxation nanoswitches, MRnS) that self-assemble in solution when a specific molecular target is present, report its presence and concentration by changing the solution T2 value. Typically, when the iron oxide nanoparticles assemble due to the presence of a particular target, a concomitant T2 decrease is observed.21, 24–27 In contrast, when the presence of a target or a particular enzymatic activity triggers the disassembly of a pre-existing nanoassembly, a T2 increase is observed.22, 23, 28 This capability allowed the design of reversible systems that can sense the presence of a target via the assembly of individual nanoparticles or the disassembly of pre-existing nanoparticle complexes.
For a target-induced assembly of magnetic nanoparticles to occur, it is plausible that the target must first bind the nanoparticles, and then via multivalent interactions, target-nanoparticle assemblies can subsequently form. Interestingly, the effect of this initial target-binding event on the T2 value has not been reported. Hence, we hypothesized that an initial, fast binding of a target to a nanoparticle may prevent water molecules from reaching the proximity of the iron oxide nanoparticle, potentially resulting in an increase (not a decrease as observed with clustering) in T2 values for sufficiently large targets (Scheme 1). For example, this may occur during monovalent target–nanoparticle interactions, where binding of a target to the MRnS does not cause nanoparticle target-induced aggregation. As the concentration of a monovalent target or the number of attached ligands on the MRnS increases, T2 values could be expected to increase as well. Alternatively, in the presence of a multivalent target, clustering may take place, decreasing the T2 value as previously reported (Scheme 1).
Scheme 1.

The MRnS–target interaction directs the shift in the T2. T2 values increase upon target binding to the nanoparticles, but decrease upon target-nanoparticle clustering.
The absence of a comprehensive study delineating how the MRnS-target interaction (binding vs clustering) modulates T2 values prompted us to develop MRnS that distinctively associate via binding with clinically relevant biological targets. We selected a plethora of probes, including small molecules, proteins and nucleic acids, as well as a diverse array of targets, ranging from carbohydrates and DNA to toxins and cancer cells. In initial studies, we discovered that the chemical conjugation of a ligand to the MRnS generated a new nanosensor with noticeably diminished spin-spin relaxivity (designated r2 and defined as M−1T2−1, where M is the nanoparticle molarity), indicating that its ability to efficiently reduce the lifetime of the water proton NMR signal has been partially compromised. Upon binding of a ligand to MRnS, a decrease in the r2 value was observed for the aqueous suspension of nanoparticles. In addition, as the number of ligands conjugated on the nanoparticle surface or the molecular weight of the conjugated ligand increased, the r2 values also decreased. For these cases, because r2 is inversely proportional to T2, the T2 values of the MRnS aqueous suspensions increased upon ligand binding. Furthermore, we discovered that the non-covalent conjugation of biomolecules to MRnS followed a similar pattern, since the T2 values for a suspension of Protein G-conjugated MRnS increased when the number of antibodies bound to the Protein G on the nanoparticle increased. Mechanistically, we found that MRnS binding precedes nanoparticle clustering, leading to faster detection kinetics without compromising sensitivity. Hence through MRnS binding, we were able to quantify as little as 5.3 fmol of DNA and 8 pmol of the cholera toxin B subunit (Ctb). Most importantly, we approached single cancer cell detection in 200 µL blood through MRnS-cell binding, indicating that this diagnostic method is sensitive and clinically relevant. Overall, we demonstrate herein that (1) conjugation of a ligand or binding of a target to MRnS can cause T2 increases, (2) MRnS binding is a kinetically faster process than clustering and most likely precedes target-MRnS aggregation, and (3) association of MRnS with their corresponding target, without clustering, achieves sensitivity that is comparable to that obtained during MRnS-target aggregation. In addition to small molecules, antibodies, toxins, nucleic acids and mammalian cells that were detected in the present report, it is anticipated that the observed MRnS behavior should be universal during the detection of other cells and pathogenic entities. We have accounted our observed T2 increase by proposing an extension of the outer sphere relaxation theory used to describe the T2 decrease from the conventional MRnS-target clustering mechanism.30
Experimental Section
Materials
All chemicals used were analytical reagent grade. Iron salts (FeCl2.4H2O and FeCl3.6H2O) were purchased from Fluka. Polyacrylic acid (MW 1.8 kDa), ammonium hydroxide, hydrochloric acid, folic acid, N, N’-dimethylformamide (DMF), N-hydroxysuccinimide (NHS), Ctb, avidin and Con A were purchased from Sigma-Aldrich. Doxorubicin and dextran (10 kDa) were obtained from Enzo Life Sciences and Pharmacosmos, respectively. Protein G and 1-Ethyl-3-[3-dimethylaminopropyl] carbodiimide hydrochloride (EDC) were purchased from Pierce Biotechnology, whereas rabbit anti-Ctb polyclonal antibody was purchased from Abcam. The 15-bp oligonucleotide was synthesized at the University of Maryland’s Biopolymer and Genomics Core Facility (Baltimore, MD).
Synthesis of iron oxide nanoparticles
Both polyacrylic acid- and dextran-coated, iron oxide nanoparticles were synthesized using the alkaline precipitation method, as recently reported.31, 32 Briefly, a Fe+3/Fe+2 solution was rapidly mixed with an ammonium hydroxide solution for 30 s, prior to addition of the polymer solution. After synthesis, the resulting nanoparticles were washed, concentrated and reconstituted in phosphate buffered saline (PBS, pH 7.4), using a KrosFlo Research II TFF system equipped with a 10 kDa column (Carilion-Spectrum) to remove any unreacted reagents. To incorporate propargyl groups to the nanoparticles, carbodiimide chemistry was used followed by magnetic separation, as previously reported.32, 33
Synthesis of small-molecule-carrying MRnS using “click” chemistry
To synthesize folate- and doxorubicin-conjugated nanoparticles, propargylated nanoparticles (13 mg, 1.69 mg/mL) were added to either azide-terminated folic acid or azide-terminated doxorubicin. In order to obtain MRnS with different numbers of folic acid ligands on their surface, we varied the stoichiometry of the ligand-to-nanoparticle concentration. For the preparation of nanoparticles conjugated with 1 folate group, 0.4 µg of folic acid (0.8 × 10⁻² µmol) in DMSO were used, whereas for the MRnS with 45 and 120 folic acid moieties, 1.5 mg (3 × 10⁻² mmol) and 4 mg (8 × 10⁻² mmol) were utilized, respectively. Likewise, we used 0.05 mg (0.08 µmol) and 0.5 mg (0.8 µmol) doxorubicin for the preparation of the doxorubicin-carrying MRnS. All reactions were initiated at room temperature in the presence of catalytic amounts of CuI (0.01 µg, 5 × 10⁻⁸ mmol), in 125 µL of bicarbonate buffer (pH 8.5), and further incubated for 12 h at room temperature (“click” chemistry). The final reaction mixtures were purified via magnetic separation, and finally dialyzed using a 6,000 – 8,000 MW cutoff dialysis bag against deionized (DI) water and PBS.
Synthesis of protein-carrying nanoparticles
For the conjugation of proteins to nanoparticles, we utilized EDC/NHS chemistry. Specifically, polyacrylic acid-coated nanoparticles ([Fe] = 0.25 mg/mL) were mixed with 2 mL MES buffer (pH 6), followed by the dropwise addition of EDC (1 mg, 0.11 mmol) and NHS (0.8 mg, 0.15 mmol). This reaction mixture was incubated for 3 m before the drop-wise addition of the protein of interest (1.5 mg) in DI water (0.5 mL). The reaction continued for 30 m at room temperature under continuous mixing before overnight incubation at 4 °C. In order to isolate the protein-carrying MRnS, we magnetically separated the reaction mixture through a 1X-PBS-equilibrated LS25 column. Conjugation of antibodies to Protein G-carrying nanoparticles (250 µL) was performed as previously reported by varying the antibody's concentration, using either 5 µg or 0.5 ng anti-Ctb,33, 34 resulting in nanoparticles with different valencies. Nanoparticle valency was evaluated as previously reported.33
Synthesis of oligonucleotide-carrying MRnS
Conjugation of an azide-terminated 15-bp oligonucleotide (5’-ATGTGGTTGCTGTGT-3’) to propargylated polyacrylic acid-coated, iron oxide nanoparticles was achieved via “click” chemistry, as previously described.35 Briefly, 400 µL propargylated nanoparticles were resuspended in 1,100 µL NaHCO3 buffer (0.1 M, pH 8.4). To this, we added 200 µL of 10 mM tris(2-carboxyethyl)phosphane hydrochloride (Sigma-Aldrich) as a reducing agent. Either 2.5 or 20 µL of 6.3 M oligonucleotide solution was diluted in 80 µL NaHCO3 buffer (0.1 M, pH 8.4) and added to the nanoparticle solution. Reaction was initiated with the dropwise addition of 150 µL of the Cu(II) complex with tris(benzyltriazolylmethyl) amine (Sigma-Aldrich) at 10 mM, which was previously prepared in DI water and t-butanol (9:1, v:v). The reaction was incubated at room temperature under continuous mixing for 3 h, and followed by overnight incubation at 4 °C under constant mixing. The resulting MRnS were dialyzed against DI water using a 6,000–8,000 MW cut-off membrane (Spectrum), followed by magnetic separation with an LS25 MACS column (Miltenyi). Determination of MRnS oligonucleotide concentration was achieved by monitoring the absorbance at 260 and 305 nm (background), using a Nanodrop 1000 spectrophotometer (Thermo Scientific).
Characterization of the MRnS-target state
MRnS particle diameter was determined by DLS using a PDDLS CoolBatch 40T instrument and Precision Deconvolve 32 software. For r2 measurements, a 0.47 Tesla mq20 NMR analyzer (Minispec, Bruker) was used, while the iron concentration was determined spectrophotometrically after acid digestion of the nanoparticles as previously reported.24, 36, 37 All T2 measurements were performed using a CPMG pulse-echo train with a 1.5 ms interpulse spacing (Bruker Corp., Billerica, MA). In order to determine the state of MRnS-target interactions (assembled or clustered), DLS was utilized, since this technique can provide information about the nanoparticles’ dispersion state in solution, as opposed to other methods, like transmission electron microscopy, that require depositing the samples on a solid support followed by drying. DLS and T2 measurements were conducted in triplicate after 30 m incubation at room temperature under continuous mixing. All measurements were performed in triplicates, unless otherwise stated. For studies with dextran-coated MRnS, an iron concentration of 0.02 µg/µL was used.
Determination of the MRnS – DNA interaction
DNA-sensing MRnS were suspended in 0.1 M phosphate buffer (pH 7.4) containing 6 µg/mL iron. To 200 µL of this suspension, 1 µL of target DNA (5’-ACACAGCAACCACAT-3’, University of Maryland Biopolymer and Genomics Core Facility) in phosphate buffer was added. The target sequence also contained several copies of the complementary sequence. Quantification of the target DNA stocks was achieved spectrophotometrically using a Nanodrop 1000 spectrophotometer. For the experiments with the B. anthracis DNA, the isolated 182 kbp pX01 and 94 kbp pX02 plasmids were used (US Army Edgewood Chemical Biological Center, Aberdeen Proving Ground, MD), as well as biotinylated probes complementary to their unique sequences.
Determination of the MRnS – Ctb interaction
Lyophilized pentameric Ctb was reconstituted in DI water according to the supplier’s protocol. Serial dilutions of Ctb were also prepared in DI water and stored at 4 °C. In order to obtain Ctb in its monomeric form, aliquots of the protein stocks were subjected to 100 °C for 1 h, leading to dissociation of the pentamer’s subunits by disruption of non-covalent links.38 Ctb aliquots of 5 µL were incubated with 195 µL of the Ctb MRnS working solutions ([Fe] = 1 µg/mL) at room temperature under continuous mixing at 350 rpm for 30 m, followed by DLS and T2 measurements.
Magnetic-relaxation-mediated detection of cancer cells
Folate-receptor-positive, lung cancer cells A549 from the ATCC were grown according to the supplier’s procedures. After harvesting, the cells were quantified through the hemocytometer method, followed by preparation of stock cellular suspensions in 1X PBS, 5% PBS-diluted blood. For magnetic relaxation studies, 10 µL aliquots of cell suspensions were incubated with 190 µL of folate-carrying nanoparticle working solutions ([Fe] = 10 µg/mL) at room temperature. T2 values were measured after 15 min of incubation at room temperature with 400 rpm shaking.
Results
Our initial investigations examined whether chemical conjugation of ligands to MRnS affects the nanoparticle’s overall size and relaxivity. Unconjugated MRnS had a diameter of 75 nm with an r2 of 287 mM−1s−1 (Table 1). Conjugation of folate or doxorubicin (both small molecules) resulted in r2 decreases and only minimal changes in particle diameter (Table 1). To elucidate whether this is observed for other molecular targets used in diagnostics, we conjugated an oligonucleotide and several proteins to the nanoparticles. The r2 values of each MRnS preparation decreased, while the nanoparticle diameter did not change (Table 1). Hence, the observed r2 decreases were not attributed to changes in the particle diameter due to de-clustering of pre-existing MRnS clusters (SI Figure 1). It should be noted that conjugation of a large protein (Avidin or Con A) had a more pronounced effect on r2 than conjugation of folate or doxorubicin.
Table 1.
Conjugation of targeting ligands to MRnS results in r2 decreases, while the overall particle size remains largely unchanged (mean ± SE).
| r2 (mM−1s−1) | Diameter (nm) | |
|---|---|---|
| Unconjugated MRnS | 287 ± 3 | 75 ± 2 |
| Folate MRnS | 256 ± 4 | 77 ± 3 |
| Doxorubicin MRnS | 240 ± 8 | 79 ± 4 |
| Oligonucleotide MRnS | 61 ± 2 | 77 ± 2 |
| Concanavalin A MRnS | 48 ± 5 | 78 ± 3 |
| Avidin MRnS | 48 ± 1 | 76 ± 3 |
We next investigated whether the number of ligands decorating the nanoparticle surface affects r2 relaxivity. We utilized three different model systems, ranging from small molecules to a macromolecule. First, valency-grafted, folate-carrying MRnS demonstrated a ligand concentration-dependent decrease in r2 (Table 2 and Figure 1). Specifically, the higher the nanoparticle valency – the number of ligands bound per nanoparticle – the lower the r2 value. Likewise, this was observed in valency-engineered MRnS with doxorubicin moieties attached to their surfaces (Table 2). Interestingly, when a 15-bp oligonucleotide was attached to the nanoparticle, a drastic reduction in r2 was observed (Table 2). This may be attributed to differences in ligand characteristics, such as their overall size and molecular weight.
Table 2.
Changing the MRnS ligand valency affects r2 (mean ± SE).
| Ligand per MRnS | r2 (Mm−1s−1) | |
|---|---|---|
| Unconjugated MRnS | - | 287 ± 3 |
| Folate MRnS | 1 | 256 ± 4 |
| Folate MRnS | 45 | 210 ± 2 |
| Folate MRnS | 120 | 183 ± 2 |
| Doxorubicin MRnS | 18 | 240 ± 8 |
| Doxorubicin MRnS | 225 | 116 ± 1 |
| Oligonucleotide MRnS | 46 | 61 ± 2 |
| Oligonucleotide MRnS | 368 | 54 ± 2 |
Figure 1.

The MRnS ligand valency - the average number of ligands on the nanoparticle surface - controls the water proton relaxation rate (1/T2). SE values are too small to be displayed.
Considering that chemical conjugation of a ligand to MRnS promoted decreases in the r2 relaxivity and spin-spin water proton relaxation rate (1/T2), we investigated whether non-covalent associations between the nanoparticles and a molecule could have similar effects. Specifically, as T2 is measured during magnetic relaxation studies, we recorded this parameter and anticipated increases in its values, because T2 is inversely proportional to both the water proton relaxation rate (1/T2) and r2 relaxivity. We used dextran-coated MRnS and Con A, a protein that has high affinity towards carbohydrates, including dextran’s monomeric glucose building block.13, 29 At low protein concentrations, T2 values increased, with minor changes in the nanoparticle size distribution due to protein binding (Table 3 and SI Figure 2). However, at higher Con A levels, T2 values decreased, apparently because of the formation of extensive MRnS assemblies (Table 3 and SI Figure 2). Considering these data, we examined whether there were any kinetic differences between the two interaction mechanisms. We monitored T2 over time during the binding or clustering of MRnS and Con A (Figure 2), and found that binding occurred much faster than clustering. For binding in particular, T2 values quickly reached a plateau ~7 min after addition of low levels of Con A (Figure 2A). Alternatively, the Con A-induced clustering of MRnS progressed slowly, finally reaching its endpoint after ~30 min (Figure 2B). These results indicate that recognition of a molecular target by MRnS via binding is a faster process than the target-induced clustering of MRnS.
Table 3.
Distinct associations between dextran-coated MRnS and Con A define the relaxation response. At low Con A concentrations, the protein binds to the MRnS, inducing T2 increases. At higher Con A concentrations, clustering is observed with a pronounced T2 decreases (mean ± SE).
| Con A - Dextran MRnS interaction | |||
|---|---|---|---|
 |
 |
 |
|
| ConA (pmol) | 0 | 0.1 | 14 |
| T2 (ms) | 208 ± 1.0 | 220 ± 1.5 | 141 ± 2.1 |
| Diameter (nm) | 92 ± 3 (100%) | 100 ± 2 (100%) | 364 ± 15 (100%) |
Figure 2.

MRnS-Con A interactions can follow very different kinetics. (A) At low Con A levels (0.1 pmol), interaction results in rapid, positive T2 changes. (B) MRnS clustering observed at higher Con A levels (2 pmol) facilitates gradual T2 decreases.
Apart from proteins, nucleic acids are an important class of biomarkers. Thus, nucleic-acid-sensing MRnS have been previously reported for the detection of DNA, mRNA and telomerase activity.21, 39, 40 Although in those reports the T2 changes were attributed to nanoparticle clustering, we examined whether the levels of the nucleic acid target may differentially affect T2. Interestingly, we found that T2 values increased at low DNA levels, whereas at higher target concentrations, nanoparticle aggregation caused T2 decreases (Table 4). Furthermore, we investigated whether this trend is valid during the detection of more extensive nucleic acid targets, such as pathogenic plasmids found in the B. anthracis bacteria causing anthrax.41, 42 With the B. anthracis pX01 and pX02 plasmids, the MRnS behaved similarly as with the oligonucleotide (above), where the T2 values increased significantly at 2.1 fmol of plasmid but decreased at 210 fmol of plasmid.
Table 4.
The MRnS-DNA interaction state facilitates distinct shifts in T2. At low target concentrations the T2 increases, but it decreases at higher concentrations due to extensive assembly formation (mean ± SE).
| DNA oligonucleotide - MRnS interaction | |||
|---|---|---|---|
 |
 |
 |
|
| DNA (fmol) | 0 | 5.3 | 260 |
| T2 (ms) | 65.7 ± 0.5 | 84.6 ± 1.7 | 62.2 ± 0.3 |
| Diameter (nm) | 77 ± 2 (100%) | 81 ± 5 (100%) | 84 ± 3 (78%) |
| - | - | 292 ± 18 (22%) | |
After discovering that binding of a ligand or a target moiety to MRnS induced T2 increases, we investigated whether the non-covalent bonding of antibodies to MRnS can have similar effects. It was expected that as different antibodies bind to MRnS, a concomitant increase in T2 would be observed, regardless of the nature of chemical bonding. In order to examine this hypothesis, we utilized Protein G-carrying MRnS and IgG antibodies (rabbit anti-Ctb polyclonal IgG). It is well established that Protein G non-covalently associates with the Fc region of immunoglobulins, facilitating the conjugation of the antibody to nanoparticles and various substrates. Our results indicated that attachment of antibodies to the MRnS increased T2 values (Figure 3A). Specifically, quantification of the number of antibodies bound per nanoparticle revealed that T2 values increased with the number of antibodies bound. Additionally, DLS studies indicated a complete absence of MRnS aggregation. However, considering the IgG’s dimensions (14.2 nm × 8.5 nm × 3.8 nm),43–46 the corresponding changes in nanoparticle size can be attributed to antibody-MRnS binding (Figure 3B). These findings further corroborated the hypothesis that binding between a molecular entity and MRnS results in a new nanoparticle with lower r2 relaxivity.
Figure 3.

Conjugation of anti-Ctb antibodies to MRnS results in increases in (A) T2 values and (B) nanoparticle size, as monitored by DLS (mean ± SE).
Subsequently, we utilized an anti-Ctb MRnS to examine its interaction with its Ctb target. Since Ctb plays a critical role in cholera intoxication by facilitating the toxin’s entry into intestinal microvilli, detecting this toxin subunit can prevent cholera intoxications.47, 48 During infection, Ctb exists in its native form as a 60 kDa homopentamer. However, during transcription of the cholera toxin genes or upon heat treatment of the homopentamer, Ctb can be found as a stable monomer, which preserves the tertiary structure of the homopentamer’s subunits.38 Therefore, we anticipated that the anti-Ctb MRnS could sense Ctb in its pentameric or monomeric form, as the polyclonal antibody recognizes shared epitopes found on both Ctb forms. Furthermore, we hypothesized that discrete diagnostic profiles and changes in T2 values would be observed during detection of the Ctb pentamer and monomer. We rationalized that the Ctb monomer, a monovalent target, can only result in MRnS binding, whereas the Ctb pentamer may be able to facilitate MRnS clustering. Indeed, addition of Ctb induced distinct transformations in T2 values and nanoparticle diameter. Specifically, monomeric Ctb (16 pmol) associated with MRnS, facilitating both an increase in the T2 and a small change in the nanoparticle size (Table 5). On the other hand, addition of identical concentrations of pentameric Ctb led to a decrease in T2, with the simultaneous emergence of a significant population of MRnS clusters as monitored with DLS.
Table 5.
Interactions between MRnS and Ctb depend upon protein quaternary structure. The Ctb monomer binds the nanoparticle surface, while its pentamer promotes MRnS aggregation (mean ± SE).
| Cholera toxin - MRnS interaction | |||
|---|---|---|---|
| Control (H2O) | Monomer | Pentamer | |
 |
 |
 |
|
| Ctb (pmol) | 0 | 16 | 16 |
| T2 (ms) | 123 ± 1.0 | 130 ± 1.2 | 112 ± 1.0 |
| Diameter (nm) | 92 ± 3 (100%) | 99 ± 4 (100%) | 96 ± 7 (87%) |
| - | - | 1525 ± 42 (13%) | |
We also studied whether the two MRnS-target interaction mechanisms yield different analyte detection kinetics by using the Ctb-sensing MRnS for the quantification of the Ctb monomer and pentamer. Our results indicate that binding of the monomer to MRnS resulted in a linear dose-dependent increase in T2, with a detection threshold of 8 pmol having a corresponding T2 that significantly differed from the experimental control (0 pmol) (Figure 4A). On the other hand, clustering of the Ctb pentamer with MRnS decreased T2, with a minimum detection limit of 16 pmol (Figure 4B). Overall, these data suggest that the MRnS T2 switching mode is universal and governed by the MRnS-target interaction mechanism.
Figure 4.

Quantification of (A) the Ctb monomer through MRnS – target binding and (B) detection of the Ctb pentamer via the MRnS–target clustering mechanism (mean ± SE).
Finally, we used small molecule-carrying MRnS for the detection of cancer cells in blood. We reasoned that the binding of folate-conjugated MRnS to folate-receptor-positive cells would induce rapid T2 increases while achieving high sensitivity. After cell counting with a hemocytomer, serial dilutions of cultured cells were prepared in 5% whole blood containing PBS. Indeed, within 15 min, the MRnS interacted with the folate receptor-expressing lung cancer cells A54949 in a linear, dose-dependent fashion (Figure 5), leading to significant T2 changes with respect to the control cell population. Most notably, the binding of MRnS to cancer cells approached single–cell detection in 200 µL of this complex matrix (10 µL blood sample in 190 µL MRnS working solution), highlighting the potential use of the MRnS binding in clinical and field-based diagnostics. Specifically in the absence of cells, the solution T2 value was 100 ms, but in the presence of an A549 cell, T2 values increased to ~ 103 ms. Considering that the instrument-provided relaxation curve fitting error was below 0.2 ms, these data are important, because binding of the MRnS to a single cell can induce measurable T2 changes, achieving sensitive detection of cancer cells in biological samples. As expected, T2 values further increased with the number of cells in suspension increasing.
Figure 5.

The detection of lung cancer cells (A549) with folate-carrying MRnS extends down to a single cell (mean ± SE).
Discussion
Over the last two decades, nanoparticles have been shown to display some unique, and sometimes remarkable, properties in solution.1,2,4–6 MRnS particles are no exception, particularly in cases of inducing measureable changes in NMR (and MRI) signals. It has been demonstrated that MRnS become significantly more efficient at decreasing the lifetime of the proton NMR signal for surrounding water molecules upon target-induced nanoparticle clustering, resulting in measureable decreases in T2 values.23 Additionally, subsequent studies revealed that when the presence of a target or particular enzymatic activity triggers the disassembly of a pre-existing supramolecular assembly, an increase in T2 is observed.21 We have demonstrated that under certain stoichiometric conditions, MRnS particles can also increase T2 values upon target binding, and that the previously reported decrease in T2 values induced upon MRnS-target clustering is also stoichiometrically controlled. Finally, we have also shown that the conjugation of a molecule of sufficient size to the MRnS can result in a sensor with slightly lower r2 relaxivity towards water protons relative to the unconjugated MRnS. Also, this decrease in r2 relaxivity is inversely proportional to the number of molecules populating the MRnS surface. We have developed a general hypothesis to account for all these observations based on the theory used to describe the relaxation of water protons when interacting with superparamagnetic nanoparticles.
The MRnS detection of target molecules is based solely on the water proton NMR signal and the accurate measurement of its lifetime. Detection is possible because NMR relaxation is considerably accelerated when the spins of these protons couple with the larger magnetic moments of the electrons within the MRnS superparamagnetic core. Thus, MRnS-target interactions can profoundly affect this coupling. The earliest investigations of paramagnetic-induced, proton relaxation concentrated on paramagnetic cations in aqueous solutions. Today there are two models, the inner sphere model and the outer sphere model, used to describe the relaxation mechanisms involving paramagnetic cations and molecular entities containing paramagnetic and superparamagnetic centers. Inner sphere theory accounts for the exchange of water molecules between the first coordination sphere of the cations and the bulk solvent. On the other hand, the outer sphere theory describes the relaxation induced by the diffusion of water molecules through the magnetic field gradients immediately surrounding the hydrated paramagnetic cation. Although both mechanisms can occur simultaneously, one usually dominates over the other to account for the observed relaxation. Inner sphere contributions usually dominate proton relaxation in solutions of paramagnetic cations.50 However, for aqueous solutions of superparamagnetic nanoparticles, the T2 decrease observed upon MRnS-target clustering is well described by the outer sphere theory.30 The iron oxide cores of the nanoparticles become magnetized when placed within an external magnetic field, such as that of an NMR or MRI instrument. The combined electron spins in the core appear to produce a single, large magnetic dipole that creates a local field gradient, and therefore, an inhomogeneity in the external magnetic field. The protons of water molecules diffusing through this inhomogeneity precess at a different frequency, dephasing their spins and leading to a decrease in the water proton T2 value. The outer sphere theory dictates that this T2 decrease is directly proportional to the nanoparticle cross-sectional area.51 It has been proposed that when individual MRnS cluster upon target binding and the effective cross-sectional area of the cluster becomes larger, they become more efficient at dephasing the spins of surrounding water protons, leading to an enhancement of the rate of transverse relaxation (1/T2) and a decrease in the associated T2 value.30, 52 Interestingly, the spin-lattice relaxation time (T1) of water protons appears to be largely unaffected by nanoparticle clustering.23
The outer sphere model can be readily extended to account for the apparent effects of MRnS molar concentration, [MRnS], that of the molecules used to provide target-binding moieties to the MRnS, [Bind], and that of the target molecule, [Target], observed on the measured T2 values. It is the stoichiometry between the MRnS and target molecules (the [MRnS]:[Target] ratio), and that between the MRnS and target-binding moieties used to populate the MRnS surface (the [MRnS]:[Bind] ratio), that appear to directly control the dominant molecular architecture of the MRnS-target constructs, which in turn directly affect the T2 values. For example, interaction between Con A and MRnS under low Con A concentrations generated molecular complexes with a slightly larger average diameter in comparison to the original MRnS, as well as a T2 increase. On the other hand, the 140-fold increase in the Con A concentration generated complexes with an average diameter of roughly four times that of the original MRnS, and resulted in a T2 decrease (Table 3). In this case, the [MRnS]:[Target] ratio controlled the resulting construct architectures and the associated T2 change. Similar results were observed for the binding of B. anthracis pX01 and pX02 plasmid fragments to MRnS carrying complimentary DNA sequences (Table 4), which can also be attributed to the change in the [MRnS]:[Target] ratio. However, in the non-covalent conjugation of anti-Ctb antibodies to Protein G-carrying MRnS (Figure 3), the average diameter of the resulting MRnS-antibody complexes, as well as the associated changes in T2 values, increased directly with antibody concentration. This is a case where the [MRnS]:[Bind] ratios directly controlled the dominant architecture of the molecular constructs and the resulting T2 changes. Our proposed construct architectures are schematically shown in Scheme 2, along with their interactions with water molecules to illustrate the mechanisms responsible for changes in T2 values relative to no target conditions ([Target]=0). The solution stoichiometries leading to the different molecular architectures are summarized in Table 6.
Scheme 2.

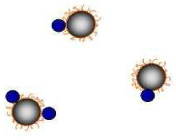
MRnS-target complex architectures determine T2 values relative to no target conditions. Black circles with orange corona depict MRnS, whereas pale blue circles represent the outer spheres associated with the MRnS nanoparticle's superparamagnetic core. Green ovals illustrate target molecules, and blue arrows symbolize the Brownian diffusion of water molecules.
Table 6.
Summary of the solution conditions giving rise to the different MRnS-target architectures. ([MRnS] MRnS molar concentration, [Bind] the concentration of the molecules used to provide target-binding moieties to MRnS, and [Target] the target molar concentration)
| Dominant MRns-target architecture | Solution Conditions | |
|---|---|---|
| MRnS1:Target1 |  |
[MRnS]>>[Bind] |
| [MRnS]>>[Target] | ||
| [Bind]<<[MRnS]>>[Target] | ||
| MRnS1:Target1+n |  |
[Bind]>>[MRnS]<[Target] |
| MRnSi:Targetj, j>i>>1 |  |
[Bind]>>[MRnS]<<[Target] |
For MRnS in the absence of both target ([Target]=0) and target binding moieties ([Bind]=0), water molecules are free to diffuse through the outer spheres of the MRnS paramagnetic cores (the magnetic field gradients immediately surrounding the superparamagnetic cores), resulting in accelerated water proton relaxation and an observed baseline T2 value lower than that of bulk water. Increasing [Bind] only ([Bind]>0), as in the experiments summarized in Table 1, yields complexes of MRnS bound to target-binding moieties. The bound moieties physically obstruct the access of water molecules to the MRnS outer spheres, causing a small decrease in r2, and therefore, an increase in T2 to a value closer to that of bulk water. Moreover, as shown by Table 2 and Figure 1, increasing the number of binding moieties on the MRnS surface leads to further r2 decreases, an additive effect of more than one binding moiety on MRnS surfaces physically obstructing access of water molecules to the MRnS outer spheres. However, when [Target]>0 and [Bind]>0, MRnS particles and target molecules interact to form molecular constructs. The dominant construct architecture will consist of a single MRnS particle with a single target molecule (MRnS1:Target1, see Scheme 2) under the following conditions: (1) [MRnS] is substantially larger than [Target] ([MRnS] >>[Target]), (2) [MRnS] is substantially larger than [Bind] ([MRnS]>>[Bind]), or (3) when both conditions exist simultaneously ([Bind]<<[MRnS]>>[Target]). To a small degree, the bound target molecule obstructs the access of water molecules to the outer spheres of the MRnS particles, causing a small increase in T2 relative to the [Target]=0 conditions. Increasing [Target] under the [MRnS]>>[Bind] or the [Bind]<<[MRnS]>>[Target] conditions will not promote the formation of a different dominant construct architecture, because relative to [MRnS], [Bind] is much too small to form MRnS particles with multiple binding moieties. On the other hand, increasing [Target] under the [MRnS]>>[Target] condition ([Bind]>>[MRnS]<[Target]) can lead to a dominant construct architecture consisting of a single MRnS particle and at least two target molecules (MRnS1:Target1+n in Scheme 2). In comparison to the MRnS1-Target1 architectures, the greater number of target molecules comprising these architectures can severely obstruct the access of water molecules through the outer spheres of the MRnS particles, resulting in a sizeable T2 increase. The MRnS1:Target1+n constructs are expected to be the construct architectures responsible for the largest T2 values.
Finally, a very different situation exists for samples where [MRnS] is much smaller than both [Bind] and [Target] ([Bind]>>[MRnS]<<[Target]). The excess of target and binding moiety molecules relative to the MRnS allows the formation of very extensive supramolecular assemblies comprising large numbers of MRnS particles, and even larger numbers of target molecules (MRnSi:Targetj, j>i>>1). These assemblies are the conventional nanoparticle agglomerates, or clusters, that are known to decrease T2 values. It may be possible for water molecules to slowly diffuse through this supramolecular assemblies, effectively removing them from the solution for a significant amount of time and placed in an environment characterized by a high density of MRnS outer spheres. We have illustrated this possibility in Scheme 2 by including water molecules inside the supramolecular assembly. For target-induced clustering of MRnS to occur, at least two different types of target molecules must be recognized by a single MRnS, or a single target molecule must contain more than one binding site for the MRnS particle. The former case is exemplified in Figure 4 by the simultaneous MRnS binding of two different plasmid fragment targets, while the latter is demonstrated by the different interactions between MRnS particles and Ctb proteins summarized in Table 5. The product from the binding of MRnS and Ctb monomers is a new particle only slightly larger than the original MRnS particle, while the interaction between MRnS and Ctb pentamers generates a new molecular assembly <4 times larger than the original nanoparticle.
Conclusions
We have demonstrated conclusively that, in addition to the interaction mechanism of molecular clustering resulting in supermolecular assemblies and T2 decreases, MRnS can interact with their target molecules to form constructs which increase T2 values as well. This newly discovered interaction mechanism exhibits substantially faster kinetics in comparison to clustering, leading to faster T2 changes and target detection. Furthermore, we have demonstrated that the incorporation of ligands or target-binding moieties onto MRnS generates a new nanoparticle with lower r2 values, and therefore, increased T2 values, relative to that of the original nanoparticle. We attribute the T2 increases, in both cases, as the consequence of the added ligands, binding moieties or target molecules partially obstructing the diffusion of solvent water molecules through the outer relaxation sphere of the superparamagnetic MRnS. Consistent with this explanation, we have shown that the r2 decrease from incorporating ligands or target-binding moieties is inversely proportional to the molecular weight of the ligand or moiety used, and the number of ligands or moieties decorating the nanoparticle surface as well. As the new nanoparticle-target binding mechanism and its concomitant T2 increases for both protein and DNA targets provide faster detection kinetics, the adoption of this mechanism into new clinical and field detection applications should be anticipated, leading to the emergence of more sensitive nanoparticle-based diagnostic assays.
Supplementary Material
Acknowledgments
This study was supported by the NIH grant GM084331 awarded to J.M.P.
Footnotes
Supporting Information Available: Dynamic light scattering analyses of unconjugated MRnS, folate MRnS, oligonucleotide-carrying MRnS, and dextran-coated MRnS in the absence and presence of Concanavalin A. This material is available free of charge via the Internet at http://pubs.acs.org.
References
- 1.Kaittanis C, Santra S, Perez JM. Adv Drug Deliv Rev. 2010;62(4–5):408–423. doi: 10.1016/j.addr.2009.11.013. [DOI] [PMC free article] [PubMed] [Google Scholar]
- 2.Rosi NL, Mirkin CA. Chem Rev. 2005;105(4):1547–1562. doi: 10.1021/cr030067f. [DOI] [PubMed] [Google Scholar]
- 3.Jain KK. Clin Chim Acta. 2005;358(1–2):37–54. doi: 10.1016/j.cccn.2005.03.014. [DOI] [PubMed] [Google Scholar]
- 4.Lu AH, Salabas EL, Schuth F. Angew Chem Int Ed Engl. 2007;46(8):1222–1244. doi: 10.1002/anie.200602866. [DOI] [PubMed] [Google Scholar]
- 5.El-Sayed MA. Acc Chem Res. 2001;34(4):257–264. doi: 10.1021/ar960016n. [DOI] [PubMed] [Google Scholar]
- 6.Langer R, Tirrell DA. Nature. 2004;428(6982):487–492. doi: 10.1038/nature02388. [DOI] [PubMed] [Google Scholar]
- 7.Link S, El-Sayed MA. Journal of Physical Chemistry B. 1999;103(21):4212–4217. [Google Scholar]
- 8.Medintz IL, Uyeda HT, Goldman ER, Mattoussi H. Nat Mater. 2005;4(6):435–446. doi: 10.1038/nmat1390. [DOI] [PubMed] [Google Scholar]
- 9.Sun Y, Xia Y. Science. 2002;298(5601):2176–2179. doi: 10.1126/science.1077229. [DOI] [PubMed] [Google Scholar]
- 10.Su KH, Wei QH, Zhang X, Mock JJ, Smith DR, Schultz S. Nano Letters. 2003;3(8):1087–1090. [Google Scholar]
- 11.Mirkin CA, Letsinger RL, Mucic RC, Storhoff JJ. Nature. 1996;382(6592):607–609. doi: 10.1038/382607a0. [DOI] [PubMed] [Google Scholar]
- 12.Elghanian R, Storhoff JJ, Mucic RC, Letsinger RL, Mirkin CA. Science. 1997;277(5329):1078–1081. doi: 10.1126/science.277.5329.1078. [DOI] [PubMed] [Google Scholar]
- 13.Aslan K, Lakowicz JR, Geddes CD. Anal Biochem. 2004;330(1):145–155. doi: 10.1016/j.ab.2004.03.032. [DOI] [PMC free article] [PubMed] [Google Scholar]
- 14.Guarise C, Pasquato L, De Filippis V, Scrimin P. Proceedings of the National Academy of Sciences of the United States of America. 2006;103(11):3978–3982. doi: 10.1073/pnas.0509372103. [DOI] [PMC free article] [PubMed] [Google Scholar]
- 15.Li H, Rothberg L. Proc Natl Acad Sci U S A. 2004;101(39):14036–14039. doi: 10.1073/pnas.0406115101. [DOI] [PMC free article] [PubMed] [Google Scholar]
- 16.Sonnichsen C, Reinhard BM, Liphardt J, Alivisatos AP. Nat Biotechnol. 2005;23(6):741–745. doi: 10.1038/nbt1100. [DOI] [PubMed] [Google Scholar]
- 17.Storhoff JJ, Elghanian R, Mucic RC, Mirkin CA, Letsinger RL. Journal of the American Chemical Society. 1998;120(9):1959–1964. [Google Scholar]
- 18.Storhoff JJ, Lucas AD, Garimella V, Bao YP, Muller UR. Nat Biotechnol. 2004;22(7):883–887. doi: 10.1038/nbt977. [DOI] [PMC free article] [PubMed] [Google Scholar]
- 19.Taton TA, Mirkin CA, Letsinger RL. Science. 2000;289(5485):1757–1760. doi: 10.1126/science.289.5485.1757. [DOI] [PubMed] [Google Scholar]
- 20.Nath S, Kaittanis C, Tinkham A, Perez JM. Anal Chem. 2008;80(4):1033–1038. doi: 10.1021/ac701969u. [DOI] [PubMed] [Google Scholar]
- 21.Perez JM, Josephson L, O'Loughlin T, Hogemann D, Weissleder R. Nat Biotechnol. 2002;20(8):816–820. doi: 10.1038/nbt720. [DOI] [PubMed] [Google Scholar]
- 22.Zhao M, Josephson L, Tang Y, Weissleder R. Angewandte Chemie International Edition. 2003;42(12):1375–1378. doi: 10.1002/anie.200390352. [DOI] [PubMed] [Google Scholar]
- 23.Josephson L, Perez JM, Weissleder R. Angewandte Chemie International Edition. 2001;40(17):3204–3206. doi: 10.1002/1521-3773(20010903)40:17<3204::AID-ANIE3204>3.0.CO;2-H. [DOI] [PubMed] [Google Scholar]
- 24.Perez JM, Simeone FJ, Saeki Y, Josephson L, Weissleder R. J Am Chem Soc. 2003;125(34):10192–10193. doi: 10.1021/ja036409g. [DOI] [PubMed] [Google Scholar]
- 25.von Maltzahn G, Harris TJ, Park JH, Min DH, Schmidt AJ, Sailor MJ, Bhatia SN. J Am Chem Soc. 2007;129(19):6064–6065. doi: 10.1021/ja070461l. [DOI] [PMC free article] [PubMed] [Google Scholar]
- 26.Harris TJ, von Maltzahn G, Derfus AM, Ruoslahti E, Bhatia SN. Angew Chem Int Ed Engl. 2006;45(19):3161–3165. doi: 10.1002/anie.200600259. [DOI] [PubMed] [Google Scholar]
- 27.Kaittanis C, Nath S, Perez JM. PLoS One. 2008;3(9):e3253. doi: 10.1371/journal.pone.0003253. [DOI] [PMC free article] [PubMed] [Google Scholar]
- 28.Tsourkas A, Hofstetter O, Hofstetter H, Weissleder R, Josephson L. Angew Chem Int Ed Engl. 2004;43(18):2395–2399. doi: 10.1002/anie.200352998. [DOI] [PubMed] [Google Scholar]
- 29.Yoshizumi A, Kanayama N, Maehara Y, Ide M, Kitano H. Langmuir. 1999;15(2):482–488. [Google Scholar]
- 30.Roch A, Moiny F, Muller RN, Gillis P. NATO Science Series II. 2002;vol. 76 [Google Scholar]
- 31.Nath S, Kaittanis C, Ramachandran V, Dalal NS, Perez JM. Chemistry of Materials. 2009;21(8):1761–1767. doi: 10.1021/cm8031863. [DOI] [PMC free article] [PubMed] [Google Scholar]
- 32.Santra S, Kaittanis C, Grimm J, Perez JM. Small. 2009 doi: 10.1002/smll.200900389. [DOI] [PMC free article] [PubMed] [Google Scholar]
- 33.Kaittanis C, Santra S, Perez JM. J Am Chem Soc. 2009;131(35):12780–12791. doi: 10.1021/ja9041077. [DOI] [PMC free article] [PubMed] [Google Scholar]
- 34.Kaittanis C, Naser SA, Perez JM. Nano Lett. 2007;7(2):380–383. doi: 10.1021/nl062553z. [DOI] [PubMed] [Google Scholar]
- 35.Seela F, Sirivolu VR. Nucleosides Nucleotides Nucleic Acids. 2007;26(6–7):597–601. doi: 10.1080/15257770701490308. [DOI] [PubMed] [Google Scholar]
- 36.Koch AM, Reynolds F, Kircher MF, Merkle HP, Weissleder R, Josephson L. Bioconjug Chem. 2003;14(6):1115–1121. doi: 10.1021/bc034123v. [DOI] [PubMed] [Google Scholar]
- 37.Shen T, Weissleder R, Papisov M, Bogdanov A, Jr, Brady TJ. Magn Reson Med. 1993;29(5):599–604. doi: 10.1002/mrm.1910290504. [DOI] [PubMed] [Google Scholar]
- 38.Daniell H, Lee SB, Panchal T, Wiebe PO. J Mol Biol. 2001;311(5):1001–1009. doi: 10.1006/jmbi.2001.4921. [DOI] [PMC free article] [PubMed] [Google Scholar]
- 39.Perez JM, Grimm J, Josephson L, Weissleder R. Neoplasia. 2008;10(10):1066–1072. doi: 10.1593/neo.08350. [DOI] [PMC free article] [PubMed] [Google Scholar]
- 40.Grimm J, Perez JM, Josephson L, Weissleder R. Cancer Res. 2004;64(2):639–643. doi: 10.1158/0008-5472.can-03-2798. [DOI] [PubMed] [Google Scholar]
- 41.Ezzell JW, Welkos SL. J Appl Microbiol. 1999;87(2):250. doi: 10.1046/j.1365-2672.1999.00881.x. [DOI] [PubMed] [Google Scholar]
- 42.Bell CA, Uhl JR, Hadfield TL, David JC, Meyer RF, Smith TF, Cockerill FR., 3rd J Clin Microbiol. 2002;40(8):2897–2902. doi: 10.1128/JCM.40.8.2897-2902.2002. [DOI] [PMC free article] [PubMed] [Google Scholar]
- 43.Foley JO, Nelson KE, Mashadi-Hossein A, Finlayson BA, Yager P. Anal Chem. 2007;79(10):3549–3553. doi: 10.1021/ac062350v. [DOI] [PMC free article] [PubMed] [Google Scholar]
- 44.Sarma VR, Silverton EW, Davies DR, Terry WD. J Biol Chem. 1971;246(11):3753–3759. [PubMed] [Google Scholar]
- 45.Liu X, Dai Q, Austin L, Coutts J, Knowles G, Zou J, Chen H, Huo Q. J Am Chem Soc. 2008;130(9):2780–2782. doi: 10.1021/ja711298b. [DOI] [PubMed] [Google Scholar]
- 46.Jans H, Liu X, Austin L, Maes G, Huo Q. Anal Chem. 2009;81(22):9425–9432. doi: 10.1021/ac901822w. [DOI] [PubMed] [Google Scholar]
- 47.Sack DA, Sack RB, Nair GB, Siddique AK. Lancet. 2004;363(9404):223–233. doi: 10.1016/s0140-6736(03)15328-7. [DOI] [PubMed] [Google Scholar]
- 48.Minke WE, Roach C, Hol WG, Verlinde CL. Biochemistry. 1999;38(18):5684–5692. doi: 10.1021/bi982649a. [DOI] [PubMed] [Google Scholar]
- 49.Parker N, Turk MJ, Westrick E, Lewis JD, Low PS, Leamon CP. Anal Biochem. 2005;338(2):284–293. doi: 10.1016/j.ab.2004.12.026. [DOI] [PubMed] [Google Scholar]
- 50.Swift TJ, Connick RF. The Journal of Chemical Physics. 1962;37(2):307–320. [Google Scholar]
- 51.Gillis P, Moiny F, Brooks RA. Magn. Reson. Med. 2002;47:257–263. doi: 10.1002/mrm.10059. [DOI] [PubMed] [Google Scholar]
- 52.Perez JM, Josephson L, Weissleder R. Chem. Biochem. 2004;5:261–264. doi: 10.1002/cbic.200300730. [DOI] [PubMed] [Google Scholar]
Associated Data
This section collects any data citations, data availability statements, or supplementary materials included in this article.