Abstract
The viscoelastic behavior of connective tissue is generally attributed to the material properties of the extracellular matrix rather than cellular activity. We have previously shown that fibroblasts within areolar connective tissue exhibit dynamic cytoskeletal remodeling within minutes in response to tissue stretch ex vivo and in vivo. Here, we tested the hypothesis that fibroblasts, through this cytoskeletal remodeling, actively contribute to the viscoelastic behavior of the whole tissue. We measured significantly increased tissue tension when cellular function was broadly inhibited by sodium azide and when cytoskeletal dynamics were compromised by disrupting microtubules (with colchicine) or actomyosin contractility (via Rho kinase inhibition). These treatments led to a decrease in cell body cross-sectional area and cell field perimeter (obtained by joining the end of all of a fibroblast’s processes). Suppressing lamellipodia formation by inhibiting Rac-1 decreased cell body cross-sectional area but did not affect cell field perimeter or tissue tension. Thus, by changing shape, fibroblasts can dynamically modulate the viscoelastic behavior of areolar connective tissue through Rho-dependent cytoskeletal mechanisms. These results have broad implications for our understanding of the dynamic interplay of forces between fibroblasts and their surrounding matrix, as well as for the neural, vascular and immune cell populations residing within connective tissue.
INTRODUCTION
In contrast to muscle that can actively contract and relax to generate varying levels of tissue tension, connective tissue is considered to be a passive viscoelastic “material” whose biomechanical behavior is determined by the properties of its extracellular matrix (e.g. stiffness, viscosity) rather than cellular activity (e.g. contraction, relaxation). It is well established that connective tissue fibroblasts are able to influence matrix stiffness indirectly, via the production and degradation of matrix proteins (Chiquet et al., 2003; Karamichos et al., 2007; Kook et al., 2009; Prajapati et al., 2000). In healing wounds, fibroblasts also can differentiate into myofibroblasts that can contract and generate measurable increases in connective tissue tension over long time periods (hours to weeks) (Gabbiani, 1979; Hinz et al., 2001; Majno et al., 1971; Schleip et al., 2005). However, in the absence of injury or other stimulus leading to myofibroblast transformation, connective tissue tension is not considered to be cell-dependent.
Non-muscle cells such as fibroblasts use cytoskeletal remodeling and actomyosin interactions to reorganize and contract parts of their cytoplasm during activities such as cell migration and neuronal sprouting (da Silva and Dotti, 2002; Schwartz and Horwitz, 2006). Experiments in cultured fibroblasts also have shown that cytoskeletal reorganization can influence the tension of the substrate onto which the cells are growing (Brown et al., 1998; Brown et al., 1996; Freyman et al., 2002; Grinnell, 2003; Kolodney and Wysolmerski, 1992; Tomasek et al., 1992). However, to our knowledge, fibroblast cytoskeletal remodeling has not been shown to directly influence connective tissue matrix tension in whole tissue. If it exists, the potential significance of such a mechanism could be far reaching, given the increasingly recognized role of connective tissue in musculoskeletal dynamics, the ubiquitous presence of connective tissue in all organ systems, and the established importance of tissue forces in cell matrix interactions (Lopez et al., 2008; Maas and Huijing, 2009; Mammoto and Ingber, 2009; Paszek et al., 2005; Patwari and Lee, 2008).
We have previously shown that fibroblasts within areolar “loose” connective tissue exhibit pronounced, dynamic cytoskeletal remodeling, spreading and lamellipodia formation within minutes in response to changes in tissue length in the physiological range both ex vivo and in vivo (Langevin et al., 2005). The goal of this study was to investigate whether these fibroblast cytoskeletal responses could play a role in regulating tension within the whole tissue. We hypothesized that interfering with cytoskeletal remodeling would alter the viscoelastic relaxation of connective tissue that occurs in response to static tissue stretch ex vivo.
MATERIALS AND METHODS
Experimental design
An important aspect of the ex vivo experimental system used in this study is that the viscoelastic behavior of a single sheet of areolar connective tissue can be studied immediately after excision from a mouse, followed by tissue fixation and morphometric measurements. Mouse areolar connective tissue was stretched uniaxially while subjected to a set of pharmacological interventions to interfere with different aspects of cell function and cytoskeletal dynamics, then imaged with confocal microscopy. We used inhibitors of cell respiration (sodium azide), microtubule polymerization (colchicine) and of two different Rho GTPase cytoskeletal signaling pathways (Rho kinase and Rac-1) known to be involved in different aspects of cytoskeletal remodeling to examine the relationship between connective tissue viscoelastic behavior and fibroblast morphometric measurements. Tissue force was recorded continuously during the period of static stretch, and the force at 50 minutes (equilibrium tissue force) was used as the primary outcome measure. Force data also was analyzed using a five parameter Maxwell viscoelastic model allowing determination of tissue stiffness and viscosity parameters (Iatridis et al., 2003). Fibroblast morphology was quantified in confocal microscopy images of each whole tissue sample fixed immediately after the static stretch. Cell body cross sectional area and cell field perimeter (obtained by joining the end of all of a fibroblast’s processes) (Langevin et al., 2005) were used to measure the change in cell morphology occurring in response to tissue stretch with and without pharmacological inhibitors.
Tissue dissection
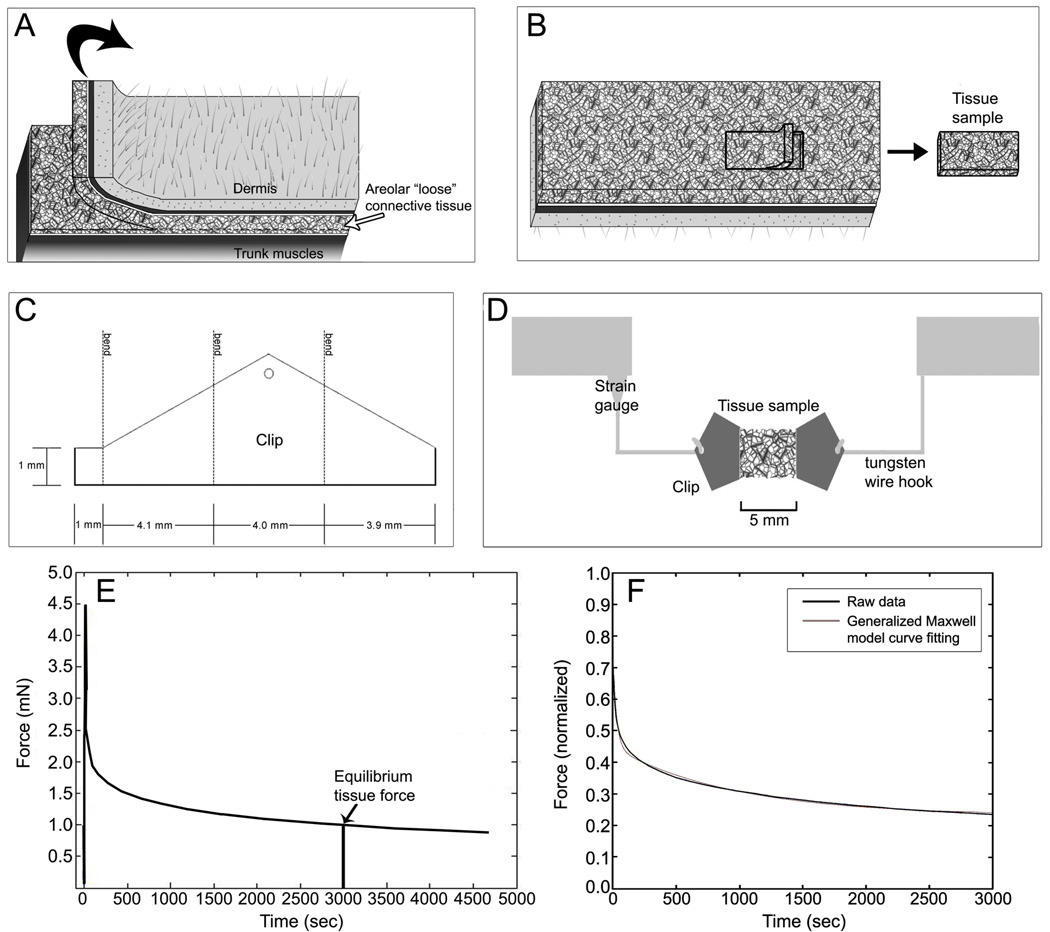
Twenty eight C57Black-6 male mice (19–24 g) were sacrificed by decapitation. Immediately after death, an 8 cm × 3 cm tissue flap was excised from the back of the mouse (Fig. 1A) and covered with 37 ° C physiological saline solution (PSS), pH 7.4, containing (mM): NaCl 141.8, KCl 4.7, MgSO4 1.7, EDTA 0.39, CaCl2 2.8, HEPES 10, KH2PO4 1.2, Glucose 5.0. The exposed areolar connective tissue layer is composed of several loosely connected sublayers that can be dissected with minimal cutting of tissue. A sample of the first areolar connective tissue sublayer was dissected following the natural cleavage plane of the tissue and cut to uniform dimensions yielding a single tissue sheet measuring 4 mm width × 5 mm length (Fig. 1B). Although precise measurement of tissue thickness in fresh samples is difficult, the thickness of this tissue layer is estimated to be ~350 µm based on both fresh and fixed tissue measurements. The sample was clipped at both ends and attached to an Akers strain gauge (Akers, Horten, Norway) calibrated for force measurement (Fig. 1 C,D) in 37 °C PSS with or without inhibitor. The direction of tissue stretch was always transverse relative to the in vivo tissue orientation.
Fig. 1.
Tissue sample preparation and force measurement methods.
A: Tissue flap excision method; B: dissection of areolar connective tissue sublayer following the natural cleavage plane of the tissue yielding a single tissue sheet; C: clip configuration; D: tissue sample testing method. E: Determination of resting tissue tension as the equilibrium tissue force at 50 minutes (3000 sec.); F: Curve fitting derived from normalized force data using the five-parameter Maxwell model described in the methods. Time constants in this specimen are t1 = 28.2 s and t2 = 958 s; goodness of fit of the model (R2 = 0.99).
Static tissue stretch and force recording
Tissue samples were elongated at 1 mm/sec until a target peak force of 4.4 mN and maintained at that length for the 60 min incubation. This resulted in a mean ± SD actual peak force of 4.68 ± 0.53 mN among all samples tested (there was no significant difference in peak force between experimental groups). This static tissue stretch corresponded to ~20–25 % tissue elongation, previously shown to be within the linear portion of the force-deformation curve for areolar connective tissue (Iatridis et al., 2003). Tissue force was continually recorded during stretching and subsequent incubation using Labview software (National Instruments, Austin, TX) at 10 Hz. At the end of incubation, the tissue was immersion-fixed in 95% ethanol for 60 min at the stretched length.
Pharmacological inhibitors
The following inhibitors were used, all dissolved directly into the HEPES buffer: 50 µM sodium azide, inhibitor of cellular respiration (Sigma, St. Louis, MO.), 100 µM colchicine, inhibitor of microtubule polymerization (Sigma, St. Louis, MO), 10 µM Rho kinase inhibitor Y27632 (BioMol, Philadelphia, PA), 115 µM Rac-1 inhibitor (Calbiochem, Darmstadt, Germany) or vehicle control (PSS). Additional experiments were conducted with the Rac-1 at 254 µM and, as similar results were obtained for both concentrations of Rac-1 inhibitor, only the results of experiments using 115 µM are presented. Cell-specific inhibitors were chosen rather than more general physical methods of cell disruption, such as freezing or detergents, in order to minimize any direct effects of the interventions on the extracellular matrix.
Force data analysis
Resting tissue tension at 50 minutes (3,000 s) (mean of ten data points) was used as the primary outcome measure (equilibrium tissue force) (Fig. 1E). In addition, curve fitting of the normalized force data was performed using a five parameter Maxwell model (Iatridis et al., 2003) as shown in Fig. 1 F using the equation:
where parameters are viscosity coefficients (μ1 and μ2), stiffness coefficients (g1 and g2) and the equilibrium stiffness g0. The subscripts 1 and 2 of these parameters represent the short-range and long-range time behaviors associated with the time constants t1=μ1/g1 and t2=μ2/g2 respectively. Experimentally, tissue force was measured instead of stress because, unlike a solid, it is extremely difficult to measure the actual dimensions of the cross section of areolar connective tissue samples in the wet condition (Iatridis et al., 2003).
Histochemical staining
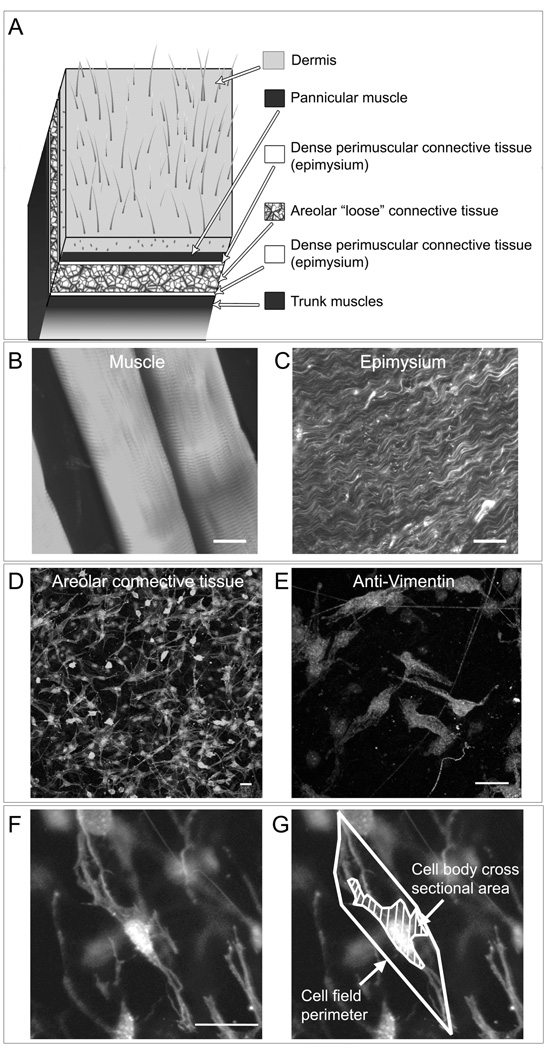
As illustrated in Fig. 2 D, the superficial layer of areolar connective tissue from C57B6 mice used in this study is composed of uniform loose connective tissue devoid of blood vessels and nerve fibers which are located in deeper areolar connective tissue sublayers. Cells within the areolar connective tissue samples can be visualized within their native 3-d matrix environment in whole tissue mounts using confocal microscopy without embedding, freezing or sectioning. Phalloidin (specific stain for polymerized actin) was used to visualize connective tissue cells with confocal microscopy. This also allowed examination of each sample to confirm the absence of any contaminating muscle tissue or dense epimysium (Fig. 2 B,C). The majority (70–80%) of cells within these tissue samples have fibroblast-like characteristics based on cytoplasmic and nuclear morphology (phalloidin and DAPI staining) and immunohistochemically staining for vimentin (Fig. 2E) and will be referred to in this paper as fibroblasts. An additional 10–15% of cell can be identified as macrophages (based on CD-68 immunoreactivity) and 2–4% as mast cells (based on cresyl violet stain).
Fig. 2.
Fibroblast morphology in mouse “loose” areolar connective tissue imaged with confocal microscopy. A: Anatomical location of areolar connective tissue samples in relation to neighboring tissue layers. B–E: Histological appearance of areolar connective tissue (D) in contrast to muscle (B) and epimysium (C) when stained with Texas-red conjugated phalloidin (specific stain for polymerized actin) and imaged with confocal microscopy. E: Areolar connective tissue fibroblasts immunohistochemically stained for vimentin. F–G: Measurement of areolar connective tissue fibroblasts for cell body cross sectional area and cell field perimeter (see methods). Images are projected z-stacks of full thickness tissue sample (20 optical sections with inter-image distance 0.53 µm). Scale bars, 20 µm.
Histochemical methods
Each whole sample was stained with Texas Red conjugated phalloidin 1:25 (4 U/ml; Molecular Probes, Eugene OR) for 40 min at 4°C, counterstained for 5 min with DAPI nucleic acid stain 1:6000 (Molecular Probes, Eugene OR) and mounted on slides using 50% glycerol in PBS with 1% N-propylgallate. Additional samples were fixed in 3% paraformaldehyde (PFA) and stained for vimentin for morphological characterization of fibroblasts using indirect immunohistochemistry. Samples were first incubated with a mouse monoclonal anti-α-vimentin primary antibody (Sigma, St. Louis, MO) at 1:25 dilution followed by an Alexa 488-conjugated secondary goat anti-mouse antibody (Invitrogen Corporation, Carlsbad, CA) at 1:200 dilution. To reduce background staining resulting from using a mouse primary antibody, samples were incubated with Mouse-On-Mouse (M.O.M) blocking reagents (Vector Laboratories, Burlingame, CA) according to the manufacturers’ directions.
Measurement of tissue cellular composition
For assessment of the effect of tissue stretch on the number of macrophage and mast cells present within the tissue, samples from five additional mice (two samples per mouse, randomized within mouse) were incubated for 50 minutes with and without stretch (randomized within mouse), fixed in 3% PFA and immunohistochemical stained for macrophages using a mouse monoclonal CD-68 antibody at 1:25 dilution (AbD Serotec, Raleigh, NC) followed by an Alexa 488-conjugated secondary goat anti-mouse antibody (Invitrogen Corporation, Carlsbad, CA) at 1:200 dilution and MOM blocking reagent as above. Staining for mast cells was performed in PFA fixed tissue using cresyl violet at 1µg/ml in water at 37° for 2 minutes. Cell counts for macrophage and mast cell quantification were performed by hand by an investigator blinded to the study condition (stretch vs. no stretch).
Measurement of cell viability
For assessment of the effect of tissue stretch on cell viability, samples from five additional mice (two samples per mouse, randomized within mouse) were incubated for 50 minutes with and without stretch, then stained for live and dead cells (Invitrogen L3224, Carlsbad, CA) according to manufacturer’s direction. Cell counts for live/dead staining were performed by hand by an investigator blinded to the study condition (stretch vs. no stretch).
Confocal scanning laser microscopy
Tissue samples were imaged with a Zeiss LSM 510 META confocal scanning laser microscope at 63X (oil immersion lens, N.A. 1.4) at room temperature. Each tissue sample was first examined in its entirety to confirm the absence of any contaminating muscle or epimysium, which would respectively appear as brightly staining Z-banded actin-containing sarcomeres (Fig. 2B), or densely packed collagen and elastic fibers (Fig. 2C). Seven fields per sample were then selected for image acquisition by an imager blind to the study condition (drug or no drug). For each field, a stack of 20 (143 µm × 143 µm) images was acquired at a 0.53 µm inter-image interval.
Morphometric analysis
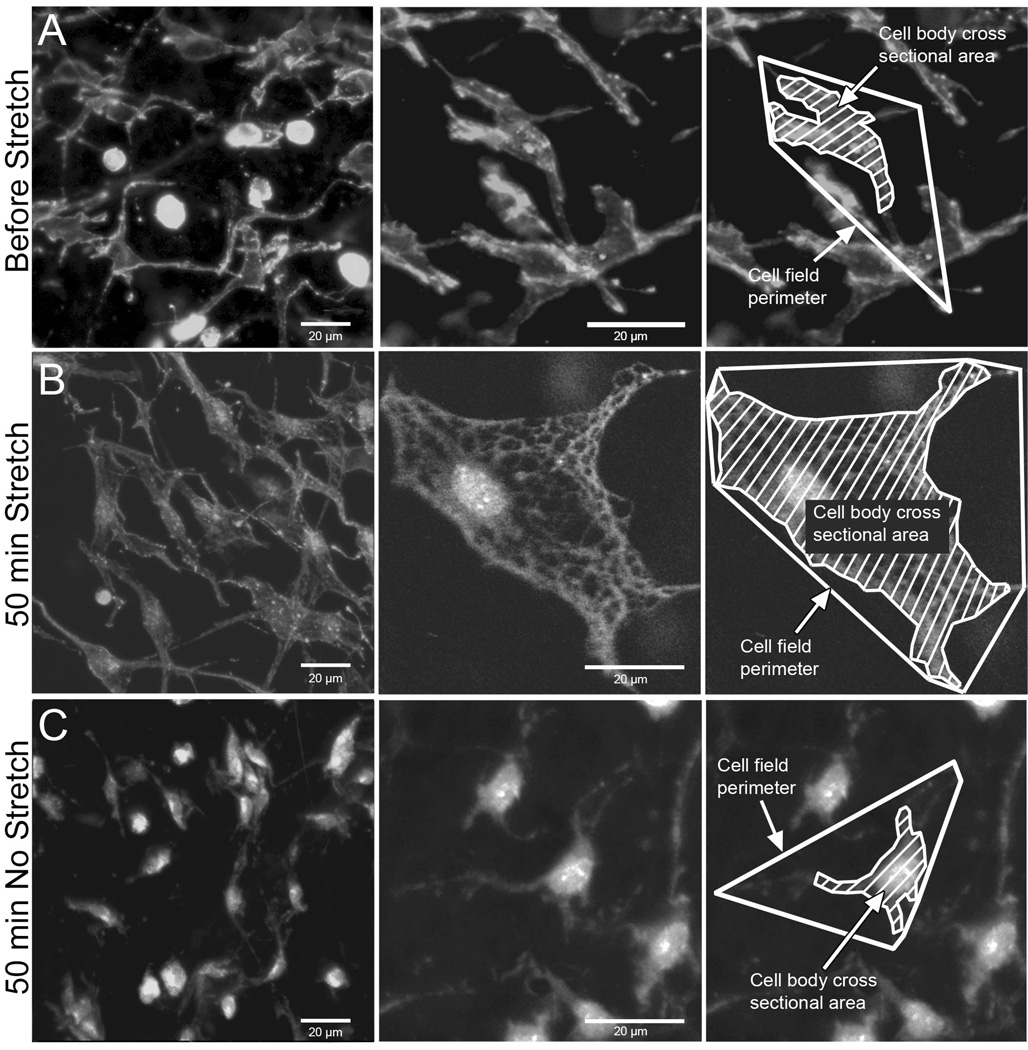
Measurement of cell body cross sectional area and cell field perimeter in phalloidin-stained samples allows assessment of the size of the cell body as well as the whole “territory” occupied by each cell including cell processes (Fig. 2 F–G). Image stacks were imported into the analysis software MetaMorph 6.0 (Universal Imaging, Downingtown, PA). In each stack, all cells that were in focus in the 10th optical section (middle of stack) were measured as previously described (Langevin et al., 2005). All cells were measured, with the assumption that fibroblasts are the overwhelmingly predominant cell population in this tissue. Cell body cross sectional area and cell field perimeter were measured as shown in Fig. 2 F,G. Cell body cross sectional area was defined as the area of the cell’s cytoplasm projected in the plane of the image excluding cell processes (defined as an extension of a cell’s cytoplasm longer than 2 µm and less than 2 µm in width at any portion of its length). Cell field perimeter was defined as the sum of segments connecting the end of all visible cell processes identified by following each one through successive optical sections within the image stack. As illustrated in Figure 3, both cell cross sectional area and cell field perimeter increase in response to tissue stretch for 50 minutes ex vivo due to cell spreading and lamellipodia formation as previously shown both ex vivo and in vivo (Langevin et al., 2005).
Fig. 3.
Effect of tissue stretch on fibroblast morphology. Mouse areolar connective tissue was fixed immediately post excision (A), incubated for 50 minutes ex vivo with stretch (B) and incubated for 50 minutes ex vivo without stretch (C). Tissue samples were fixed with 95% ethanol and stained with Texas Red-conjugated phalloidin (specific stain for polymerized actin).
RESULTS
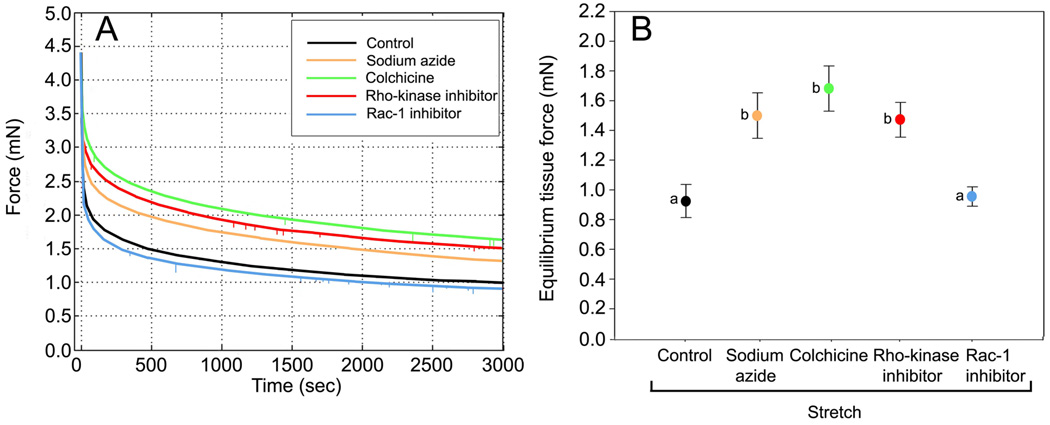
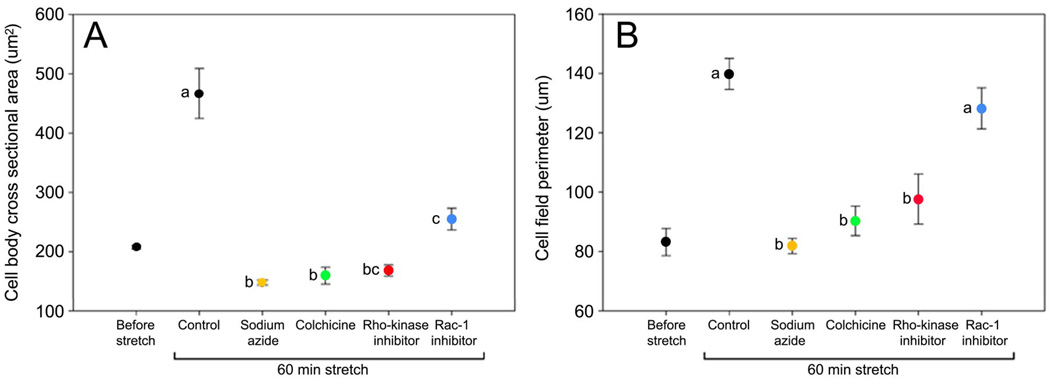
In order to test the hypothesis that fibroblast spreading influences tissue tension, we first used sodium azide which impairs cell respiration to broadly assess whether overall cellular activity contributes to the viscoelastic behavior of the tissue. Incubation with sodium azide caused the equilibrium tissue force to be higher compared with controls (Fig. 4). Cell body cross sectional area and cell field perimeter measurements also were greater with sodium azide compared with stretched controls (Figs. 5 and 6). This indicates that metabolic activity is required for both fibroblast expansion and full tissue relaxation in response to stretch.
Fig. 4.
Effect of pharmacological inhibitors on force measurements during uniaxial tissue stretch. A: Representative force measurement curves for inhibitors compared with controls. B: Mean ± SE equilibrium tissue force across experimental conditions. Equilibrium tissue force was significantly different among the groups (ANOVA, F=8.00, p<.001, N=28 mice). Individual comparisons using Fisher’s LSD showed that sodium azide, colchicine and Rho kinase inhibitor were significantly different from control and Rac-1 inhibitor, but were not significantly different from each other. Means sharing a common letter are not significantly different (Fisher’s LSD).
Fig. 5.
Effect of pharmacological inhibitors on fibroblast measurements.
Mean ± SE cell body cross sectional area (A) and cell field perimeter (B) across experimental conditions. Cell body cross sectional area (F=25.8, p<.0001) and cell field perimeter (F=19.6, p<.0001) were significantly different among the experimental groups (ANOVA, N=28 mice). Individual comparisons using Fisher’s LSD showed that cell body cross sectional area was significantly greater in control samples compared with all pharmacological inhibitors. For cell field perimeter, control samples were not significantly different from samples incubated with Rac-1 inhibitor, but were significantly different from all other groups. Means sharing a common letter are not significantly different (Fisher’s LSD).
Fig. 6.
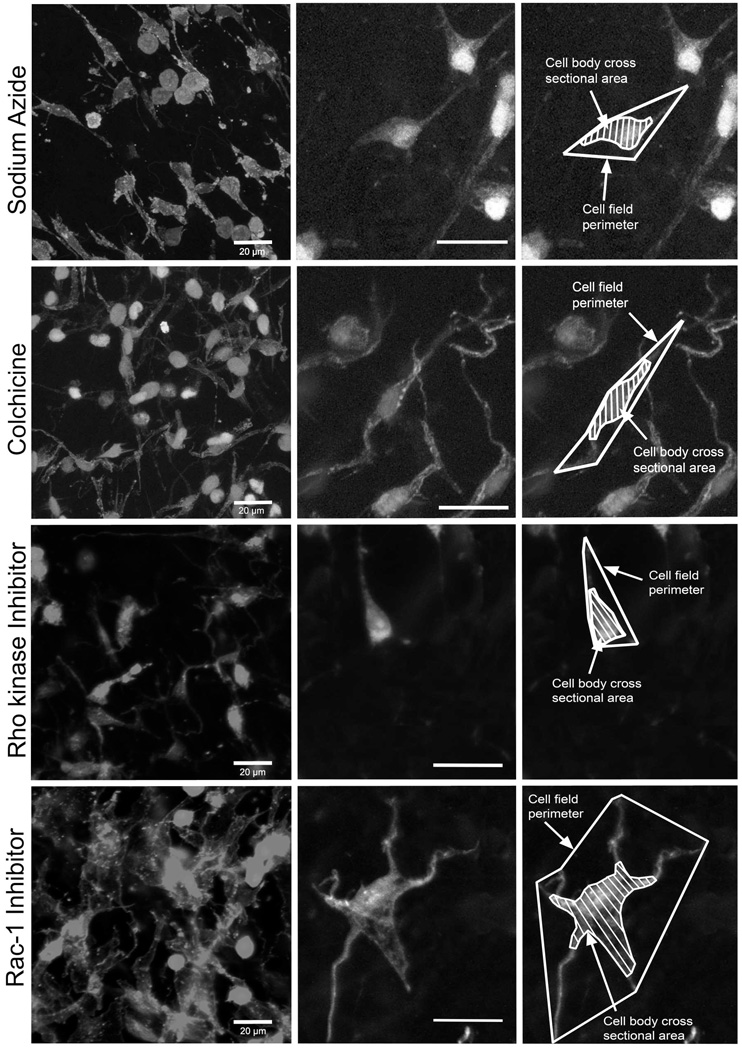
Effect of pharmacological inhibitors on fibroblast morphology. Areolar connective tissue samples were incubated for 50 minutes with stretch in the presence of sodium azide (A), colchicine (B), Rho kinase inhibitor (C) and Rac-1 inhibitor (D). Tissue samples were fixed with 95% ethanol and stained with Texas Red-conjugated phalloidin. Scale bars, 20µm.
To further examine the role of the cytoskeleton in cell-mediated connective tissue relaxation, we then used colchicine to inhibit microtubule polymerization. We found that colchicine had an effect similar to that of sodium azide on both tissue tension (Fig. 4) and cell morphology (Figs. 5 and 6), indicating that expansion of the intracellular microtubule network is required for the fibroblasts to be able to both change shape and contribute to tissue relaxation.
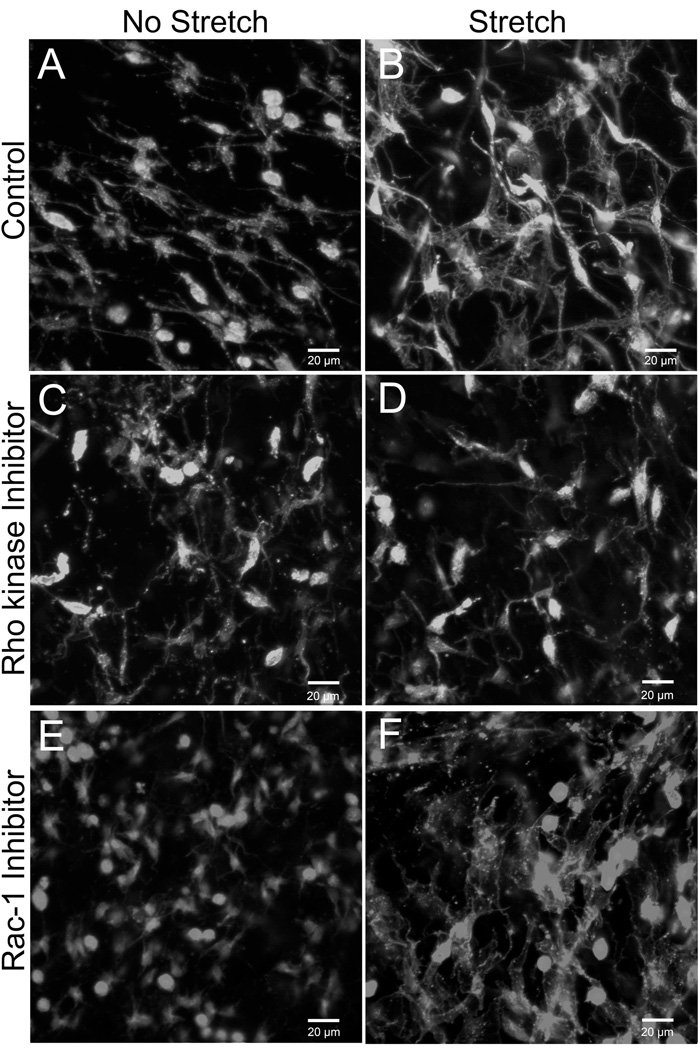
We then tested whether specific aspects of cytoskeletal remodeling could be differentially involved in modulating both the change in cell shape and tissue tension. Rho and Rac are members of a family of small GTP-ases that play complementary roles in cytoskeletal remodeling, respectively regulating cytoskeletal contraction and actin dendritic network expansion (Burridge and Wennerberg, 2004; Ridley and Hall, 1992; Ridley et al., 1992). Inhibition of Rho activity with the Rho kinase inhibitor Y27632 had effects similar to those of sodium azide and colchicine on both tissue tension (Fig. 4) and fibroblast measurements (Fig. 5 and 6). In contrast, inhibition of Rac-1 did not affect tissue tension (Fig. 4) and resulted in fibroblasts with small cell body cross sectional area but normal cell field perimeter (Figs. 5 and 6). As illustrated in Figure 6, fibroblast processes in stretched tissue were short with Rho kinase inhibition, but were long and “spider-like” with Rac-1 inhibition, thus explaining the difference in cell body perimeter between the two experimental conditions. Incubation of tissue samples for 50 minutes with Rho kinase and Rac-1 inhibitors in the absence of tissue stretch yielded fibroblast similar to those of non-stretched tissue incubated without inhibitors (Fig. 7).
Fig. 7.
Effect of Rho kinase and Rac-1 inhibitors with and without tissue stretch compared with control tissue without inhibitors. Tissue samples were fixed with 95% ethanol and stained with Texas Red-conjugated phalloidin.
Table 1 lists viscoelastic parameters based on the five parameter Maxwell model as well as results of ANOVA and pair-wise comparisons for tissue force and cell morphometric measurements. Among the viscoelastic parameters, there were significant differences between experimental groups for parameters g0 (F=7.99, p<.001), g1 (F=8.98, p<.001), g2 (F=5.76, p<.001) and μ2 (F=3.59, p<.05) but not for μ1 (F=0.70, p=.60) (ANOVA). Inhibition of cell respiration (sodium azide), microtubule polymerization (colchicine) and Rho kinase (y27632) decreased tissue stiffness in the early part of the curve (time constant T1~30–50 seconds), but increased tissue stiffness and viscosity in the late parts of the curve (time constant T2~15–20 minutes), as well as increased equilibrium tissue force compared with controls. In contrast, samples incubated with Rac-1 were not significantly different from controls for any of the viscoelastic parameters. Cell body cross sectional area and cell field perimeter were negatively correlated with the equilibrium tissue force (r = −0.58, p<.001 and r = −0.56, p<.001 respectively). Similar magnitude correlations were seen with viscoelastic parameter estimates that differed across treatments. Thus, inhibition of cellular respiration, microtubule polymerization and Rho kinase all had similar effects on the tissue’s viscoelastic response, resulting in an increased equilibrium tissue force at 50 minutes, which was inversely related to cell field perimeter.
Table 1.
Tissue force and cell morphometric measures across experimental conditions. Tabled values are mean ± SE. Means sharing a common letter are not significantly different (Fisher’s LSD).
| Control | Sodium Azide |
Colchicine | Rho-kinase inhibitor |
Rac-1 Inhibitor |
P Value |
||
|---|---|---|---|---|---|---|---|
| N = 8 | N = 5 | N = 5 | N = 5 | N = 5 | (ANOVA) | ||
| Equilibrium tissue force (mN) | 0.94 ± 0.11 a |
1.53 ± 0.15 b |
1.72 ± 0.15 b |
1.50 ± 0.12 b |
0.98 ± 0.06 a |
.0003 | |
| Maxwell model parameter estimates | g0 | 0.20 ± 0.02 a |
0.32 ± 0.03 |
0.35 ± 0.04 |
0.32 ± 0.02 b |
0.21 ± 0.01 a |
.0004 |
| g1 | 0.28 ± 0.01 a |
0.21 ± 0.01 b |
0.20 ± 0.01 b |
0.22 ± 0.01 b |
0.27 ± 0.01 a |
.0002 | |
| g2 | 0.20 ± 0.02 a |
0.26 ± 0.01 b |
0.27 ± 0.01 b |
0.27 ± 0.02 b |
0.21 ± 0.02 a |
.0025 | |
| μ1 | 8.48 ± 1.36 a |
9.70 ± 1.31 a |
9.86 ± 0.92 a |
11.47 ± 2.08 a |
8.56 ± 0.99 a |
.601 | |
| μ2 | 204.19 ± 46.43 a |
330.15 ± 31.32 b |
326.57 ± 17.01 b |
313.56 ± 32.48 bc |
217.38 ± 27.75 ac |
.021 | |
| t1 | 31.52 ± 6.82 a |
47.65 ± 9.56 a |
48.58 ± 4.84 a |
51.51 ± 9.73 a |
32.97 ± 5.05 a |
.219 | |
| t2 | 989.28 ± 85.79 a |
1231.24 ± 78.77 b |
1228.10 ± 50.39 b |
1143.26 ± 49.38 ab |
1010.66 ± 66.63 ab |
.090 | |
| Cell body cross sectional area (µm2) | 467.62 ± 41.90 a |
148.34 ± 4.39 b |
159.78 ± 14.34 b |
168.69 ± 9.27 bc |
255.22 ± 18.45 c |
<.0001 | |
| Cell field perimeter (µm) | 139.84 ± 5.22 a |
81.79 ± 2.56 b |
90.31 ± 4.96 b |
97.64 ± 8.44 b |
128.21 ± 6.94 a |
<.0001 |
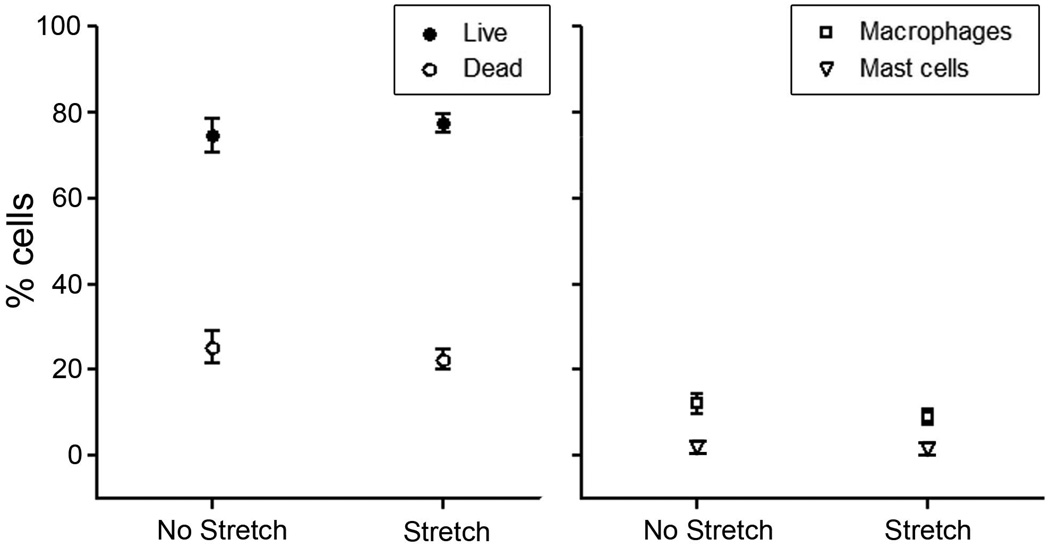
In order to verify that the increase in cell cross sectional area and cell field perimeter in stretched tissue samples was not due to difference in cell viability or differences in the number of non-fibroblast cells, we performed staining for live/dead cells, macrophages and mast cells and found no significant difference between stretched and non-stretched tissue samples (Fig. 8).
Fig. 8.
Effect of tissue stretch on cell viability and composition. There were no significant differences in the percentage of live and dead cells (p=.41) (A), as well as the number of macrophages (p=.29) and mast cells (p=.90) (B) between stretched and non-stretched areolar connective tissue samples (paired t-tests, N=5 for all groups). All tissue samples were incubated for 50 minutes with or without stretch.
DISCUSSION
The results of this study demonstrate that the viscoelastic behavior of areolar connective tissue under tension is substantially influenced by cellular activity. Resting tissue tension was 60–80% greater when tissue was stretched in the presence of specific inhibitors of cell function. Together, our biomechanical and morphological results show that fibroblast cytoskeletal remodeling allowed the tissue to relax further and achieve a lower level of resting tension. In addition, tissue viscoelastic properties were altered by the cellular inhibitors within ~30 seconds of applying the load. This suggests a different mechanism from matrix remodeling via the expression of fibroblast mechanosensitive genes which takes hours to occur (Chiquet et al., 2003).
The differential effects of Rho and Rac inhibition in our experiments are supported by the known contrasting effects of these two cytoskeletal signaling molecules (Heasman and Ridley, 2008; Jaffe and Hall, 2005). Increased resting tissue tension was specifically induced by inhibition of Rho kinase, which regulates actomyosin contractility, formation of stress fibers and maturation of focal adhesions. Increased resting tension was not seen upon inhibition of Rac-1, which mediates lamellipodia protrusion, dendritic actin polymerization and the formation of new focal complexes at the leading edge. Both Rho kinase and Rac-1 inhibitors prevented cell spreading in response to tissue stretch (both inhibitors decreased the cell body cross sectional area), while only inhibition of Rho kinase (but not Rac-1) reduced the length of cell processes (decreased cell field perimeter). Our results therefore suggest that viscoelastic tissue relaxation in response to tissue stretch involves Rho-dependent, but Racindependent cytoskeletal and morphological remodeling in fibroblasts. These results are consistent with previously proposed mechanotransduction models (Ingber, 1997) which suggest that microtubule network expansion and actomyosin-derived counter-tension could lead to a drop in matrix tension (Brown et al., 1998; Brown et al., 1996). Alternatively, or in addition, Rho-dependent remodeling of cell-matrix contacts along the direction of tissue stretch could allow fibroblasts to reduce tissue tension in response to a perceived tensile load (Bershadsky et al., 2006; Bershadsky et al., 2003; Gavara et al., 2008; Geiger et al., 2009; Wang, 2007). Our current data suggest that tensional homeostasis upon stretching of whole connective tissue requires the ability of fibroblasts to actively remodel their internal contractile and tension-bearing structures to adapt to increased local tension and achieve connective tissue relaxation; cellular inability to affect such remodeling interrupts this dynamic interplay and manifests as unresolved tension and stiffened tissue.
Areolar or “loose” connective tissue forms a continuous network throughout the body that constitutes the stroma of all organs and surrounds all neurovascular bundles. At the local cellular level, matrix tension has been shown to influence a wide variety of cellular events including neurite growth and angiogenesis (Anava et al., 2009; Kniazeva and Putnam, 2009; Langevin et al., 2004). At the macroscopic tissue level, it is well established that connective tissues are under tension in vivo and recoil upon detachment from their surrounding connections (Silver et al., 2003; Walbeehm et al., 2004). In a previous study in mice, we found that fibroblast cross sectional area was twice as large when fixed in situ by subcutaneous ethanol injection in the intact animal, compared with fixation after tissue excision (Langevin et al., 2005). This suggested that areolar connective tissue fibroblasts “tonically” organize their cytoskeleton in response to some amount of tensile prestress. Furthermore, in live anesthetized mice in which the trunk of the mouse was side-bent passively for 30 minutes in vivo (such that one side of the trunk was stretched while the other side was shortened), fibroblasts were larger on the stretched side, compared with the shortened side (Langevin et al., 2005). This demonstrated that fibroblast cytoskeletal remodeling responses are modulated by changes in tissue length in vivo. The current study shows that, in addition, these same fibroblast responses are accompanied by modulation of whole tissue tension. Dynamic, cell-mediated connective tissue tension regulation may be important to protect blood vessels, sensory and autonomic nerves from prolonged tissue loads induced by body positions such as sitting, standing, sleep position or work-related posture. The ability to actively regulate connective tissue tension also may be especially relevant to tumor biology, since mechanical forces and matrix stiffness are increasingly recognized to play key roles in cellular neoplastic behavior and tumor metastasis (Huang and Ingber, 2005; Jaalouk and Lammerding, 2009; Levental et al., 2009; Lopez et al., 2008). Thus, in vivo, connective tissue tension may impact not just connective tissue itself, but also the vascular, nervous and immune cell populations that reside within the connective tissue network, as well as adjacent organ-specific cell populations.
The intimate anatomical association of muscle and connective tissue also suggests that our findings have relevance to basic musculoskeletal physiology. Areolar connective tissue layers allow muscles and dense fascia layers to glide past one another and play a newly appreciated role in myofascial force transmission (Benjamin, 2009; Yucesoy and Huijing, 2007). It is becoming clear, for example, that extramuscular connective tissues needs to be taken into consideration in experimental models of muscle adaptation to static changes in muscle length (Huijing and Jaspers, 2005). Exploration of a possible dynamic interplay between muscle and connective tissue tension/relaxation therefore could further illuminate the role of connective tissue in muscle function.
It is important to note that the current study only examined areolar connective tissue located between the subcutaneous and deep back muscles of the mouse. We do not know at this point whether our findings generalize to areolar connective tissue at other locations such as the connective tissue stroma of organs, or to dense load-bearing connective tissues such as ligaments, tendons and perimuscular fasciae. In particular, we do not know if the compositional characteristics of areolar connective tissue (high cell density, low collagen density, loosely arranged collagen orientation) are important for fibroblast-mediated tension regulation to occur. It is indeed possible that, in denser load-bearing connective tissues, fibroblasts are “shielded” from tissue loads by the stiffer collagen matrix and thus might not exhibit the type of cytoskeletal responses to tissue stretch described in this study. This question has potential clinical significance since pathological increases in collagen density (e.g. due to fibrosis) could impair fibroblast responses and active tension regulation in previously “loose” areolar connective tissue. Measurement of fibroblast responses in normal and fibrosed connective tissues at different levels of tissue strain will be important to answer these questions. An additional limitation of our study is that tissue stretch was applied uniaxially in the transverse direction (relative to the tissue’s in vivo orientation), and that the absence of longitudinal tension may have influenced the cells’ behavior. Further studies using varying degrees of biaxial tension will be needed to examine the relationship between fibroblast responses in relation to the tissue’s previous in vivo history. However, our results demonstrate that fibroblast-mediated connective tissue relaxation does occurs and is measurable at the macroscopic tissue level using physiologically-relevant levels of tissue stretch.
In conclusion, this study shows that, by remodeling their cytoskeleton, fibroblasts rapidly (within seconds to minutes) modulate the stiffness and viscosity of whole areolar connective tissue. Because our previous work showed that similar fibroblast cytoskeletal remodeling responses occur in vivo in response to change in body position, our current results suggest that active regulation of areolar connective tissue tension is a normal and dynamic physiological process that occurs in response to changes in tissue length. The concept that fibroblasts are capable of actively modulating the mechanical environment of whole tissue opens up a new direction of inquiry for cell and tissue physiology and especially for mechanotransduction research that, so far, has heavily relied on cell culture models. While cultured cells provide powerful tools to test specific mechanisms, understanding how cells respond to mechanical forces ultimately requires understanding these responses within the complex and continually evolving mechanical environment of whole living tissue.
ACKNOWLEDGEMENTS
The authors thank Dr. William C. Earnshaw for his comments on the manuscript and Richard LaChappelle for technical assistance.
This study was funded by National Center for Complementary and Alternative Medicine Research Grant RO1-AT001121. Its contents are solely the responsibility of the authors and do not necessarily represent the official views of the National Institutes of Health.
REFERENCES
- Anava S, Greenbaum A, Ben Jacob E, Hanein Y, Ayali A. The regulative role of neurite mechanical tension in network development. Biophys J. 2009;96(4):1661–1670. doi: 10.1016/j.bpj.2008.10.058. [DOI] [PMC free article] [PubMed] [Google Scholar]
- Benjamin M. The fascia of the limbs and back--a review. J Anat. 2009;214(1):1–18. doi: 10.1111/j.1469-7580.2008.01011.x. [DOI] [PMC free article] [PubMed] [Google Scholar]
- Bershadsky A, Kozlov M, Geiger B. Adhesion-mediated mechanosensitivity: a time to experiment, and a time to theorize. Curr Opin Cell Biol. 2006;18(5):472–481. doi: 10.1016/j.ceb.2006.08.012. [DOI] [PubMed] [Google Scholar]
- Bershadsky AD, Balaban NQ, Geiger B. Adhesion-dependent cell mechanosensitivity. Annu Rev Cell Dev Biol. 2003;19:677–695. doi: 10.1146/annurev.cellbio.19.111301.153011. [DOI] [PubMed] [Google Scholar]
- Brown RA, Prajapati R, McGrouther DA, Yannas IV, Eastwood M. Tensional homeostasis in dermal fibroblasts: mechanical responses to mechanical loading in three-dimensional substrates. J Cell Physiol. 1998;175(3):323–332. doi: 10.1002/(SICI)1097-4652(199806)175:3<323::AID-JCP10>3.0.CO;2-6. [DOI] [PubMed] [Google Scholar]
- Brown RA, Talas G, Porter RA, McGrouther DA, Eastwood M. Balanced mechanical forces and microtubule contribution to fibroblast contraction. J Cell Physiol. 1996;169(3):439–447. doi: 10.1002/(SICI)1097-4652(199612)169:3<439::AID-JCP4>3.0.CO;2-P. [DOI] [PubMed] [Google Scholar]
- Burridge K, Wennerberg K. Rho and Rac take center stage. Cell. 2004;116(2):167–179. doi: 10.1016/s0092-8674(04)00003-0. [DOI] [PubMed] [Google Scholar]
- Chiquet M, Renedo AS, Huber F, Fluck M. How do fibroblasts translate mechanical signals into changes in extracellular matrix production? Matrix Biol. 2003;22(1):73–80. doi: 10.1016/s0945-053x(03)00004-0. [DOI] [PubMed] [Google Scholar]
- da Silva JS, Dotti CG. Breaking the neuronal sphere: regulation of the actin cytoskeleton in neuritogenesis. Nat Rev Neurosci. 2002;3(9):694–704. doi: 10.1038/nrn918. [DOI] [PubMed] [Google Scholar]
- Freyman TM, Yannas IV, Yokoo R, Gibson LJ. Fibroblast contractile force is independent of the stiffness which resists the contraction. Exp Cell Res. 2002;272(2):153–162. doi: 10.1006/excr.2001.5408. [DOI] [PubMed] [Google Scholar]
- Gabbiani G. The role of contractile proteins in wound healing and fibrocontractive diseases. Methods Achiev Exp Pathol. 1979;9:187–206. [PubMed] [Google Scholar]
- Gavara N, Roca-Cusachs P, Sunyer R, Farre R, Navajas D. Mapping cell-matrix stresses during stretch reveals inelastic reorganization of the cytoskeleton. Biophys J. 2008;95(1):464–471. doi: 10.1529/biophysj.107.124180. [DOI] [PMC free article] [PubMed] [Google Scholar]
- Geiger B, Spatz JP, Bershadsky AD. Environmental sensing through focal adhesions. Nat Rev Mol Cell Biol. 2009;10(1):21–33. doi: 10.1038/nrm2593. [DOI] [PubMed] [Google Scholar]
- Grinnell F. Fibroblast biology in three-dimensional collagen matrices. Trends Cell Biol. 2003;135:264–269. doi: 10.1016/s0962-8924(03)00057-6. [DOI] [PubMed] [Google Scholar]
- Heasman SJ, Ridley AJ. Mammalian Rho GTPases: new insights into their functions from in vivo studies. Nat Rev Mol Cell Biol. 2008;9(9):690–701. doi: 10.1038/nrm2476. [DOI] [PubMed] [Google Scholar]
- Hinz B, Mastrangelo D, Iselin CE, Chaponnier C, Gabbiani G. Mechanical tension controls granulation tissue contractile activity and myofibroblast differentiation. Am J Pathol. 2001;159(3):1009–1020. doi: 10.1016/S0002-9440(10)61776-2. [DOI] [PMC free article] [PubMed] [Google Scholar]
- Huang S, Ingber DE. Cell tension, matrix mechanics, and cancer development. Cancer cell. 2005;8(3):175–176. doi: 10.1016/j.ccr.2005.08.009. [DOI] [PubMed] [Google Scholar]
- Huijing PA, Jaspers RT. Adaptation of muscle size and myofascial force transmission: a review and some new experimental results. Scand J Med Sci Sports. 2005;15(6):349–380. doi: 10.1111/j.1600-0838.2005.00457.x. [DOI] [PubMed] [Google Scholar]
- Iatridis JC, Wu J, Yandow JA, Langevin HM. Subcutaneous tissue mechanical behavior is linear and viscoelastic under uniaxial tension. Connect Tissue Res. 2003;44(5):208–217. [PubMed] [Google Scholar]
- Ingber DE. Tensegrity: the architectural basis of cellular mechanotransduction. Annu Rev Physiol. 1997;59:575–599. doi: 10.1146/annurev.physiol.59.1.575. [DOI] [PubMed] [Google Scholar]
- Jaalouk DE, Lammerding J. Mechanotransduction gone awry. Nat Rev Mol Cell Biol. 2009;10(1):63–73. doi: 10.1038/nrm2597. [DOI] [PMC free article] [PubMed] [Google Scholar]
- Jaffe AB, Hall A. Rho GTPases: biochemistry and biology. Annu Rev Cell Dev Biol. 2005;21:247–269. doi: 10.1146/annurev.cellbio.21.020604.150721. [DOI] [PubMed] [Google Scholar]
- Karamichos D, Brown RA, Mudera V. Collagen stiffness regulates cellular contraction and matrix remodeling gene expression. J Biomed Mater Res A. 2007;83(3):887–894. doi: 10.1002/jbm.a.31423. [DOI] [PubMed] [Google Scholar]
- Kniazeva E, Putnam AJ. Endothelial cell traction and ECM density influence both capillary morphogenesis and maintenance in 3-D. Am J Physiol Cell Physiol. 2009;297(1):C179–C187. doi: 10.1152/ajpcell.00018.2009. [DOI] [PubMed] [Google Scholar]
- Kolodney MS, Wysolmerski RB. Isometric contraction by fibroblasts and endothelial cells in tissue culture: a quantitative study. J Cell Biol. 1992;117(1):73–82. doi: 10.1083/jcb.117.1.73. [DOI] [PMC free article] [PubMed] [Google Scholar]
- Kook SH, Hwang JM, Park JS, Kim EM, Heo JS, Jeon YM, Lee JC. Mechanical force induces type I collagen expression in human periodontal ligament fibroblasts through activation of ERK/JNK and AP-1. J Cell Biochem. 2009;106(6):1060–1067. doi: 10.1002/jcb.22085. [DOI] [PubMed] [Google Scholar]
- Langevin HM, Bouffard NA, Badger GJ, Iatridis JC, Howe AK. Dynamic fibroblast cytoskeletal response to subcutaneous tissue stretch ex vivo and in vivo. Am J Physiol Cell Physiol. 2005;288(3):C747–C756. doi: 10.1152/ajpcell.00420.2004. [DOI] [PubMed] [Google Scholar]
- Langevin HM, Cornbrooks CJ, Taatjes DJ. Fibroblasts form a body-wide cellular network. Histochem Cell Biol. 2004;122(1):7–15. doi: 10.1007/s00418-004-0667-z. [DOI] [PubMed] [Google Scholar]
- Levental KR, Yu H, Kass L, Lakins JN, Egeblad M, Erler JT, Fong SF, Csiszar K, Giaccia A, Weninger W, Yamauchi M, Gasser DL, Weaver VM. Matrix crosslinking forces tumor progression by enhancing integrin signaling. Cell. 2009;139(5):891–906. doi: 10.1016/j.cell.2009.10.027. [DOI] [PMC free article] [PubMed] [Google Scholar]
- Lopez JI, Mouw JK, Weaver VM. Biomechanical regulation of cell orientation and fate. Oncogene. 2008;27(55):6981–6993. doi: 10.1038/onc.2008.348. [DOI] [PMC free article] [PubMed] [Google Scholar]
- Maas H, Huijing PA. Synergistic and antagonistic interactions in the rat forelimb: acute effects of coactivation. J Appl Physiol. 2009;107(5):1453–1462. doi: 10.1152/japplphysiol.00328.2009. [DOI] [PubMed] [Google Scholar]
- Majno G, Gabbiani G, Hirschel BJ, Ryan GB, Statkov PR. Contraction of granulation tissue in vitro: similarity to smooth muscle. Science. 1971;173(996):548–550. doi: 10.1126/science.173.3996.548. [DOI] [PubMed] [Google Scholar]
- Mammoto A, Ingber DE. Cytoskeletal control of growth and cell fate switching. Curr Opin Cell Biol. 2009 doi: 10.1016/j.ceb.2009.08.001. [DOI] [PubMed] [Google Scholar]
- Paszek MJ, Zahir N, Johnson KR, Lakins JN, Rozenberg GI, Gefen A, Reinhart-King CA, Margulies SS, Dembo M, Boettiger D, Hammer DA, Weaver VM. Tensional homeostasis and the malignant phenotype. Cancer cell. 2005;8(3):241–254. doi: 10.1016/j.ccr.2005.08.010. [DOI] [PubMed] [Google Scholar]
- Patwari P, Lee RT. Mechanical control of tissue morphogenesis. Circ Res. 2008;103(3):234–243. doi: 10.1161/CIRCRESAHA.108.175331. [DOI] [PMC free article] [PubMed] [Google Scholar]
- Prajapati RT, Eastwood M, Brown RA. Duration and orientation of mechanical loads determine fibroblast cyto-mechanical activation: monitored by protease release. Wound Repair Regen. 2000;8(3):238–246. doi: 10.1046/j.1524-475x.2000.00238.x. [DOI] [PubMed] [Google Scholar]
- Ridley AJ, Hall A. The small GTP-binding protein rho regulates the assembly of focal adhesions and actin stress fibers in response to growth factors. Cell. 1992;70(3):389–399. doi: 10.1016/0092-8674(92)90163-7. [DOI] [PubMed] [Google Scholar]
- Ridley AJ, Paterson HF, Johnston CL, Diekmann D, Hall A. The small GTP-binding protein rac regulates growth factor-induced membrane ruffling. Cell. 1992;70(3):401–410. doi: 10.1016/0092-8674(92)90164-8. [DOI] [PubMed] [Google Scholar]
- Schleip R, Klingler W, Lehmann-Horn F. Active fascial contractility: Fascia may be able to contract in a smooth muscle-like manner and thereby influence musculoskeletal dynamics. Med Hypotheses. 2005;65(2):273–277. doi: 10.1016/j.mehy.2005.03.005. [DOI] [PubMed] [Google Scholar]
- Schwartz MA, Horwitz AR. Integrating adhesion, protrusion, and contraction during cell migration. Cell. 2006;125(7):1223–1225. doi: 10.1016/j.cell.2006.06.015. [DOI] [PubMed] [Google Scholar]
- Silver FH, Siperko LM, Seehra GP. Mechanobiology of force transduction in dermal tissue. Skin Res Technol. 2003;9(1):3–23. doi: 10.1034/j.1600-0846.2003.00358.x. [DOI] [PubMed] [Google Scholar]
- Tomasek JJ, Haaksma CJ, Eddy RJ, Vaughan MB. Fibroblast contraction occurs on release of tension in attached collagen lattices: dependency on an organized actin cytoskeleton and serum. Anat Rec. 1992;232(3):359–368. doi: 10.1002/ar.1092320305. [DOI] [PubMed] [Google Scholar]
- Walbeehm ET, Afoke A, de Wit T, Holman F, Hovius SE, Brown RA. Mechanical functioning of peripheral nerves: linkage with the "mushrooming" effect. Cell Tissue Res. 2004;16(1):115–121. doi: 10.1007/s00441-004-0867-9. [DOI] [PubMed] [Google Scholar]
- Wang YL. Flux at focal adhesions: slippage clutch, mechanical gauge, or signal depot. Sci STKE. 2007;2007(377):pe10. doi: 10.1126/stke.3772007pe10. [DOI] [PubMed] [Google Scholar]
- Yucesoy CA, Huijing PA. Substantial effects of epimuscular myofascial force transmission on muscular mechanics have major implications on spastic muscle and remedial surgery. J Electromyogr Kinesiol. 2007;17(6):664–679. doi: 10.1016/j.jelekin.2007.02.008. [DOI] [PubMed] [Google Scholar]


