

Abstract
Fluorescence intensity changes were investigated theoretically and experimentally using self-assembled colloidal structures on silver semitransparent mirrors. Using a simplified quasi-static model and finite element method, we demonstrate that near-field interactions of metallic nanostructures with a continuous metallic surface create conditions that produce enormously enhanced surface plasmon resonances. The results were used to explain the observed enhancements and determine the optimal conditions for the experiment. The theoretical parts of the studies are supported with reports on detailed emission intensity changes which provided multiple fluorescence hot spots with 2–3 orders of enhancements. We study two kinds of the fluorophores: dye molecules and fluorescent nanospheres characterized with similar spectral emission regions. Using a lifetime-resolved fluorescence/reflection confocal microscopy technique, we find that the largest rate for enhancement (~1000-fold) comes from localized areas of silver nanostructures.
Keywords: plasmonic platform, photonics, metal-enhanced fluorescence, fluorescence lifetime imaging
1 INTRODUCTION
Fluorescence is among the most sensitive technologies, routinely reaching toward single molecule level detection. Nevertheless, further improvements in sensitivity are needed to allow for practical applications of single molecule-based studies and enable precise detection of minimal traces of chemicals and analytes. For the last ten years significant attention has been focused on the application of metallic nanostructures to surface enhanced optical detection. The unique photonic properties of metallic nanostructures [1, 2] have presented researchers with novel possibilities for constructing nanophotonic devices for high-speed electronics [3–5], imaging labels [6–8], and chemical and biochemical sensing [9–16]. Numerous silver and gold structures have been tried for surface enhanced Raman spectroscopy (SERS) and metal enhanced fluorescence (MEF). Some structures exhibit incredible SERS signal enhancement up to 1014 [17–19], however, observed enhancements of the fluorescence signal have been typically below 20-fold [20–23]. This is due to metal quenching of electronically excited fluorophores positioned close to the metallic surface or particles [24]; a quenching effect that does not occur in Raman scattering. It is now known that the enhancement strongly depends on the structure’s morphology (shape, size) and distance of the chromospheres from the metallic structure. The observed fluorescence enhancement is the result of the concerted effects of (1) strong electric field induced at specific locations (usually called hot spots or lightning rod effect [18, 19, 25, 26]); (2) fluorescence quantum yield enhancement and shortening of fluorescence lifetime, due to the change in the radiative rate, an effect called radiative decay engineering (RDE); and (3) the negative effect of fluorescence quenching by metallic structures [26, 27].
A number of very promising silver structures like silver island films (SIFs) [27, 28], surface deposited colloids [29, 30], nanoshells [31], and fractal-like shapes [32, 33] have been tested for fluorescence enhancement. Most of these structures show 10- to 50-fold fluorescence signal enhancement, which is crucial for many assays applications [34].
Herein we introduce a novel structural platform composed of self-assembled colloidal structures deposited over thin metal film. By evaporating colloid solution on a thin metallic surface we create unique conditions where colloidal assemblies are localized in subwavelength distance from thin continuous metallic surface (of thickness that facilitate travelling surface plasmons as routinely used for SPR experiments—typically ~50 nm for gold and silver). Developed surfaces for the first time produce a well defined, highly reproducible, fluorescence enhancement of 2–3 orders of magnitude. Such a platform can be easily and repetitively fabricated by just pouring silver colloid solution onto a metallic surface and drying. By slow drying we are allowing for the formation of structures of various shapes and size over the conductive metal surface. The enormous observed enhancement is a result of a resonance interaction of localized surface plasmons in metallic nanoparticles with propagating surface plasmons polaritons (SPP) induced in the metal film through the near-field interactions.
2 MATERIALS AND METHODS
2.1 Materials
Silver nitrate, sodium citrate and poly (vinyl) alcohol (PVA) 99+% (Mw=9000–13,000) were purchased from Sigma Aldrich. Rhodamine B (RhB) was obtained from Lambda-Physics, Ft. Lauderdale, Florida. Fluorescent FluoSpheres (carboxylate-modified microspheres, 0.02 μm, 535/575 nm, were purchased from Invitrogen (Eugene, Oregon, USA). All reagents were used without further purification. The Milli-Q grade water (Milli-Q Synthesis A10, Millipore) was used for all solution preparation throughout all the experiments. The 50-nm-thick silver mirrors with 5-nm SiO2 layers were purchased from EMF, Itaca, New York.
2.2 Methods
2.2.1 Colloids preparation
Colloids were prepared according to the developed procedure presented earlier [24]. Briefly, the trisodium citrate (2 ml at 34 mM) was added dropwise to a stirred solution of AgNO3 (100 ml at 1 mM) at 90°C. The reaction mixture was heated to 90–95°C, and stirring was continued for 15 min or until the reaction mixture turned pale yellow. The resulting mixture was then incubated in an ice bath for 15–20 min. The colloids were then purified by centrifugation at 3500 rpm for 8 min; the precipitate was then suspended in 1 ml of 1 mM trisodium citrate.
2.2.2 Preparation of plasmonic platforms
Glass slides (25 × 75 mm) were coated with silver films (50 nm thick) and protected with a 5nm SiO2 layer. The silica protected metallic side was then coated with self-assembled colloidal nanostructures by an evaporation of silver colloid solution on the slide area. The principles of forming self-assembled nanostructures were described earlier [35–37]. The entire surface of the slide was then covered with the mixture of the dye (or fluorescence microspheres) with 0.2% PVA. The mixtures were spin-coated onto self-assembled structures at 3000 rpm for 120 s and dried. Suitable references (the same concentrations of the dye, fluorescent nanospheres and the PVA only) were spin-coated on glass and metallic semitransparent mirrors for further enhancement rate analysis.
2.2.3 Scanning and transition electron microscopy measurements
The Scanning Electron Microscopy (SEM) method was used to study the morphology of self-assembled silver nanostructures. The Joel JSM-6510LV microscope from Joel Ltd., Japan, was applied for this purpose. The JSM-6510LV provides high clarity of the finest structures with a very high resolution of 3.0 nm at 15 kV. The SEM was used at high vacuum conditions.
Samples for transmission electron microscopy (TEM) were examined using a Zeiss EM910 microscope operated with accelerating voltage of 100 keV. A drops of silver nanoparticle suspension was allowed to settle for 2 min on a 200-mesh Formvar/carbon-coated nickel grid (Ted Pella, Inc.) before the liquid drop was carefully removed with a piece of filter paper. The sample was subsequently left to dry completely before carrying out the measurements. Images were taken at 100000× magnification.
2.2.4 Microscopy imaging
Precise fluorescence intensity and lifetime tracking was performed on a laser scanning microscope MicroTime 200 (PicoQuant, GmbH). Pulsed laser 532 nm (Time-Bandwidth) was used as the excitation source working at a frequency of 20 MHz. The beam was coupled to the single-mode fiber and directed to the microscope objective from a dichroic beamsplitter (FF552-Di01, Semrock). The laser light was focused on a dye-plasmonic platform layer by Olympus 60× UPlanApo water immersed, objective infinity corrected (1.2 numerical aperture). The excitation intensity was equal to 0.2 μW. The plasmonic platform was mounted upside down on the cover slip in the holder and operated by a stage piezo-scanner. The scanning system was build around an inverted IX 71 microscope (Olympus). Fluorescence light was gathered with the same objective and transmitted through the beamsplitter and notch filter (StopLine NF03-532E-25, Semrock) to separate excitation and emitted light. The fluorescence was detected applying time-correlated single-photon counting (TCSPC) method. The data was stored in the time-tagged time-resolved mode (TTTR), which allows us to record every detected photon with its individual timing and detection channel information. The presented measurement was performed for 30×30 μm areas with 300×300 pixels resolution and total acquisition time for one pixel 0.6 ms. The complete temporal resolution of the system, the so-called instrument response function (IRF) was measured and used to characterize the laser shape. The fluorescence was focused onto the photosensitive area of an avalanche photodiode (APD, SPCM-AQR-14). The signals were processed by a PicoHarp 300 module and a SymPhotime v. 5.0 (PicoQuant, GmbH) software package was used to analyze the data.
2.2.5 Steady state spectroscopy
The absorption spectrum of silver colloids was collected with a Varian Inc. Cary 50 Bio spectrometer. For microscale emission studies an Ocean Optics 2000 spectrophotometer connected to the exit port of the MicroTime 200 confocal system through the optical fiber accessory was used. The laser excitation at 532 nm and 30 μm diameter pinhole was used for measurements. Using the same objective and optical alignment as for microscopy studies, it was possible to gather emission spectra from several locations of the image. The spectra were taken from places characterized with very high and low fluorescence intensities. The size of the confocal spot was estimated via raster x-y lateral scanning of sub resolution fluorescence beads. The measurements yielded with average lateral 1/e2 radius of confocal volume of 0.31±0.02 μm.
3 RESULTS AND DISCUSSION
3.1 Experiments
Figure 1a presents the high-resolution TEM image of colloid captured at 100 keV accelerating voltage. The figure shows only representative area, but for the purpose of the shape analysis entire sets were collected. The surface reveals a spread in spherical colloid size from 20 to 80 nm. Most of the particles have an oval shape, but a considerable number of them reveal an aspect ratio. In next step, the colloid extinction spectrum was measured. Accordingly, this spectrum clearly displays a rather complex band centered at 440 nm, which can be assigned to the presence of the particles with a small aspect ratio [38–42].
Fig. 1.

(a) The TEM image of silver nanoparticles in colloid. (b) Extinction spectrum of the silver colloid. The shape of the spectrum is characteristic for rather small, not elongated colloids.
It was expected that self-assembled silver aggregates formed by slow drying may produce nanostructures of various shapes. In fact, SEM studies confirmed (3300 and 6000 magnification, Fig. 2, left) that slowly drying colloid may form pyramid-like structures of various sizes. The substrate containing silver nanostructures formed on a conductive surface was named a “plasmonic platform” (Fig. 2, right). To identify the impact of such platforms on fluorescence we performed fluorescence microscopy experiments and appropriate theoretical calculations.
Fig. 2.
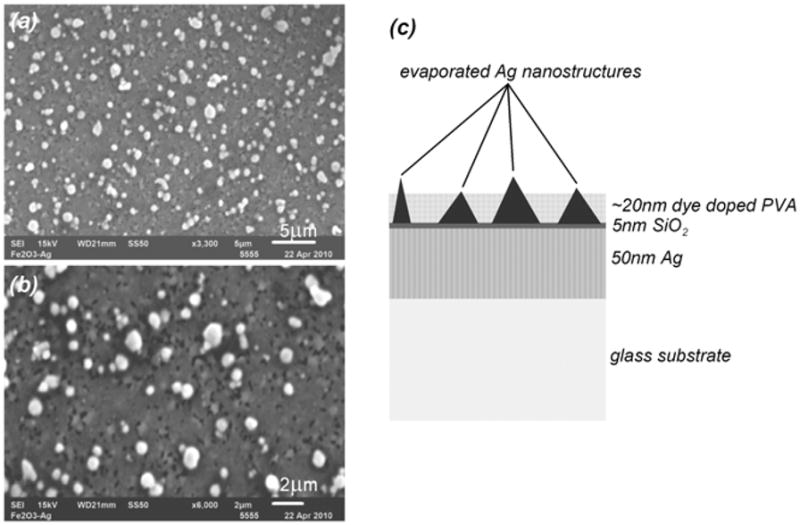
Left: SEM measurements performed on a plasmonic platform which shows the diversity of structures of self assembled colloid formed after drying. The image was taken with magnification of 3300× (a) and 6000× (b). Right: a schematic of plasmonic platform.
The fluorescence signal enhancement was tested using a dye and small fluorescent nanospheres. They were chosen intentionally from the orange-red spectral region which is very popular in present biospectroscopy. The dye/nanospheres were dissolved in a 0.2% PVA solution and spin-coated directly on the plasmonic platforms. To evaluate fluorescence enhancements on plasmonic platforms we measured images in both fluorescence and back-reflected modes. Using 532-nm excitation, selected regions of the plasmonic platforms were imaged with a combination of a 532 notch and razor edge long-wave pass filters (Shamrock) on the observation. Next, exactly the same region was scanned without filters to observe scattered/back-reflected light. Figure 3 and Fig. 4 present data for RhB and 24-nm fluorescent nanospheres, respectively. As expected, most of the highly luminescent spots were located at the areas of the black spots of back-reflected image representing positions of aggregated silver particles. The emission signals shown in the (b) panels of those figures varied significantly across the plasmonic platform surfaces. This phenomenon was attributed to the fact that a concerted interaction of localized and traveling plasmons creates “hot spots.” These “hot spots” can be correlated with the silver nanostructures recorded in panels (a). For the purpose of a better visualization and identification of the “hot spots,” the back-reflected and fluorescence images were marked with blue arrows. The distributions of the emission intensities along the arrows are presented in Figs. 5 and 6 for plasmonic platforms and controls. All the strongest fluorescence spots (white color on (b) panels) could be clearly identified as coming from silver prism-like self-organizations.
Fig. 3.

30×30 μm laser scanning confocal microscope images: (a) scattered/back-reflected intensity coming from plasmonic platforms (PP). Black spots are pyramid-like silver nanostructures; (b) fluorescence intensity image recorded for RhB spin-coated on PP. (c) Fluorescence intensity image recorded for the dye on clean glass slide; and (d) fluorescence image recorded on a 50-nm-thick silver mirror. For all the measurements, 532-nm laser light was used with an intensity of 0.2 μW.
Fig. 4.

30×30μm laser scanning confocal microscope images. The images present: (a) scattered/back reflected intensity coming from plasmonic platforms (PP); (b) fluorescence intensity image recorded for fluorescence nanospheres spin-coated on PP; (c) fluorescence intensity image recorded for the nanospheres on a clean glass slide; and (d) on a 50-nm-thick silver mirror. Data received using 532-nm laser light and 0.2-μW intensity.
Fig. 5.

Fluorescence intensity changes recorded along the blue arrow marked on Fig. 3. The data were taken with confocal microscope for rhodamine B (RhB) in 0.2% PVA spin-coated on plasmonic platforms (a), silver mirror (b) and glass (c). Emission was gathered using a 0.5-μW intensity 532-nm laser.
Fig. 6.

Fluorescence intensity changes recorded along the blue arrow marked on Fig. 4. The data were taken with confocal microscope for fluorescence nanospheres (24 nm) in 0.2% PVA spin-coated on plasmonic platforms (a), 50-nm-thick silver mirror (b) and glass (c). Emission was gathered using a 0.5-μW intensity 532-nm laser.
It should be noted that spin-coating depositions on glass and plain 50-nm-thick silver mirror slides resulted in very homogeneous distribution of dyes/nanospheres (see Fig. 3 and Fig. 4, panels (c) and (d) and Figs. 5 and 6, panels (b) and (c)).
The average intensity of RhB on plasmonic platform is only about 50-fold higher than on the glass substrate. However, in the “hot spots,” the brightness on the plasmonic platform is more than 200-fold higher (Fig. 5). We compared five different areas of plasmonic platforms and glass and the results were very consistent.
In general, the exact position of the hot spots can be easily located. Figure 6 shows intensity changes measured along the arrows for the fluorescent nanospheres on plasmonic platform, glass and 50-nm-thick silver mirror. Each pixel on the image generally showed different values of intensity. One can see local extreme jumps of the emission on plasmonic platforms and very low intensity signal (almost constant value) recorded for the glass and the silver mirror. We noticed that nanospheres deposited on the glass and the silver mirror have almost the same emission intensity. This observation is in contradiction to experiments with deposition of the dye on the same surfaces. One can easily see the difference in signal intensity from panels (c) and (d) of the Fig. 3. The twofold intensity drop can be read if we compare emission traces of the dye on the glass and 50-nm silver mirror. The explanation for the difference is that the dye on the silver mirror undergoes strong quenching at very close proximity to the surface. As is already known, at the distance below 40 Å the silver surface strongly quenches the emission [27, 43]. In the case of nanospheres deposited on the silver mirror, only a small fraction of dye molecules (those within 4 nm from the surface) are being quenched. Even if a few molecules can undergo quenching, it does not significantly change the observed emission intensity.
According to recent reports, a strong local electromagnetic field can perturb electronic levels of molecules [44–46]. We measured emission spectra from points on microscopic images characterized by very high and low degrees of enhancement. An Ocean Optic high-sensitivity spectrometer was used in an extra MT200 port on the observation path. The results for RhB are presented on Fig. 7 and for fluorescence nanospheres on Fig. 8. Interestingly, the field effect on RhB fluorescence is stronger than measured for nanospheres. In the case of nanospheres, not all fluorophores are exposed to the strongest local field. RhB dye emission spectrum is 10-nm blue shifted if measured for bright spots (high electromagnetic field) in comparison to the spectrum recorded for points without the effect of enhancement. In the case of nanospheres, not much change was observed in the position of the emission spectra.
Fig. 7.

Normalized emission spectra of rhodamine B-doped PVA taken directly from the microscope. Continuous line presents spectrum representing bright spots on plasmonic platforms, dashed line describe spectral properties of dark spots (see Fig 3b).
Fig. 8.

Normalized emission spectra of 24-nm fluorescence nanospheres doped PVA taken directly from the microscope. Continuous line presents spectrum representing bright spots on plasmonic platforms, dashed line describe spectral properties of dark spots (see Fig 4b).
We also measured fluorescence intensity decays (lifetimes) collected in each pixel of the image on plasmonic platforms, glass and 50-nm-thick silver mirrors. Measurements of fluorescence lifetimes are necessary if one wants to distinguish between the effect of local field enhancement (more efficient excitation) and RDE [27, 47]. The continuous line on Fig. 9(a) represents the lifetime histogram of the dye measured on glass. The fluorescence decay curves were satisfactorily fitted using a model with two and three decay times. The lifetime histogram is a result of intensity averaged lifetime τ̄ equal to
Fig. 9.

(a) Intensityaveraged lifetime histogram of the RhB calculated for the images (FLIM) of dye on glass (continuous), silver mirror (dashed) and plasmonic platform (dotted). (b) Fluorescence intensity decays of RhB-doped PVA on plasmonic platform (dark) and on glass (light). Bottom panes present residuals. Excitation 532-nm laser, observation >532 nm.
where are τi decay times and αi are amplitudes.
An average fluorescence lifetime of 3.8 ns was detected for RhB fluorophore. However on the plasmonic platforms the fluorescence lifetime drops to about 1ns confirming that we have significant enhancement of fluorescence signal due to the increase of radiative rate of fluorophore [47]. The lifetime for the dye on the 50-nm-thick silver mirror drops below 0.45 ns, indicating an efficient quenching by the metal at a close approach. Figure 9(b) shows the lifetime decays collected from whole the 30×30 μm area of the dye deposited on plasmonic platform and glass. The fluorescence intensity decay data were best fit with a double exponential function for dye on glass and three exponential for deposition on plasmonic platforms. Decay components are presented in the Table 1. The contributions of decaying components to the total fluorescence intensity are also included in the table. The excellent quality of the fit is demonstrated by a small χ2R value of the fit (the residuals are shown in the bottom figure of the (b) panel).
Table 1.
Multiexponential analysis of the fluorescence intensity decays performed for dye and nanospheres deposition on glass and plasmonic platforms.
| Sample | Substrate | α1 | τ1 [ns] | α 2 | τ2 [ns] | α 3 | τ3 [ns] | τav [ns] | χ2R |
|---|---|---|---|---|---|---|---|---|---|
| RhB | Glass | 0.12 | 5.42 | 0.88 | 3.5 | 3.8 | 0.96 | ||
| Plasmonic platforms | 0.05 | 2.4 | 0.13 | 1.3 | 0.82 | 0.3 | 1.1 | 0.94 | |
| Nanospheres | Glass | 0.36 | 5.9 | 0.64 | 3.8 | 4.7 | 1.21 | ||
| Plasmonic platforms | 0.09 | 5.8 | 0.25 | 2.5 | 0.66 | 0.58 | 3.2 | 1.43 |
We note that less diversity of the average lifetime distribution is characteristic for fluorescence nanospheres (Fig. 10(a)). We examined the lifetime images of these deposited within the silver structures, glass and silver mirror. These results clearly indicate that the fluorescence lifetime for the fluorescence nanospheres deposited over the plasmonic platform is less reduced than a free dye, from about 4.7 ns for glass to 3.2 ns in plasmonic platforms. As expected, fluorescence nanospheres were also less quenched by the silver mirror (4.2 ns).
Fig. 10.

Intensity-averaged lifetime histogram of the fluorescence nanospheres calculated for the images (FLIM) of dye on glass (continuous), 50-nm-thick silver mirror (dashed) and plasmonic platform (dotted). (b) Fluorescence intensity decays of nanospheres doped PVA on plasmonic platform (dark) and on glass (light). Bottom panes present residuals. Excitation 532-nm laser, observation >532 nm.
The results summarized on Fig. 10(b) show that the lifetime of fluorescence nanospheres is similar on plasmonic platforms and on glass (see Table 1). The difference relies on the number of fitting components; three for plasmonic platforms and only two for nanospheres on glass. Decay of the luminescence of nanospheres on glass could be best fit by long (5.9-ns) and shorter (3.8-ns) components, comprising ~36% and ~64% of the total fluorescence intensity, respectively. The data for nanospheres on plasmonic platforms show components: 5.8 ns (0.09), 2.5 ns (0.25) and 0.58 ns (0.66). The average intensity-weighted lifetimes were 4.7 ns and 3.2 ns for beads deposition on glass and plasmonic platforms, respectively.
3.2 Theoretical calculations
To explain the observed enhancements we considered an enhanced local field induced by the incoming light excitation for various shapes of metallic structures when deposited on dielectric (glass) or metallic surface. The field intensity enhancement was calculated for silver nanoparticles in water, above a plane of glass or silver in the Rayleigh limit by using the finite element method (FEM). The outer boundary condition (φ = y in Fig. 11) was set to a potential equal to the height coordinate, which corresponds to a field of unit intensity originating far enough away from the structures. Figure 11 illustrates this principle. The Poisson equation had to be solved with the boundary conditions described above, and the appropriate condition between the metal and water media reads: ∇·ε∇φ = 0. Here, φ is the electric potential, and ε the permittivity of the respective media. The electric field is the negative of the gradient of the potential. The Comsol program “Femlab” was used for the FEM calculations. The calculations were performed in two dimensions: two-dimensional metallic structures (bars) and three-dimensional cylindrically symmetric structures above the metal plane. The surrounding box must be much larger for two-dimensional structures than for three-dimensional structures because of slower decay of the electric field in a two dimensional domain. In that case an ideal boundary should be at infinity. In the three-dimensional case, the field decays as 1/r2 from a point source (charge), while in the two-dimensional as 1/r, where r is the distance from the point source.
Fig. 11.
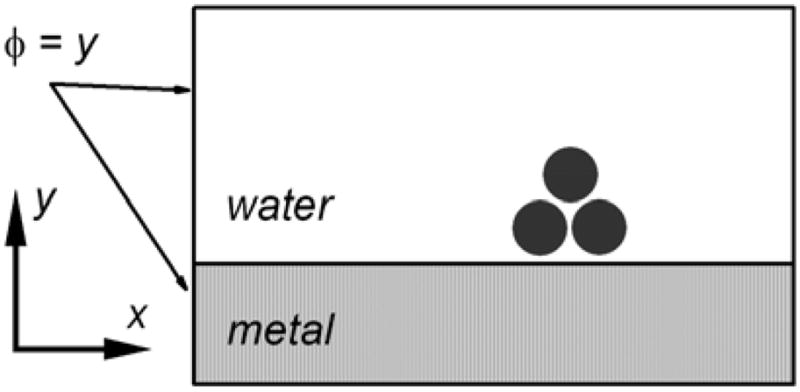
Coordinate system for finite element calculations.
Figure 12 left shows the graphical representation for results of field calculation by simplified quasi-static model and finite element method [17, 19] for the spherical particle positioned close to dielectric surface (glass). The excitation light of 500 nm is coming from the side. Intrinsically, the field enhancement in the proximity of the dielectric surface like glass or silica is exclusively localized on the particle and does not depend much on the separation between particle and the surface. When the same particle is positioned over the metallic surface a strong interaction with the free electrons in the metal film drastically enhances the field near the particle and produces a strongly enhanced field not only between the particle and metal surface but also on the opposite side (top) of particle (Fig. 12 right).
Fig. 12.

Electric field distribution for spherical silver particle positioned over the glass (left) and silver (right). Refractive index of surrounding medium was 1.33 (water).
Earlier studies of SERS indicated that nanostructures with sharp edges deposited on silica (glass) surface induce very high Raman signal enhancement [17–19, 48, 49]. In addition, earlier studies on fluorescence enhancement showed that self-assembled structures induced by electric current (fractal-like) produce spots that have close to 100-fold signal enhancement [32, 33]. To analyze the effect of the shape, we considered different shapes formed from individual particles positioned on glass or silver.
It is expected that self-assembled aggregates formed by slow drying may produce diversely shaped nanostructures and that drying colloids may form elongated and pyramid-like structures of various sizes. To test if forming colloidal clusters has any effect on the observed signal enhancement we modeled structures, as shown in Fig. 13, considering limiting numbers of only 3 or 9 particles. Again we consider an electric field induced by the excitation light (500 nm) when structures are positioned over the glass or metallic surface. The difference between structure positioned on glass (left) and positioned on metal (right) is substantial. The expected enhancement can be very high (much over 1000-fold) and more importantly many local areas between and over particles become very active. There are two effects that together explain the strong influence of the metallic layer. First, a smaller gap between two particles have stronger field enhancement. As is easily seen by scaling in the quasi-static limit larger particles with the same gap also have stronger field enhancement. So, the larger the particles and smaller the gap, the stronger the field enhancement. This can also be intuitively understood by considering that larger particles means larger antennas collecting more radiation and smaller gap means concentrating the energy into a smaller volume. The metal layer, if it is thick enough, can be seen as the surface of a very large particle collecting a great amount of radiation, which is concentrated into the gap between the layer and a particle. This is seen in Fig. 12. Also, the thinner the layer the smaller its collection efficiency, i.e., less field enhancement. Second, the dipolar radiation from the concentration spots interact. If the dipoles are in series and close enough they reinforce each other interactively by adding electric field to each others surroundings, i.e., each others’ collecting antennas. Particles on top of each other above the metal layer have dipoles in series and therefore reinforce each others gap fields. This means that the strong enhancement between the layer and the bottom particles influences the enhancement of the top particles, as is seen in Fig. 13.
Fig. 13.

Electric field distribution in the proximity of colloidal assemblies formed over glass or metallic surface.
We expect that for fluorophores deposited on such structures, or in between structures, field enhancement can be gigantic and would lead to very high fluorescence signal enhancement.
4 CONCLUSIONS
In summary, we reported strong fluorescence enhancements on self-assembled colloidal structures prepared on conductive semitransparent 50-nm-thick silver mirrors. A layer of colloidal nanoparticles was deposited on silver platform where, by self-assembly, they created pyramidal-like structures visualized in SEM images. The theoretical prediction of over 1000-fold enhancement is experimentally demonstrated for a free RhB dye and fluorescent nanospheres.
How can this study be applied? One might imagine sensing devices capable of detecting analytes at 2–3 orders of magnitude lower in concentration. We believe that the proposed method will have an important application in single-molecule detection techniques where the area needed for study is minimized and can be located on “hot spots” alone. The higher brightness of the samples on plasmonic platforms will be accompanied by a superior photostability (the result of a shorter lifetime). We also believe that the observed spectral changes can be used in the future for the estimation of a local enhanced field strength, however, this will require a proper calibration and an adequate theory.
Acknowledgments
This work was supported by NIH R01 grants AR048622 (J.B.), HG004364 (I.G.) and R21CA14989 (Z.G.) and Texas ETF grant (CCFT). We thank Anne-Marie Brun Zinkernagel for collection of TEM images. T.S. was supported by Welch Foundation (BP-0037).
We dedicate this paper to our friend and collaborator—Dr. Evgenia Matveeva on the occasion of her 50-th birthday.
Contributor Information
Rafal Luchowski, Email: rafal.luchowski@unthsc.edu.
Ignacy Gryczynski, Email: ignacy.gryczynski@unthsc.edu.
References
- 1.Fort E, Gresillon S. Surface enhanced fluorescence. J Phys D: Appl Phys. 2008;41:013001. doi: 10.1088/0022-3727/41/1/013001. [DOI] [Google Scholar]
- 2.Kalele SA, Tiwari NR, Gosavi SW, Kulkarni SK. Plasmon-assisted photonics at the nanoscale. J Nanophoton. 2007;1:012501. doi: 10.1117/1.2748429. [DOI] [Google Scholar]
- 3.Atwater HA. The promise of plasmonics. Sci Am. 2007;296:56–63. doi: 10.1038/scientificamerican0407–56. [DOI] [PubMed] [Google Scholar]
- 4.Ozbay E. Plasmonics: merging photonics and electronics at nanoscale dimensions. Science. 2006;311:189–193. doi: 10.1126/science.1114849. [DOI] [PubMed] [Google Scholar]
- 5.Engheta N. Circuits with light at nanoscales: optical nanocircuits inspired by metamaterials. Science. 2007;317:16981702. doi: 10.1126/science.1133268. [DOI] [PubMed] [Google Scholar]
- 6.El-Sayed IH, Huang X, El-Sayed MA. Surface plasmon resonance scattering and absorption of anti-EGFR antibody conjugated gold nanoparticles in cancer diagnostics: applications in oral cancer. Nano Lett. 2005;5:829–834. doi: 10.1021/nl050074e. [DOI] [PubMed] [Google Scholar]
- 7.Loo C, Hirsch L, Lee MH, Chang E, West J, Halas N, Drezek R. Gold nanoshell bioconjugates for molecular imaging in living cells. Opt Lett. 2005;30:1012–1014. doi: 10.1364/OL.30.001012. [DOI] [PubMed] [Google Scholar]
- 8.Sokolov K, Follen M, Aaron J, Pavlova I, Malpica A, Lotan R, Richards-Kortum R. Real-time vital optical imaging of precancer using anti-epidermal growth factor receptor antibodies conjugated to gold nanoparticles. Cancer Res. 2003;63:1999–2004. [PubMed] [Google Scholar]
- 9.Chowdhury MH, Ray K, Gray SK, Pond J, Lakowicz JR. Aluminum nanoparticles as substrates for metal-enhanced fluorescence in the ultraviolet for the label-free detection of biomolecules. Anal Chem. 2009;81:1397–1403. doi: 10.1021/ac802118s. [DOI] [PMC free article] [PubMed] [Google Scholar]
- 10.Elghanian R, Storhoff JJ, Mucic RC, Letsinger RL, Mirkin CA. Selective colorimetric detection of polynucleotides based on the distance-dependent optical properties of gold nanoparticles. Science. 1997;277:1078–1081. doi: 10.1126/science.277.5329.1078. [DOI] [PubMed] [Google Scholar]
- 11.Haes AJ, Hall WP, Chang L, Klein WL, Van Duyne RP. A localized surface plasmon resonance biosensor: first steps toward an assay for Alzheimer’s disease. Nano Lett. 2004;4:1029–1034. doi: 10.1021/nl049670j. [DOI] [Google Scholar]
- 12.Haes AJ, Zou SL, Schatz GC, Van Duyne RP. Nanoscale optical biosensor: short range distance dependence of the localized surface plasmon resonance of noble metal nanoparticles. J Phys Chem B. 2004;108:6961–6968. doi: 10.1021/jp036261n. [DOI] [Google Scholar]
- 13.Matveeva EG, Shtoyko T, Gryczynski I, Akopova I, Gryczynski Z. Fluorescence quenching/enhancement surface assays: signal manipulation using silver-coated gold nanoparticles. Chem Phys Lett. 2008;454:85–90. doi: 10.1016/j.cplett.2008.01.075. [DOI] [PMC free article] [PubMed] [Google Scholar]
- 14.Ramoni R, Staiano M, Bellucci S, Grycznyski I, Grycznyski Z, Crescenzo R, Iozzino L, Bharill S, Conti V, Grolli S, D’Auria S. Carbon nanotube-based biosensors. J Phys Condens Matter. 2008;20:474201. doi: 10.1088/0953–8984/20/47/474201. [DOI] [Google Scholar]
- 15.Abdulhalim I, Karabchevsky A, Patzig C, Rauschenbach B, Fuhrmann B, Eltzov E, Marks R, Xu J, Zhang F, Lakhtakia A. Surface enhanced fluorescence from metal sculptured thin films with application to biosensing in water. Appl Phys Lett. 2009;94:063206. doi: 10.1063/1.3081031. [DOI] [Google Scholar]
- 16.Abdulhalim I, Karabchevsky A, Patzig C, Rauschenbach B, Fuhrmann B. Comparative study of enhanced fluorescence from nano sculptured thin films. Proc SPIE. 2008;7041:70410G. doi: 10.1117/12.795139. [DOI] [Google Scholar]
- 17.Camden JP, Dieringer JA, Wang YM, Masiello DJ, Marks LD, Schatz GC, Van Duyne RP. Probing the structure of single-molecule surface-enhanced Raman scattering hot spots. J Am Chem Soc. 2008;130:12616. doi: 10.1021/ja8051427. [DOI] [PubMed] [Google Scholar]
- 18.Kneipp K, Kneipp H, Itzkan I, Dasari RR, Feld MS. Surface-enhanced Raman scattering: A new tool for biomedical spectroscopy. Curr Sci. 1999;77:915–924. [Google Scholar]
- 19.McMahon JM, Henry AI, Wustholz KL, Natan MJ, Freeman G, Van Duyne RP, Schatz GC. Gold nanoparticle dimer plasmonics: finite element method calculations of the electromagnetic enhancement to surface-enhanced Raman spectroscopy. Anal Bioanal Chem. 2009;394:1819–1825. doi: 10.1007/s00216-009-2738-4. [DOI] [PubMed] [Google Scholar]
- 20.Aslan K, Gryczynski I, Malicka J, Matveeva E, Lakowicz JR, Geddes CD. Metal-enhanced fluorescence: an emerging tool in biotechnology. Curr Opin Biotechnol. 2005;16:55–62. doi: 10.1016/j.copbio.2005.01.001. [DOI] [PMC free article] [PubMed] [Google Scholar]
- 21.Fu Y, Zhang J, Lakowicz JR. Silver-enhanced fluorescence emission of single quantum dot nanocomposites. Chem Commun. 2009:313–315. doi: 10.1039/b816736b. [DOI] [PMC free article] [PubMed] [Google Scholar]
- 22.Goldys EM, Barnett A, Xie F, Drozdowicz-Tomsia K, Gryczynski I, Matveeva EG, Gryczynski Z, Shtoyko T. Plasmon-enhanced fluorescence near metallic nanostructures: biochemical applications. Appl Phys A. 2007;89:265–271. doi: 10.1007/s00339-007-4100-z. [DOI] [Google Scholar]
- 23.Gryczynski I, Matveeva EG, Sarkar P, Bharill S, Borejdo J, Mandecki W, Akopova I, Gryczynski Z. Metal enhanced fluorescence on silicon wafer substrates. Chem Phys Lett. 2008;462:327–330. doi: 10.1016/j.cplett.2008.08.008. [DOI] [PMC free article] [PubMed] [Google Scholar]
- 24.Chance RR, Prock A, Silbey R. Molecular fluorescence and energy transfer near interfaces. Adv Chem Phys. 1978;37:1–65. doi: 10.1002/9780470142561.ch1. [DOI] [Google Scholar]
- 25.Le F, Brandl DW, Urzhumov YA, Wang H, Kundu J, Halas NJ, Aizpurua J, Nordlander P. Metallic nanoparticle arrays: A common substrate for both surface-enhanced Raman scattering and surface-enhanced infrared absorption. ACS Nano. 2008;2:707–718. doi: 10.1021/nn800047e. [DOI] [PubMed] [Google Scholar]
- 26.Zavelani-Rossi M, Celebrano M, Biagioni P, Polli D, Finazzi M, Duo L, Cerullo G, Labardi M, Allegrini M, Grand J, Adam PM. Near-field second-harmonic generation in single gold nanoparticles. Appl Phys Lett. 2008;92 doi: 10.1063/1.2889450. [DOI] [PubMed] [Google Scholar]
- 27.Malicka J, Gryczynski I, Gryczynski Z, Lakowicz JR. Effects of fluorophore-to-silver distance on the emission of cyanine-dye-labeled oligonucleotides. Anal Biochem. 2003;315:57–66. doi: 10.1016/S0003-2697(02)00702-9. [DOI] [PMC free article] [PubMed] [Google Scholar]
- 28.Lakowicz JR, Malicka J, D’Auria S, Gryczynski I. Release of the self-quenching of fluorescence near silver metallic surfaces. Anal Biochem. 2003;320:13–20. doi: 10.1016/S0003-2697(03)00351-8. [DOI] [PMC free article] [PubMed] [Google Scholar]
- 29.Lukomska J, Gryczynski I, Malicka J, Makowiec S, Lakowicz JR, Gryczynski Z. One- and two-photon induced fluorescence of pacific blue-labeled human serum albumin deposited on different core size silver colloids. Biopolymers. 2006;81:249–255. doi: 10.1002/bip.20407. [DOI] [PMC free article] [PubMed] [Google Scholar]
- 30.Muthu P, Calander N, Gryczynski I, Gryczynski Z, Talent JM, Shtoyko T, Akopova I, Borejdo J. Monolayers of silver nanoparticles decrease photobleaching: application to muscle myofibrils. Biophys J. 2008;95:3429–3438. doi: 10.1529/biophysj.108.130799. [DOI] [PMC free article] [PubMed] [Google Scholar]
- 31.Zhang J, Gryczynski I, Gryczynski Z, Lakowicz JR. Dye-labeled silver nanoshell-bright particle. J Phys Chem B. 2006;110:8986–8991. doi: 10.1021/jp057032z. [DOI] [PMC free article] [PubMed] [Google Scholar]
- 32.Goldys EM, Drozdowicz-Tomsia K, Xie F, Shtoyko T, Matveeva E, Gryczynski I, Gryczynski Z. Fluorescence amplification by electrochemically deposited silver nanowires with fractal architecture. J Am Chem Soc. 2007;129:12117–12122. doi: 10.1021/ja071981j. [DOI] [PubMed] [Google Scholar]
- 33.Shtoyko T, Matveeva EG, Chang IF, Gryczynski Z, Goldys E, Gryczynski I. Enhanced fluorescent immunoassays on silver fractal-like structures. Anal Chem. 2008;80:1962–1966. doi: 10.1021/ac7019915. [DOI] [PMC free article] [PubMed] [Google Scholar]
- 34.Matveeva E, Gryczynski Z, Malicka J, Gryczynski I, Lakowicz JR. Metal-enhanced fluorescence immunoassays using total internal reflection and silver island-coated surfaces. Anal Biochem. 2004;334:303–311. doi: 10.1016/j.ab.2004.08.034. [DOI] [PMC free article] [PubMed] [Google Scholar]
- 35.Ge G, Brus LE. Evidence for spinodal phase separation in two-dimensional nanocrystal self-assembly. J Phys Chem B. 2000;104:9573–9579. doi: 10.1021/jp002280a. [DOI] [Google Scholar]
- 36.Orendorff CJ, Gole A, Sau TK, Murphy CJ. Surface-enhanced Raman spectroscopy of self-assembled monolayers: sandwich architecture and nanoparticle shape dependence. Anal Chem. 2005;77:3261–3266. doi: 10.1021/ac048176x. [DOI] [PubMed] [Google Scholar]
- 37.Rabani E, Reichman DR, Geissler PL, Brus LE. Drying-mediated self-assembly of nanoparticles. Nature. 2003;426:271–274. doi: 10.1038/nature02087. [DOI] [PubMed] [Google Scholar]
- 38.Alekseeva AV, Bogatyrev VA, Dykman LA, Khlebtsov BN, Trachuk LA, Melnikov AG, Khlebtsov NG. Preparation and optical scattering characterization of gold nanorods and their application to a dot-immunogold assay. Appl Opt. 2005;44:6285–6295. doi: 10.1364/AO.44.006285. [DOI] [PubMed] [Google Scholar]
- 39.Calander N, Gryczynski I, Gryczynski Z. Interference of surface plasmon resonances causes enhanced depolarized light scattering from metal nanoparticles. Chem Phys Lett. 2007;434:326–330. doi: 10.1016/j.cplett.2006.12.003. [DOI] [PMC free article] [PubMed] [Google Scholar]
- 40.Khlebtsov NG, Melnikov AG, Bogatyrev VA, Dykman LA, Alekseeva AV, Trachuk LA, Khlebtsov BN. Can the light scattering depolarization ratio of small particles be greater than 1/3? J Phys Chem B. 2005;109:13578–13584. doi: 10.1021/jp0521095. [DOI] [PubMed] [Google Scholar]
- 41.Klitgaard S, Shtoyko T, Calander N, Gryczynski I, Matveeva EG, Borejdo J, Neves-Petersen MT, Petersen SB, Gryczynski Z. Long wavelength depolarized light scattering from silver nanoparticles. Chem Phys Lett. 2007;443:1–5. doi: 10.1016/j.cplett.2007.06.041. [DOI] [Google Scholar]
- 42.Moskovits M. Surface-enhanced spectroscopy. Rev Mod Phys. 1985;57:783–826. doi: 10.1103/RevModPhys.57.783. [DOI] [Google Scholar]
- 43.Sokolov K, Chumanov G, Cotton TM. Enhancement of molecular fluorescence near the surface of colloidal metal films. Anal Chem. 1998;70:3898–3905. doi: 10.1021/ac9712310. [DOI] [PubMed] [Google Scholar]
- 44.Chizhik A, Schleifenbaum F, Gutbrod R, Khoptyar D, Meixner AJ, Enderlein J. Tuning the fluorescence emission spectra of a single molecule with a variable optical subwavelength metal microcavity. Phys Rev Lett. 2009;102:073002. doi: 10.1103/PhysRevLett.102.073002. [DOI] [PubMed] [Google Scholar]
- 45.Enderlein J. Spectral properties of a fluorescing molecule within a spherical metallic nanocavityy. Phys Chem Chem Phys. 2002;4:2780–2786. doi: 10.1039/b200502f. [DOI] [Google Scholar]
- 46.Steiner M, Schleifenbaum F, Stupperich C, Failla AV, Hartschuh A, Meixner AJ. Microcavity-controlled single-molecule fluorescence. Chem Phys Chem. 2005;6:2190–2196. doi: 10.1002/cphc.200500108. [DOI] [PubMed] [Google Scholar]
- 47.Lakowicz JR. Principles of Fluorescence Spectroscopy. Springer; New York: 2003. Radiative decay engineering: metal enhanced fluorescence; pp. 841–859. [Google Scholar]
- 48.Cade NI, Ritman-Meer T, Kwakwa KA, Richards D. The plasmonic engineering of metal nanoparticles for enhanced fluorescence and Raman scattering. Nanotechnol. 2009;20:285201. doi: 10.1088/0957-4484/20/28/285201. [DOI] [PubMed] [Google Scholar]
- 49.Gryczynski I, Malicka J, Nowaczyk K, Gryczynski Z, Lakowicz JR. Waveguide-modulated surface plasmon-coupled emission of Nile blue in poly(vinyl alcohol) thin films. Thin Solid Films. 2006;510:15–20. doi: 10.1016/j.tsf.2005.07.312. [DOI] [PMC free article] [PubMed] [Google Scholar]