Abstract
Objective
We investigated whether Disability Evaluation (DE) situations influence patients' neuropsychological test performances and psychopathological characteristics and which variable play a role to establish an explanation model using statistical analysis.
Methods
Patients were 536 (56.6%) brain-injured persons who met inclusion and exclusion criteria, classified into the DE group (DE; n = 300, 56.0%) and the non-DE group (NDE; n = 236, 44.0%) according to the neuropsychological testing's purpose. Next, we classified DE subjects into DE cluster 1 (DEC1; 91, 17.0%), DE cluster 2 (DEC2; 125; 23.3%), and DE cluster 3 (DEC3; 84, 15.7%) via two-step cluster analysis, to specify DE characteristics. All patients completed the K-WAIS, K-MAS, K-BNT, SCL-90-R, and MMPI.
Results
In comparisons between DE and NDE, the DE group showed lower intelligence quotients and more severe psychopathologic symptoms, as evaluated by the SCL-90-R and MMPI, than the NDE group did. When comparing the intelligence among the DE groups and NDE group, DEC1 group performed worst on intelligence and memory and had most severe psychopathologic symptoms than the NDE group did. The DEC2 group showed modest performance increase over the DEC1 and DEC3, similar to the NDE group. Paradoxically, the DEC3 group performed better than the NDE group did on all variables.
Conclusion
The DE group showed minimal "faking bad" patterns. When we divided the DE group into three groups, the DEC1 group showed typical malingering patterns, the DEC2 group showed passive malingering patterns, and the DEC3 group suggested denial of symptoms and resistance to treatment.
Keywords: Disability evaluation, Brain injury, Malingering
INTRODUCTION
Given the proven growth of legal applications for neurosurgery and neuropsychology, it logically follows that neurosurgeons and neuropsychologists have increased personal interactions with agents of the legal system. These interactions can have many positive consequences, including enhanced income, interprofessional understanding, and research opportunities45). However, there can also be negative consequences. With increasing industrial development, increases in accidents and calamities can give rise to complications and conflicts, and these are as great a burden to a neurosurgeon as is the disability evaluation (DE) itself. Such complications include the necessity of clarifying the interactions between cause and effect, the public scrutiny of cherished beliefs, and, worst of all, an erroneous DE24).
Predicting the outcome of a brain injury entails a most complicated process. It is as important to note discrepancies between predictions and reality as it is to document general trends, and exceptions to these general trends occur at all points along the severity continuum27). Thus, patients whose injuries seem mild, as measured by most accepted methods, may have relatively poor outcomes, both cognitively and socially. Conversely, certain other patients, classified as moderately to severely injured, have enjoyed surprisingly good outcomes9,27,31,39). Brain injury DE is a scientific and medical decision-making process, but a scientist must engage in fair, impartial, public decision-making and accept the legal responsibility pertaining thereunto. Brain injured patients and their families may have external incentives, such as financial compensation and placement of legal responsibility, to create malingered or factitious symptoms. Malingered neurocognitive dysfunction (MND) in brain injury patients is characterized by an external incentive to malinger and a definite negative response bias. MND can be categorized into definite, probable, and possible MND37). However, these MND categories for diagnosing "malingering" are not aways acceptable. Although over 300 publications on this topic have appeared, these issues are still controversial. Brain imaging data or other physiological evaluations may explicate these categories4). The limited information on the neurocognitive functions of brain injury patients is another problem with the DE process. With forensic patients, in particular, it is essential to use formal, officially approved, and published standard tests. Assessment of this group of patients through the use of a theoretical experimental paradigm may lead to scientific argument and disagreement, and could be the cause of other complications17).
These problems and complications of the DE process cannot be helped in some situations and can result in a dilemma. Solutions for these problems depend on knowledge, rather than learning, on personal experience, and on the neurosurgeon's conscience. In this study, we sought to understand the conscious and unconscious mechanisms of latent external incentives in forensic patients with brain injuries. Therefore, we investigated whether DE situations influence patients' neuropsychological test performances and psychopathological characteristics and sought a variable that could establish an explanation model, using statistical analyses and controlling for medical treatment progresses and demographical factors.
MATERIALS AND METHODS
Subject selection, classification, and verification procedures
Initial participants were 947 patients, from 18 to 80 years old, who received hospital or ambulant treatment for a brain injury from July 1998 to May 2009. After excluding patients who had a neurological abnormality before their brain injury, a secondary head trauma, psychiatric disease, mental retardation, or a history of a chronic disease for the preceding 6 months, as well as those who did not complete the neuropsychological tests due to serious brain damage, we had 536 participants.
We classified subjects into either the disability evaluation group (DE; n = 300; 56.0%) or the non-disability evaluation group (NDE; n = 236; 44.0%) according to the purpose of the neuropsychological testing they had received. For the DE group, the purpose of the neuropsychological tests was disability evaluation. The NDE group had undergone neuropsychological testing for treatment only, but they would undergo neuropsychological tests for disability evaluation in the future.
Subsequently, we classified patients into DE cluster 1 (DEC1), DE cluster 2 (DEC2), and DE cluster 3 (DEC3), via two-step cluster analysis using 3 intelligence scores, 4 memory indexes, validity and clinical scales in MMPI and SCL-90-R, to specify the characteristics of this group. There were 91 patients (17.0%) in DEC1, 125 patients (23.3%) in DEC2, 84 patients (15.7%) in DEC3, and 236 patients (44.0%) in NDE.
Materials
Korean Wechsler Adult Intelligence Scale40,44)
The K-WAIS is a psychometric instrument for assessing potential ability to perform purposeful behavior, using standardized questions and tasks. It consists of 6 verbal and 5 performance tests.
Korean Memory Assessment Scale22,42)
The MAS is a comprehensive, standardized memory assessment battery, designed to fulfill ordinary clinical assessment needs in a manner suitable for various kinds of clinical situations and demands27). Williams42) developed the original version of the MAS, and Lee, Park, An, Kim, & Jeung22) performed a validation study of this Korean version of the MAS (K-MAS).
Korean Boston Naming Test3,16)
The KBNT was developed as a way of measuring naming ability, making a distinctive diagnosis of patient dementia, and tracing a disease progress by discriminating patients with severe aphasia.
Symptom Checklist-90-revised7,14)
The SCL-90-R is a self-report symptom inventory. It can be used as primary tool to select patients who need professional help.
Minnesota Multiphasic Personality Inventory18)
The MMPI is an instrument for objectively measuring abnormal behavior. It is one of the tests widely used to assess mental functioning and personality in brain injured patients, but its primary purpose is psychiatric diagnostic classification.
Methods
We used the retrospective method, collecting material from each patient's chart. First, we collected the medical history, such as the patients' demographic data, whether the patient had lost consciousness, duration of unconsciousness at the time of the injury, time elapsed since the brain damage, and the clinical data. All patients received a neuropsychological test, and the implementation and mental health clinic psychologist, performed the analysis. We based our estimation of each patient's premorbid intelligence on the method created by Kim15), using birth year and educational level.
Statistical analysis
We performed statistical processing on the data from the chart reviews using SPSS (MS Windows Release 17.0). These post hoc analyses consisted of frequency analysis (χ2 and Fisher Exact tests), mean difference analysis (t-test), two-step cluster analysis, and Dunnett's method; we considered the results significant at the p < 0.05 level.
RESULTS
Comparisons of the demographic and clinical factor between DE and NDE group
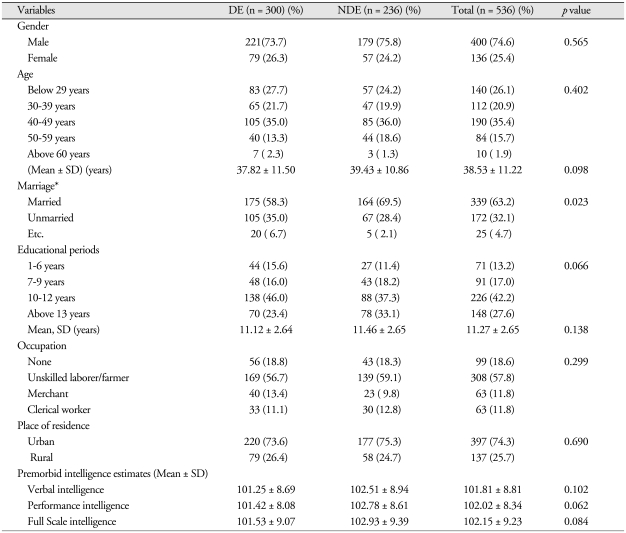
Demographic comparison of the DE and NDE groups showed a significant difference between the two groups on whether they were married or not (p < 0.05), but there was no significant difference between DE and NDE groups with regard to gender and age. Moreover, there were no significant differences between the two groups regarding educational level, occupational distribution, and residence location. With regard to premorbid estimated intelligence, there was no significant difference between the two groups on verbal (101.81 ± 8.81), performance (102.02 ± 8.34) and full-scale intelligence (102.15 ± 9.23) (Table 1).
Table 1.
Demographic data on the 536 subjects
N : numbers of patients, DE : disability evaluation group, NDE : Non-disability evaluation group, SD : standard deviation
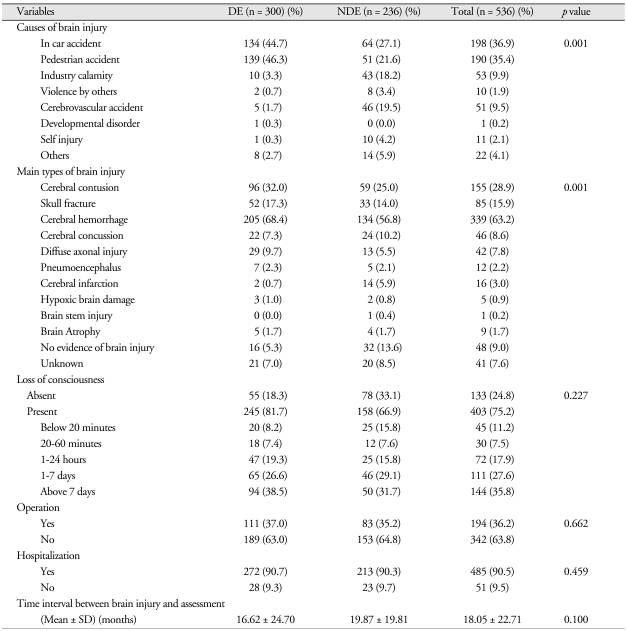
A comparison of the groups' clinical characteristics showed a significant difference with regard to the brain injury's cause (p < 0.001). In particular, pedestrian accident was the cause for many of the DE patients. Additionally, there was a significant difference with regard to the brain injury's classification (p < 0.001). However, there was no significant difference in the areas of whether they had lost consciousness, required an operation, or required hospitalization. There was also no significant difference between the groups in the time interval between brain injury and assessment (Table 2).
Table 2.
Clinical characteristics of the 536 subjects
N : numbers of patients, DE : disability evaluation group, NDE : non-disability evaluation group, SD : standard deviation
Comparisons of the intelligence and cognitive function between DE and NDE group
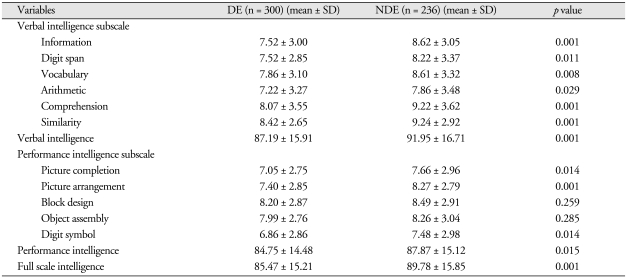
Table 3 shows summaries of the K-WAIS subscale score analyses for the DE and NDE groups. There were significant differences between the groups on Verbal Intelligence (DE, 87.19 ± 15.91; NDE, 91.95 ± 16.71; p < 0.001), as well as on Information (DE, 7.52 ± 3.00; NDE, 8.62 ± 3.05; p < 0.001), Digit Span (DE, 7.52 ± 2.85; NDE, 8.22 ± 3.37; p < 0.05), Vocabulary (DE, 7.86 ± 3.10; NDE, 8.61 ± 3.32; p < 0.01), Arithmetic (DE, 7.22 ± 3.27; NDE, 7.86 ± 3.48; p < 0.05), Comprehension (DE, 8.07 ± 3.55; NDE, 9.22 ± 3.62; p < 0.001), and Similarity (DE, 8.42 ± 2.65; NDE, 9.24 ± 2.92; p < 0.001), among the verbal intelligence subscales. On the Performance Intelligence subscale, there were significant differences between the two groups in Picture completion (DE, 7.05 ± 2.75; NDE, 7.66 ± 2.96; p < 0.05), Picture arrangement (DE, 7.40 ± 2.85; NDE, 8.27 ± 2.79; p < 0.001), and Digit symbol (DE, 6.86 ± 2.86; NDE, 7.48 ± 2.98; p < 0.05) but not in Block design or Object assembly. In addition, there were significant differences between the groups on Performance Intelligence (DE, 84.75 ± 14.48; NDE, 87.87 ± 15.12; p < 0.05) and Full-scale Intelligence (DE, 85.47 ± 15.21; NDE, 89.78 ± 15.85; p < 0.001).
Table 3.
Comparisons of verbal, performance, full scale intelligence quotients and subscale scores between DE and NDE groups
N : numbers of patients, DE : disability evaluation group, NDE : non-disability evaluation group, SD : standard deviation
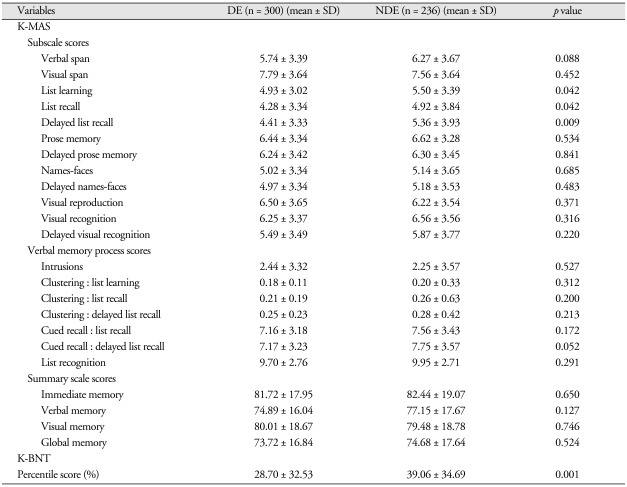
Table 4 gives summaries of the K-MAS subscale score analyses, verbal memory process scores, summary scale scores, and Boston Naming Test score percentages for the DE and NDE groups. On the K-MAS subscales, there were significant differences between the groups on List learning (DE, 4.93 ± 3.02; NDE, 5.50 ± 3.39; p < 0.05), List recall (DE, 4.28 ± 3.34; NDE, 4.92 ± 3.84; p < 0.05), and Delayed list recall (DE, 4.41 ± 3.33; NDE, 5.36 ± 3.93; p < 0.01). There were no significant differences between the two groups on any Verbal Memory Process Scale scores or Summary scale scores. On the other hand, there were significant differences between the two groups on the Boston Naming Test score percentages on recall (DE, 28.70 ± 32.53; NDE, 39.06 ± 34.69; p < 0.001).
Table 4.
Comparisons of K-MAS scores and K-BNT percentile score between DE and NDE groups
N: numbers of patients, DE: disability evaluation group, NDE: non-disability evaluation group, SD: standard deviation
Comparisons of the psychopathological and personality characteristics between DE and NDE group
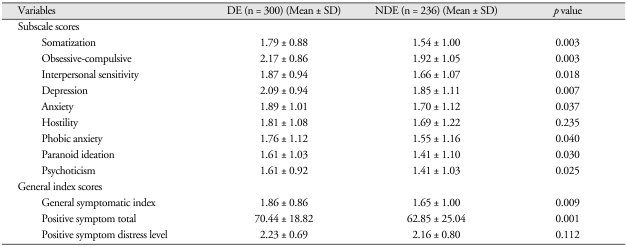
Table 5 shows summaries of the SCL-90-R score analyses for the DE and NDE groups. There were significant differences between the two groups in the subscores of Somatization (DE, 1.79 ± 0.88; NDE, 1.54 ± 1.00; p < 0.01), Obsessive-Compulsive (DE, 2.17 ± 0.86; NDE, 1.92 ± 1.05; p < 0.01), Interpersonal Sensitivity (DE, 1.87 ± 0.94; NDE, 1.66 ± 1.07; p < 0.05), Depression (DE, 2.09 ± 0.94; NDE, 1.85 ± 1.11; p < 0.01), Anxiety (DE, 1.89 ± 1.01; NDE, 1.70 ± 1.12; p < 0.05), Phobic Anxiety (DE, 1.76 ± 1.12; NDE, 1.55 ± 1.16; p < 0.05), Paranoid Ideation (DE, 1.76 ± 1.12; NDE, 1.55 ± 1.16; p < 0.05), and Psychoticism (DE, 1.61 ± 0.92; NDE, 1.41 ± 1.03; p < 0.05), but not in Hostility. Additionally, on the General Index scores, there were significant differences between the two groups in General symptomatic index (DE, 1.86 ± 0.86; NDE, 1.65 ± 1.00; p < 0.01) and Positive Symptom total (DE, 70.44 ± 18.82; NDE, 62.85 ± 25.04; p < 0.001) but not in Positive symptom distress level.
Table 5.
Comparisons of SCL-90-R scores between DE and NDE groups
N : numbers of patients, DE : disability evaluation group, NDE : non-disability evaluation group, SD : standard deviation
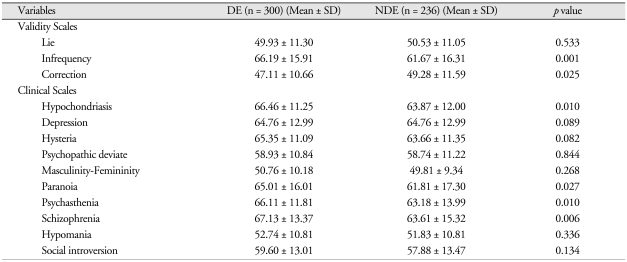
Table 6 shows summaries of the MMPI score analyses for the DE and NDE groups. Of the Validity scales, there were significant differences between the two groups in Infrequency (DE, 66.19 ± 15.91; NDE, 61.67 ± 16.31; p < 0.001) and Correction (DE, 47.11 ± 10.66; NDE, 49.28 ± 11.59; p < 0.05). On the Clinical scales, there were significant differences between the two groups in Hypochondriasis (DE, 66.46 ± 11.25; NDE, 63.87 ± 12.00; p < 0.05), Paranoia (DE, 65.01 ± 16.01; NDE, 61.81 ± 17.30; p < 0.05), Psychasthenia (DE, 66.11 ± 11.81; NDE, 63.18 ± 13.99; p < 0.05), and Schizophrenia (DE, 67.13 ± 13.37; NDE, 63.61 ± 15.32; p < 0.01).
Table 6.
Comparisons of MMPI scores between DE and NDE groups
N: numbers of patients, DE: disability evaluation group, NDE: non-disability evaluation group, SD: standard deviation
Comparisons of the demographic and clinical factor between DEC groups and NDE group
Comparison results of the three DECs and the NDE on demographics and premorbid estimated intelligence showed no significant differences among the groups. Comparison of the groups' clinical characteristics showed a significant difference among the groups regarding classification according to cause (p < 0.001), type of brain injury (p < 0.01), and whether the patient lost consciousness (p < 0.01). But any statistically significant difference among loss of consciousness period regarding intelligence, neurocognitive function, and psychopathology were not founded in post-hoc confirmatory analysis.
Comparisons of the intelligence and cognitive function between DEC groups and NDE group(Table 7)
Table 7.
Comparisons of intelligence quotients, K-MAS index scores and K-BNT score among DEC and NDE groups
*p < 0.05, †p < 0.01, ‡p < 0.001, p value of Dunnett's t-test. N : numbers of patients, DEC : clustered disability evaluation group, NDE : non-disability evaluation group, SD : standard deviation
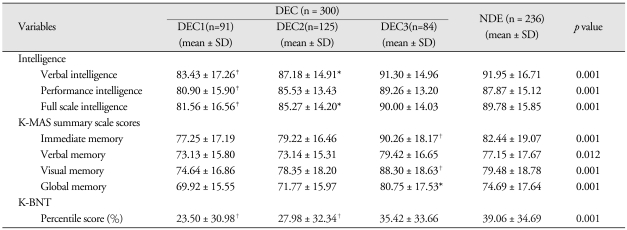
K-WAIS intelligence quotients and subscale scores analyses results for the four groups(those three disability evaluation cluster groups and the one non-disability evaluation group): There were significant differences among the groups on the Verbal intelligence subscale (p < 0.05), and DEC1 and DEC2 groups significantly differed from the NDE group on the Verbal intelligence subscales, except for Similarity (p < 0.05). With regard to Similarity, there were significant differences between DEC2 and NDE groups (p < 0.05). On the Performance intelligence subscale, there were significant differences among the groups, except on Object assembly (p < 0.01), and DEC1 group significantly differed from NDE group on Picture completion (p < 0.01), Picture arrangement (p < 0.001), and Digit symbol (p < 0.05). While DEC3 did not significantly differ from NDE on the Performance intelligence subscale, DEC2 group significantly differed from NDE group on Digit symbol (p < 0.05). There were significant differences among the groups on verbal (p < 0.001), performance (p < 0.001), and full-scale intelligence (p < 0.001). The DEC1 group differed significantly from the NDE group for all areas of intelligence quotient (p < 0.001), while the DEC2 group significantly differed from the NDE group on Verbal (p < 0.05) and Full-scale intelligence (p < 0.05). Moreover, there were no significantly differences between the DEC3 and NDE groups.
K-MAS summary scales and subscales scores analyses results for the four groups : On the subscale scores, there were significant differences among the groups in Verbal (p < 0.001) and Visual spans (p < 0.001), List learning (p < 0.05), List recall (p < 0.01), Delayed list recall (p < 0.001), Delayed prose memory (p < 0.05), Names-faces (p < 0.01), Delayed names-faces (p < 0.001), Visual reproduction (p < 0.01), Visual recognition (p < 0.001), and Delayed visual recognition (p < 0.001). The DEC1 group significantly differed from the NDE group on Verbal span (p < 0.05), List recall (p < 0.05), Delayed list recall (p < 0.01), Visual recognition (p < 0.01), and Delayed visual recognition (p < 0.01). The DEC2 group significantly differed from the NDE group on List learning (p < 0.05), List recall (p < 0.05), and Delayed list recall (p < 0.01), while the DEC3 group significantly differed from the NDE group on Visual span (p < 0.01), Names-faces (p < 0.05), Delayed names-faces (p < 0.05), Visual reproduction (p < 0.05), and Visual recognition (p < 0.05). On Verbal memory process scores, there were significant differences among the groups on Cued recall at Delayed list recall (p < 0.05) and List recognition (p < 0.05), but there were no significant differences between each DEC group and the NDE group. There were significant differences among the groups on the Summary scales (p < 0.05 or p < 0.01), but only the DEC3 group showed a significant difference with the NDE group on Immediate (p < 0.01), Visual (p < 0.01), and Global memory (p < 0.05).
On the Boston Naming Test scores, there were significant differences among the groups (p < 0.001); in particular, the DEC1 and DEC2 group significantly differed from the NDE group (p < 0.01).
Comparisons of the psychopathological and personality characteristics among DEC groups and NDE group
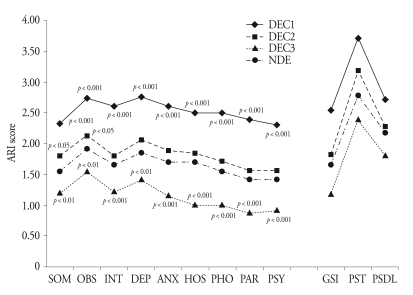
Fig. 1. shows summaries of the SCL-90-R score analysis for the four groups. There were significant differences among the groups on the all the subscales (p < 0.001), and the DEC1 and DEC3 groups significantly differed from the NDE group on all of the subscales (p < 0.01). However, the DEC2 group showed a significant difference from the NDE group on Somatization (p < 0.05) and Obsessive-compulsive (p < 0.05). There were significant differences among the groups on the all of the General index scores (p < 0.001). The DEC1 and DEC3 groups significantly differed from the NDE group on all of the general index scores (p < 0.01), but the DEC2 group showed a significant difference from NDE group on just the Positive symptom total (p < 0.001).
Fig. 1.
Comparisons of SCL-90-R scores among DEC and NDE groups*. *p values of Dunnett's t-test results among DEC and NDE are marked, ARI : average rating for item, DEC : clustered disability evaluation group, NDE : non-disability evaluation group, SOM : somatization, OBS : obsessive-compulsive, INT : interpersonal sensitivity, DEP : depression, ANX : anxiety, HOS : hostility, PHO : phonic anxiety, PAR : paranoid ideation, PSY : psychoticism, GSI : general severity index, PST : positive symptom total, PSDL : positive symptom distress level.
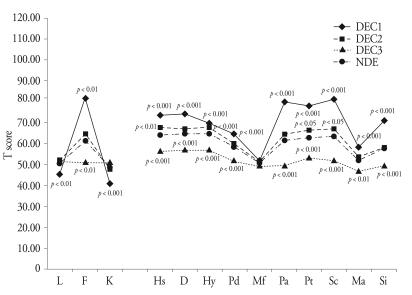
Fig. 2. shows summaries of the MMPI score analysis for the four groups. There were significant differences among the groups on all of the Validity scales (p < 0.001). The DEC1 group significantly differed from the NDE group on all of the Validity scales (p < 0.01), and the DEC3 group showed a significant difference from the NDE group on Infrequency (p < 0.001). There were significant differences among the groups on the Clinical scales, with the exception of Masculinity-Femininity (p < 0.001). In addition, the DEC1 and DEC3 groups significantly differed from the NDE group on the Clinical scales, again, with the exception of Masculinity-Femininity (p < 0.01). The DEC2 group significantly differed from the NDE group on Hypochondriasis (p < 0.01), Hysteria (p < 0.01), Psychasthenia (p < 0.05), and Schizophrenia (p < 0.05).
Fig. 2.
Comparisons of MMPI scores among DEC and NDE groups*. *p values of Dunnett's t-test results among DEC and NDE are marked , DEC : clustered disability evaluation group, NDE : non-disability evaluation group, L : lie, F : infrequency, K : correction, Hs : hypochondriasis, D : depression, Hy : hysteria, Pd : psychopathic deviate, Mf : masculinity-femininity, Pa : paranoia, Pt : psychasthenia, Sc : schizophrenia, Ma : hypomania, Si : social introversion.
DISCUSSION
Conducting a neurosurgical and neuropsychological evaluation, and, particularly, a neurosurgical disability evaluation, regarding the outcome of a brain injury can be conceptualized as a scientific endeavor. When performing a forensic evaluation, appropriate use of logical and scientific reasoning is critical for the avoidance of diagnostic errors20). However, failure to analyze cases critically and scientifically will result in either over- or under-evaluation of the brain injury outcome in cases of neurocognitive deficits secondary to a preexisting condition, especially a psychiatric condition (whether or not it correlates to the brain injury), or in cases of neurocognitive deficits secondary to conscious or unconscious malingering when performing neuropsychological tests (due to extra incentives).
In the present study, we compared patients who were categorized into the same type except for the presence or absence of real, extra incentives. That is, the DE group was under DE at the time, and the NDE group was under treatment but would need DE in the future. Controlling for contaminating or confounding demographic and clinical variables, we excluded patients who were in a distressed emotional state, had a psychiatric disorder, had a pre-existing developmental/cognitive or neurological disorder, or suffered from alcohol or drug abuse. We analyzed the demographic and clinical factors affecting the brain injury outcome and then verified the results in a preliminary statistical analysis. Some variables, which we did not successfully control, were marital status (in demographic factors), cause and type of brain injury (in clinical factors). However, we controlled and counterbalanced most demographic factors affecting brain injury outcome, such as age, gender, academic attainment, job, and premorbid intelligence. Of the clinical factors, the differences between DE and NDE were not sampling biases but multiple types of brain injury and different distributions of brain injury causes. In their study, Park and Kim34) suggested that DE of industrial calamity patients were suspended than other patients with brain or other injuries due to prolonged psychosocial dysfunction. For this reason, treatment duration and distribution of industrial calamity patients between DE and NDE groups are different, but in confirmatory post hoc statistical analysis among causes of injury, they did not showed any significant statistical difference. With regard to brain injury types, brain injury severity was a more influential factor than was type of brain injury. Studies have not shown consistent results regarding prognosis and type of brain injury25,29). Regarding other clinical factors, treatment duration and brain injury severity as GCS and others did not show any differences.
With regard to comparisons of intelligence between the DE and NDE groups, the DE group showed lower intelligence than the NDE group did, except on the Block design and Object assembly subscales. We expected lower intelligence in the DE group, but the degree of difference in intelligence was smaller than in simulated malingering studies2,11,12,30). This suggests that the DE situation had an effect on test-taking attitude intentionally or no intentionally, but the severity of faking-bad was not as severe as was the simulation or conscious faking-bad behaviors of a normal subject, and the DE situation had less of an effect on Block design and Object assembly subscales performances. KMAS summary scale scores and recognition subscales scores did not show statistically significant differences, but List learning, List recall, and Delayed list recall subscale scores did show statistically significant differences. Memory dysfunction is a common complaint following brain injury1,26,33). There are several known organic memory dysfunction patterns6,38), but malingers frequently lack sufficient knowledge to mimic true memory disorder symptoms and are likely to over-portray impairment severity or produce improbable assessment outcomes that are inconsistent with those of cooperative brain-injured patients8,28). The DE group did not show malingered memory dysfunctions patterns, i.e., the same or lower recognition performance than recall performance41), but did show lower effort on the performance of the effortful task of recall memory. In comparisons of subjective psychopathologic symptoms, evaluated via the SCL-90-R, the DE groups showed more severe psychopathologic symptoms than NDE group did, with the exception of Aggression and the Positive symptom distress index scores. This means that multiple neurotic symptoms and aggression symptoms are common between the groups, but the DE groups could not simulate sophisticated psychopathologic symptoms. On the MMPI, considering the more subjective psychopathologic symptoms, the more psychotic symptoms are prominent23), the DE group mainly simulated psychopathologic symptoms using psychotic symptoms.
Using cluster analysis, we divided the DE group into three groups for further analysis. Comparing demographic and clinical factors among the groups, we found duration of loss of consciousness showed a statistically significant difference, but the post hoc statistical analysis among groups regarding duration of loss of consciousness did not show a statistically significant difference for most dependent variables. Unlike patients with severe brain injury43), predicting brain injury outcomes for patients with mild and moderate brain injury is not appropriate9). In this study, we excluded all severe brain injury patients, which had no effect on group classifications, statistically. With regard to intelligence comparisons among DE groups and the NDE group, the DEC1 group showed lower performances than the NDE group did at all intelligence quotients and subscales. The DEC2 group showed lower performances than the NDE group did on Verbal intelligence quotient, Full scale intelligence quotient, and some of subscales. However, the DEC3 group did not show any differences from the NDE group. On the K-MAS, the DEC1 group showed lower performances than the NDE group did on some subscales, including the visual recognition scale, but the DEC2 group showed higher performances than the NDE group did on most memory functions. In comparisons of subjective psychopathologic symptoms as evaluated by the SCL-90-R, the DEC1 group showed more severe subjective symptoms on all subscales. The DEC2 group showed more severe subjective symptoms on the Somatization and Obsessive-Compulsive scales, but the DEC3 groups showed fewer subjective symptoms than the NDE group did. On the MMPI, the DEC1 group showed an elevation on the psychotic scales, in particular, a mean score on the Infrequency scale of T = 81. However, the DEC3 group showed fewer symptoms and a better adaptation level than the NDE group did. In summary, as compared to the NDE group, the DEC1 group was similar to an intentional malingering group. The DEC2 group unconsciously exaggerated their own symptoms, using defense mechanism such as somatization (similar to neurotic patients). The DEC3 group consciously or unconsciously under-evaluated their own symptoms and denied problematic symptoms. These results correlated to memory function level. That is, the higher the memory function in brain-injured patients, the lower their severity of subjective symptom severity and the fewer complaints19).
In neuropsychological settings, malingering can occur in any of several patterns: false or exaggerated symptom reports, intentional poor performance on neuropsychological tests, or a combination of symptom exaggeration and intentional performance deficit10,21). We could classify the DEC1 group as the malingering group, because they exaggerated their reports of subjective psychiatric symptoms on the SCL-90-R, performed more poorly on neuropsychological tests than did the NDE group, did not show characteristic MMPI patterns but did have a profile with all subscales elevated (centered on the psychotic subscales : Paranoia, Psychasthenia, and Schizophrenia), and gave intentionally poor performances on intelligence and memory tests. Traditional psychoanalytic thought views somatoform conditions as a process of psychological conflict "conversion" into physical symptoms; however, many authors criticize this formulation, because researchers cannot specify and/or merge with current cognitive science knowledge the actual mechanism by which the conversion occurs4,36).
Alternatively, we may explain the DEC2 group's symptomatic and neurocognitive characteristics by the nonconscious generation of nonorganic physical and cognitive symptoms4), by an "autosuggestive disorder" based on the supervisory attention system32), as secondary to an attentional awareness system dysfunction, as an inhibitory mechanism based on prefrontal physiology36), or as active use of cognitive strategies (constructive cognition)5). Therefore, the DEC2 group did not consist of active but passive malingers, as a result of unintentional or nonconscious processes.
The DEC3 group showed fewer subjective symptoms, lower psychopathology, and higher cognitive functioning than the other groups. They reported fewer complaints, under-evaluated their own brain-injury disability, and/or showed an honest test-taking attitude on their neuropsychological tests. These attitudes may be desirable. However, they could be regarded as a refusal of treatment. Brain-injured patients may refuse treatment due to beliefs that brain injury is not curable and/or that brain-injured persons could be regarded as insane13). Characteristics as seen in the DEC3 group may also be caused by a decrease in self-awareness and self-perception abilities, a disagreement between patient and spouse (patients may be mainly concerned with physical rehabilitation, while spouses are concerned about all affected functions, including physical, psychological, and cognitive). Furthermore, patients may misunderstand or forget their symptoms after their discharges because of anosognosia, decreased memory, or decreased information-processing abilities35). The DEC3 group's characteristics suggest denial of symptoms and resistance to treatment.
A limitation of this study was the method of controlling for demographic and clinical factors affecting outcome of brain injury. We used statistical controls for homogeneous grouping between or among groups. More reliable and valuable research will be needed for quality control of variables such as brain injury site and duration of consciousness loss.
CONCLUSION
In this study, we compared DE and NDE groups based on control of demographic and clinical factors among the groups. The DE group showed minimal "faking bad" patterns and simulated malingering or "faking bad" test-taking less than normal subjects would. When we divided the DE group into three groups, the DEC1 group showed typical malingering patterns in subjective symptoms, psychopathology, and neurocognitive functions; the DEC2 group showed passive malingering as a result of unintentional or nonconscious processes; and the DEC3 group's characteristics suggested denial of symptoms and resistance to treatment.
Acknowledgements
This research was supported by the Yeungnam University research grants in 2008.
References
- 1.Arcia E, Gualtieri CT. Association between patient report of symptoms after mild head injury and neurobehavioural performance. Brain Inj. 1993;7:481–489. doi: 10.3109/02699059309008175. [DOI] [PubMed] [Google Scholar]
- 2.Bernard LC, McGrath MJ, Houston W. Discriminating between simulated malingering and closed head injury on the Wechsler Memory Scale-Revised. Arch Clin Neuropsychol. 1993;8:539–551. [PubMed] [Google Scholar]
- 3.Board J, Goodglass H, Kaplan E. Normative data on the Boston Diagnostic Aphasia Examination, parietal lobe and the Boston Naming Test. J Clin Neuropsychol. 1980;2:209–215. [Google Scholar]
- 4.Boone KB. A reconsideration of the Slick er al.(1999) criteria for malingered neurocognitive function. In: Boone KB, editor. Assessment of feigned cognitive impairment: A neuropsychological perspective. New York: The Guilford Press; 2007. pp. 29–49. [Google Scholar]
- 5.Bryant RA, McConkey KM. Functional blindness: A construction of cognitive and social influences. Cogn Neuropsychiatry. 1999;4:227–241. [Google Scholar]
- 6.Delis DC. Neuropsychological assessment in learning and memory. In: Boller F, Grartman J, editors. Handbook of neuropsychology. Amsterdam: Elsevier; 1991. pp. 3–33. [Google Scholar]
- 7.Derogatis LR, Lipman RS, Covi L. An outpatient psychiatric rating scale- preliminary report. Psychopharmacol Bull. 1973;9:13–28. [PubMed] [Google Scholar]
- 8.Gouvier WD, Prestholdt PH, Warner MS. A survey common misconceptions about head injury and recovery. Arch Clin Neuropsychol. 1988;3:331–343. [PubMed] [Google Scholar]
- 9.Gronwall D. Behavioral assessment during the acute stages of traumatic brain injury. In: Lezak MD, editor. Assessment of the behavioral consequences of head trauma. Vol. 7. Frontiers of clinical neuroscience. New York: Alan R. Liss; 1989. pp. 72–89. [Google Scholar]
- 10.Iverson Gl, Binder LM. Detecting exaggeration and malingering in neuropsychological assessment. J Head Trauma Rehabil. 2000;15:829–858. doi: 10.1097/00001199-200004000-00006. [DOI] [PubMed] [Google Scholar]
- 11.Johnson JL, Bellah CG, Dodge T, Kelley W, Livingston MM. Effect of warning on feigned malingering on the WAIS-R in college samples. Percept Mot Skills. 1998;87:152–154. doi: 10.2466/pms.1998.87.1.152. [DOI] [PubMed] [Google Scholar]
- 12.Johnstone L, Cooke DJ. Feigned intellectual deficits on the Wechsler Adult Intelligence Scale-Revised. Br J Clin Psychol. 2003;42:303–318. doi: 10.1348/01446650360703401. [DOI] [PubMed] [Google Scholar]
- 13.Kelly R. The post-traumatic syndrome: An iatrogenic disease. Forensic Sci. 1975;6:17–24. doi: 10.1016/0300-9432(75)90219-8. [DOI] [PubMed] [Google Scholar]
- 14.Kim GI, Kim JH, Won HT. Symptom Checklist-90-Revised. Seoul: Jungangjeokseung Press; 1984. [Google Scholar]
- 15.Kim HG. Estimating premorbid intelligence estimation: after year 2001. Korean J Clin Psychol. 2001;29:155–164. [Google Scholar]
- 16.Kim HH, Na DY. The Korean version Boston Naming Test. Seoul: Hakjisa; 1997. [Google Scholar]
- 17.Kim JS, Kim OL, Seo WS, Koo BH, Joo Y, Bai DS. Memory dysfunction after mild and moderate traumatic brain injury : Comparison between patients with and without frontal lobe injury. J Korean Neurosurg Soc. 2009;46:459–467. doi: 10.3340/jkns.2009.46.5.459. [DOI] [PMC free article] [PubMed] [Google Scholar]
- 18.Kim YH, Kim JH, Kim JS, Rho ML, Yeon TH, Oh SW. The Korean version Minnesota Multiphasic Personality Inventory. Seoul: Korean Guidance; 1989. [Google Scholar]
- 19.Koo BH, Bai DS. The comparison of Psychiatric symptoms in traumatic brain injury with and without intelligence and memory impairments. J Korean Soc Biol Ther Psychiatry. 2006;12:182–195. [Google Scholar]
- 20.Larrabee GJ. A scientific approach to forensic neuropsychology. In: Larrabee GJ, editor. Forensic neuropsychology: A scientific approach. New York: Oxford University Press; 2005. pp. 3–28. [Google Scholar]
- 21.Larrabee GJ. Forensic neuropychological assessment. In: Vanderploeg RD, editor. Clinical guide to neuropsychological assessment, ed 2. Mahwah, NJ: Lawrence Erlbaum; 2000. pp. 301–335. [Google Scholar]
- 22.Lee HS, Park BG, Ahn CI, Kim MLH, Jeung IG. Korean version of memory assessment scales. Seoul: Korean Guidance; 2001. [Google Scholar]
- 23.Lee JB, Kim OL, Kim JS, Seo WS, Bai DS. The study of subjective symptoms of traumatic brain injury patients using structured evaluation and neuropsychological tests. J Korean Soc Biol Ther Psychiatry. 2003;9:213–234. [Google Scholar]
- 24.Lee KS. Assessment of physical impairment and disability evaluation: Problem of present system and design for better system. J Korean Neurosurg Soc. 1994;23:276–282. [Google Scholar]
- 25.Lee SW, Kim OL, Woo BG, Kim SH, Bae JH, Choi BY, Cho SH. Prognostic factors in patients with severe head injury. J Korean Neurosurg Soc. 1999;28:1288–1292. [Google Scholar]
- 26.Levin HS. Memory deficit after closed head injury. J Clin Exp Neuropsychol. 1990;12:129–153. doi: 10.1080/01688639008400960. [DOI] [PubMed] [Google Scholar]
- 27.Lezak MD, Howieson DB, Loring DW, Hannay HJ, Fisher JS. Neuropsychological assessment, ed 4. New York: Oxford University Press; 2004. pp. 157–285. [Google Scholar]
- 28.Lu PH, Rogers SA, Boone KB. Use of standard memory tests to detect suspect effort. In: Boone KB, editor. Assessment of feigned cognitive impairment: A neuropsychological perspective. New York: The Guilford Press; 2007. [Google Scholar]
- 29.Mendelow AD, Teasdale G, Jennett B, et al. Risks of intracranial haematoma in head injured adults. Br Med J (Clin Res Ed) 1983;287:1173–1176. doi: 10.1136/bmj.287.6400.1173. [DOI] [PMC free article] [PubMed] [Google Scholar]
- 30.Mittenberg W, Theroux-Fichera S, Zielinski RE, Heilbronner RL. Identification of malingered head injury on the Wechsler Adult Intelligence Scale-Revised. Prof Psychol Res Pr. 1995;26:491–498. [Google Scholar]
- 31.Newcombe F. Psychometric and behavioral evidence: Scope, limitations, and ecological validity. In: Lavin HS, Crafman J, Eisenberg HM, editors. Neurobehavioral recovery from head injury. New York: Oxford University Press; 1987. pp. 129–145. [Google Scholar]
- 32.Oakley D. Hypnosis and conversion hysteria : a unifying model. Cogn Neuropsychiatry. 1999;4:243–265. doi: 10.1080/135468099395954. [DOI] [PubMed] [Google Scholar]
- 33.Oddy M, Coughlan T, Tyerman A, Jenkins D. Social adjustment after closed-head injury : a further follow-up seven years after injury. J Neurol Neurosurg Psychiatr. 1985;48:564–568. doi: 10.1136/jnnp.48.6.564. [DOI] [PMC free article] [PubMed] [Google Scholar]
- 34.Park KC, Kim HJ. Psychosocial outcome after brain injury. J Korean Neurosurg Soc. 2000;29:196–202. [Google Scholar]
- 35.Prigatano GP. Psychotherapy after brain injury. In: Prigatano GP, Fordyce DJ, Zeiner HK, Baltimore MD, editors. Neuropsychological rehabilitation after brain injury. Washington DC: Johns Hopkins University Press; 1986. pp. 67–95. [Google Scholar]
- 36.Sierra M, Berrios GE. Towards a neuropsychiatry of conversive hysteria. Cogn Neuropsychiatry. 1999;4:267–287. [Google Scholar]
- 37.Slick DJ, Sherman EM, Iverson GL. Diagnostic criteria for malingered neurocognitive dysfunction : Proposed standards for clinical practice and research. Clin Neuropsychol. 1999;13:545–561. doi: 10.1076/1385-4046(199911)13:04;1-Y;FT545. [DOI] [PubMed] [Google Scholar]
- 38.Trueblood W. Qualitative and quantitative characteristics of malingered and other invalid WAIS-R and clinical memory data. J Clin Exp Neuropsychol. 1994;16:597–607. doi: 10.1080/01688639408402671. [DOI] [PubMed] [Google Scholar]
- 39.Vogenthaler DR, Smith KR, Goldfader L. Head injury, an empirical study : Describing long-term productivity and independent living outcome. Brain Inj. 1989;3:355–368. doi: 10.3109/02699058909004560. [DOI] [PubMed] [Google Scholar]
- 40.Wechsler D. Wechsler Adult Intelligence Scale-Revised. New York: The psychological corporation; 1981. [Google Scholar]
- 41.Wiggins EC, Brandt J. The detection of simulated amnesia. Law Hum Behav. 1988;12:57–58. [Google Scholar]
- 42.Williams JM. Memory Assessment Scales. Odessa, FL: Psychological Assessment Resources; 1991. [Google Scholar]
- 43.Wilson BA, Vizor A, Bryant T. Predicting severity of cognitive impairment after severe head injury. Brain Inj. 1991;5:189–197. doi: 10.3109/02699059109008089. [DOI] [PubMed] [Google Scholar]
- 44.Yeom TH, Park YS, Oh KJ, Lee YH. Korean version Wechsler adult intelligence scale. Seoul: Korean Guidance; 1992. [Google Scholar]
- 45.Youngjohn JR, Burrows L, Erdal K. Brain damage or compensation neurosis? The controveral post-concussion syndrome. Clin Neuropsychol. 1995;9:112–123. [Google Scholar]


