Abstract
The present work illustrated an accurate GC/MS measurement for the low isotopomer enrichment assay of formic acid, acetic acid, propionic aicd, butyric acid and pentanoic acid. The pentafluorobenzyl bromide derivatives of these very short chain fatty acids have high sensitivity of isotopoic enrichment due to their low natural isotopomer distribution in negative chemical ionization mass spectrometric mode. Pentafluorobenzyl bromide derivatization reaction was optimized in terms of pH, temperature, reaction time and the amount of pentafluorobenzyl bromide versus to sample. The precision, stability and accuracy of this method for the isotopomer analysis were validated. This method was applied to measure the enrichments of formic acid, acetic acid and propionic acid in the perfusate from rat liver exposed to Krebs-Ringer bicarbonate buffer only, 0-1 mM [3,4-13C2]-4-hydroxynonanoate and 0-2 mM of [5,6,7-13C3]heptanoate. The enrichments of acetic acid and propionic acid in the perfusate are comparable to the labeling pattern of acetyl-CoA and propionyl-CoA in the rat liver tissues. The enrichment of acetic acid assay is much more sensitive and precise than the enrichment of acetyl-CoA by LC-MS/MS. The reversibility of propionyl-CoA from succinyl-CoA was confirmed by the low labeling of M1 and M2 of propionic acid from [5,6,7-13C3]heptanoate perfusates.
Keywords: PFBBr, Isotope, isotopomer enrichment, metabolism, GC/MS, short chain fatty acids
Introduction
The combination of isotopomer analysis [1-6] and metabolomics has been extensively applied in new pathway identification [7], biosynthesis rate assay [8-10] and turnover measurements of metabolites [11;12].
Elements have their own natural stable isotope distributions, such as 13C (1.11%), 2H (0.015%), 15N (0.37%), 18O (0.20%) and 29Si (5.06%) etc [1]. The mass isotopomer distribution of a molecule M0, M1, M2, …Mn…, reflects all of its elemental components [13]. In general, a molecule with higher molecular weight has a higher natural mass isotopomer distribution. For instance, the natural isotopomer distribution of M1 formic acid (MW=46), octanoic acid (MW=144) and palmitic acid (MW=256) are 1.22, 9.20 and 18.32%. The higher background of natural isotopomer distribution from large molecules makes it difficult to measure the low enrichment of these molecules. For example, 1% increases of M1 enrichment causes 82, 11, and 5% increase over the M1 natural isotopomer distribution of formic acid, octanoic acid and palmitic acid, respectively. Obviously, the high background of natural isotopomer distribution decreases the relative increase from low isotopomer enrichment. Thus, the strategy for isotopomer analysis is to avoid isotope background increase by derivatization that occurs in most of GC applications. Mass spectrometry and NMR are commonly used analytical approach for isotopomer analysis [14-20]. Mass spectrometry has much more applications because of its higher sensitivity. GC and LC are the most common separation techniques that are combined with mass spectrometer. GC/MS is usually used for volatile compounds or compounds after derivatization. The derivatization for formic acid are methylation [21;22], ethylation [23] and 2,4-difluoroaniline [24]. However, all of these derivatives dilute the isotopomer enrichment by introducing additional isotopomers from derivatizaing reagent.
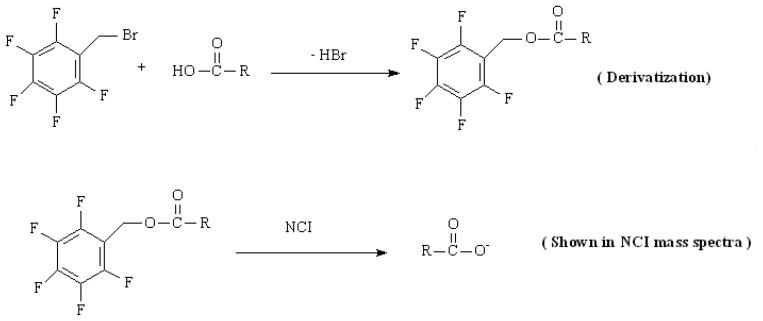
The head space GC/MS [21;25] method also has no isotope dilution, but it has more interference because of its small mass and less retention on the column. The arising interest for very short chain acids isotopomer analysis is to develop an ideal derivatizative that has reasonable GC retention but no isotopomer dilution. Pentafluorobenzyl bromide (PFBBr) is an alkylation derivative reagent for carboxylic acid, sulfonamides, mercaptans and phenol compounds, fulfils this requirement. PFBBr derivatization has been previously used for formic acid and acetic acid concentration quantification [26]. In addition to better retention on the GC column and higher sensitivity, the PFBBr derivatives do not disrupt the natural isotopomer distribution in negative chemical ionization (NCI) because only acid moiety is measured in NCI (Scheme 1).
Scheme 1.
Chemical structure of PFBBr derivatives of acids and their mass ion in negative chemical ionization of mass spectrometry.
Fatty acid β-oxidation can be tracked by all the acyl-CoA intermediates and final products that enter the citric acid cycle (CAC), i.e. acetyl-CoA or propionyl-CoA (from odd chain fatty acid). These acyl-CoAs can be hydrolyzed to related fatty acids. Assaying the isotopomer enrichment of acyl-CoAs holds the following challenges: (i) acyl-CoA analysis requires complicated sample preparations and LC-MS/MS methodology; (ii) acyl-CoAs are sampled from tissues that are not as readily available when compared to plasma and urine in clinical application; (iii) whole acyl-CoAs have much higher molecular weights than their corresponding acyl- moieties, which brings higher background of natural isotopomer distributions (i.e. these free acids are hydrolyzed from acyl-CoAs). We hypothesize that the turnover of free acids reflects their correspoinding acyl-CoAs. To confirm this we provide a comparison of the isotopomer enrichments of free acids and acyl-CoAs. The purpose of the present work is to develop an accurate GC/MS method to measure low mass isotopomer enrichment of very short chain fatty acids. And we applied this method to analyze metabolites of fatty acids in the rat liver perfusates.
For this purpose, two different isotope tracers that produce very short chain fatty acids during their metabolism are tested in the present work. The first is rat liver perfused with [3,4-13C2]-4-hydroxynonanoate, which is an endogenous metabolite of the ubiquitous lipid peroxidation product 4-hydroxynonenal as described in our previous work [7]. [3,4-13C2]-4-Hydroxynonanoate catabolism in the rat liver forms M1 and M2 acetyl-CoA via two different pathways. The second is rat liver perfused with [5,6,7-13C3]heptanoate. [5,6,7-13C3]Heptanoate is an odd chain fatty acid that is metabolized to M3 propionyl-CoA via β-oxidation. Propionyl-CoA is an anaplerotic substrate entering the CAC [27].
MATERIALS AND METHODS
Chemical and reagents
Materials
General chemicals and Pentafluorobenzyl bromide (PFBBr) were purchased from Sigma-Aldrich. Sodium [13C]-formate, sodium [2,2-2H2-1,2-13C2]-acetate, sodium [2,2,3,3,3-2H5]-propionate, sodium [2,2,3,3,4,4,4-2H7]-butyrate, sodium [2,2,3,3,4,4,5,5,5-2H9]-pentanoate, [5,6,7-13C3]heptanoic acid and D2O (99%) were obtained from Isotec. [3,4-13C2]4-hydroxynonanoate was synthesized in our lab [28]. Fresh distilled Milli-Q water was made daily by distilling Milli-Q water including 1 mM NaOH. All the standard solution and buffer were prepared in distilled Milli-Q water.
Liver Perfusion Experiments
The detailed perfusion experiments can be referred to in our previous work [7;29]. Male Sprague-Dawley rats (120-140g) were fed ad libitum for 8-12 days with standard laboratory chow. Livers from overnight-fasted rats were perfused with non-recirculating Krebs-Ringer bicarbonate buffer (30 ml/min) and 4 mM glucose containing 0 to 1 mM of [3,4-13C2]-4-OH-nonanoic acid, or 0 to 2 mM of [5,6,7-13C3]heptanoate. At 0, 14 and 18.5 min, samples of influent and effluent perfusate were collected over 1 min and quick-frozen for all short chain fatty acids analysis. After 20 min the livers were quick-frozen and kept in liquid nitrogen until analysis of acyl-CoAs.
LC-MS/MS for acyl-CoAs labeling assay - Labeling pattern of acyl-CoA esters
Acyl-CoAs enrichment data was reported in our previous work and the more details of this assay by LCMS/MS will be reported somewhere else [7;28]. Powdered frozen liver (~300 mg) was extracted for 2 min with 4 ml of methanol/water 1:1 containing 5% acetic acid using a Polytron homogenizer. The supernatant was run on a 3-ml ion exchange cartridge packed with 300 mg of 2-2(pyridyl)ethyl silica gel (Sigma). The cartridge had been preactivated with 3 ml of methanol and then with 3 ml of extraction buffer. The acyl-CoAs trapped on the silical gel cartridge were released with (i) 3 ml of a 1:1 mixture (MeOH:H2O) including 50 mM ammonium formate, pH 6.3, and then (ii) 3 ml of a 3:1 mixture (MeOH:H2O) including 50 mM ammonium formate, pH 6.3 and (iii) 3 ml of methanol. The combined effluent was dried with nitrogen gas and stored at −80 °C until LC-MS/MS analysis. After dissolving the acyl-CoAs in 100 l of buffer A (2% acetonitrile in 100 mM ammonium formate, pH 5.0), 40 μl were injected on a Thermo Scientific Hypersil GOLD C18 column (150 × 2.1 mm), protected by a guard column (Hypersil GOLD C18 5 m, 10 × 2.1 mm), in an Agilent 1100 liquid chromatograph. The chromatogram was developed at 0.2 ml/min (i) for 3 min with 98% buffer A and 2% buffer B (95% acetonitrile in 5 mM ammonium formate, pH 6.3), (ii) from 3 to 25 min with a 2–60% gradient of buffer B in buffer A, (iii) from 26 to 31 min with 10% buffer A, 90% buffer B, (iv) from 32 to 41 min with a 90% to 2% gradient buffer B in buffer A, and (v) for 10 min of stabilization with 98% buffer A before the next injection. The liquid chromatography was coupled to a 4000 QTrap mass spectrometer (Applied Biosystems, Foster City, CA) operated under positive ionization mode with the following source settings: turbo-ion-spray source at 600 °C under N2 nebulization at 65 PSI, N2 heater gas at 55 PSI curtain gas at 30 PSI, collision-activated dissociation gas pressure held at high, turbo ion-spray voltage at 5,500 V, declustering potential at 90 V, entrance potential at 10 V, collision energy at 50 V, and collision cell exit potential at 10 V. The Analyst software (version 1.4.2; Applied Biosystems) was used for data registration.
GC/MS Assays
Sample preparation for short chain fatty acids with GC/MS assay is as follows. A 400 μl of 100 mM PFBBr acetone solution was added into 200 μl of perfusate samples or standard aqueous solution without protein precipitation step. The sample was incubated at 60-70 C for 1 hour. One ml of hexane was added after the sample had cooled. The sample was then vortexed for 5 min followed by centrifugation at 300 × g for 1 min, then 200 μl of upper phase (hexane phase) was transferred transferred to GC vials and prepared for GC/MS injection. All the experiments were processed in a hood to avoid contamination. The water used for standard preparation was distilled Milli-Q water.
Analyses were carried out on an Agilent 5973 mass spectrometer, linked to a model 6890 gas chromatograph equipped with an autosampler, an Agilent OV-225 capillary column (30 m, 0.32 mm inner diameter). The carrier gas was helium (2 ml/min) with a pulse pressure of 40 PSI. The injection volume was 1 μl with splitless. The injector temperature was set at 200 °C and the transfer line at 250 °C. The GC temperature program was as follows: start at 100 °C, hold for 1 min, increase by 3 °C/min to 145 °C followed by 50 °C/min to 300 °C hold for 5 min. The ion source and the quadrupole were set at 150 °C. The ammonia pressure was adjusted to optimize peak areas. For each analyte, we monitored the signals at the nominal m/z (M0) and at all detectable naturally labeled mass isotopomers with SIM mode. The m/z monitored for formate: 45 (M0) and 46 (M1); acetate: 59 (M0), 60 (M1), 61 (M2) and 63 (M4); propionate 73 (M0), 74 (M1), 75 (M2), 76 (M3) and 78 (M5); butyrate: 87 (M0), 88 (M1), 89 (M2), 90 (M3), 94 (M7); pentanoate: 101 (M0), 102 (M1), 103 (M2), 104 (M3) and 110 (M9).
PFBBr derivatization reaction optimization and isotopomer distribution assay validation
To optimize the PFBBr derivatization reaction with short chain fatty acids, 50 μl of 1 mM of sodium [13C]-formate (M1), sodium [2,2-2H2-1,2-13C2]-acetate (M4), sodium [2,2,3,3,3-2H5]-propionate (M5), sodium [2,2,3,3,4,4,4-2H7]-butyrate (M7), sodium [2,2,3,3,4,4,5,5,5-2H9]-pentanoate (M7) were used in all the optimization experiments. High mass isotopomers can minimize the effects of contamination during the experimental processes since containmination mainly contributes M0. The amount of PFBBr, pH, temperature, reaction time and different organic solvents for extraction were optimized. All of the optimization experiments were prepared in triplicate at each condition and the average was used for comparison.
The focus of the present work is on the measurement of the isotopomer distribution of short chain acids. The precision, accuracy and stability of isotopomer distribution assay were validated by using 100 μl of 1 mM of each unlabeled acid from M0 to M3. The assays were repeated 6 times within the same day (intraday precision) and 3 times over 3 different days (inter-day) to obtain precision and stability. The accuracy was validated by comparing the average of all assays to theoretical values from NIST.
Calculation and statistics
Data was reported as the mean ± SD. Precision was analyzed by the statistical differences between inter-day profiles and was tested using a paired t test (GraphPad Prism Software, version 3). The estimated amount ± 95% confidence limit was obtained as an index of precision. For all analyses, significance was accepted at the level of P < 0.05.
Enrichment correction by matrix method
The isotope enrichment correction by matrix has been reported by Fernandez et al [30]. The details of calculation were briefly described here. The isotope enrichment of analyte from sample is the net increased isotopomer enrichment subtracted from the background of natural isotopomer distribution. The isotopomer distribution is not only from its M-1 but the sum of M-n until M0. For example, M2 is not only from M0 but also M1, the same for M3, M4…Mn… Thus, one can use simple subtraction method for M1. For multiple isotopomer enrichment, matrix calculation is used. Matrix correction has the following major steps.
Use m0, m1 and m2 data from control (unlabeled samples) to build a matrix (equation 1). The first row of matrix is isotope distribution normalized on M0 (m0=m0/m0*100, m1=m1/m0*100, m2=m2/m0*100). The second row of matrix is normalized on M1 (m0,1=m1/m1*100, m1,2=m2/m1*100) and starts from M1, the rests are filled by 0. The third row is normalized on M3 (m0,2=m2/m2*100), the rest of third row are filled by 0.
| (1) |
Then inverse this matrix to obtain the matrix correction factor:
| (2) |
The sample matrix (Ms) consists of the measured m0, m1 and m2 from sample,
| (3) |
Multiply sample matrix (Ms) with correction factor (M−1) to obtain the corrected isotope distribution of samples (Mc).
| (4) |
The corrected isotopomer enrichment of each isotope equals the corrected each isotope data divided by sum of all corrected isotopes.
RESULTS AND DISCUSSIONS
Derivatization optimization
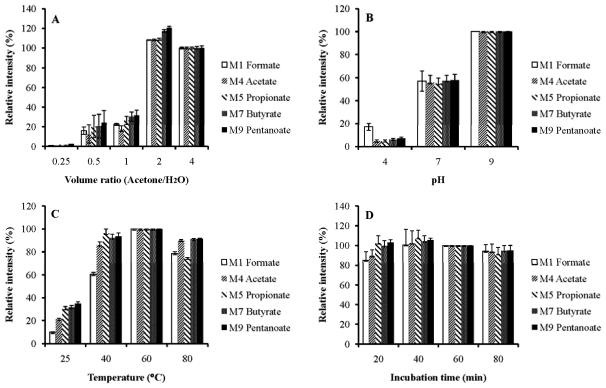
We optimized this derivatization [26] specifically for the purpose of the present work. The PFBBr/acetone solution acted as both the protein precipitate and derivatization agent. The volume of 100 mM PFBBr acetone solution versus standard aquesous solution was optimized. The results showed that two times PFBBr acetone solution gave the highest reaction yield (see Fig. 1A). We also optimized the effect of pH on the reaction. It was found that the highest signal was obtained in the alkaline solution (see Fig. 1 B). Formate ester of PFBBr was found to be unstable in low pH [26]. Our results shows that other esters of PFBBr are also unstable in low pH (see Fig. 1B). No pH was adjusted for perfusate samples with a pH of 7.4, although some sensitivity was lost compared to alkaline condition. We attempted to kept contamination minimal in the sample processing steps since the pH adjustment by buffer introduced short chain acids from other sources (discussed in below). The temperature of the reaction was also optimized. A temperature at 60 C was found to be optimal (Fig. 1C) since the esters are not stable at higher temperatures. The reaction is fast and was found to be completed at 40 min at 60 C (Fig. 1D). All the formed acyl esters are stable at this temperature from 40 to 80 minutes. We compared different organic solvents (hexane, ethyl ester and diethyl ether) for the extraction, and did not find any difference in the extraction yield. However, ethyl ester and diethyl ether had much higher unlabeled formic acid and acetic acid contamination, which certainly dilutes the labeling of acids and underestimates the results.
Fig. 1.
PFBBr esters with isotope labeled short chain acids formed at different conditions. Panel A is at the different volume ratio of 100 mM PFBBR in acetone versus sample volume; panel B is at different pH of phosphoate buffer; panel C is at different reaction temperature; and panel D is at different incubation time at 60 C.
The hexane extracted PFBBr derivatives are stable at room temperature. We didn't observe significant change of these PFBBr derivatives over a 3 week storage period at room temperature. No exact data on stability was given since there is no internal standard applied and the variations of mass spectrometer status. However, any small change in intensity will not affect isotopomer distribution data. This can be demonstrated by the following natural isotopomer distribution of acids inter-day assays.
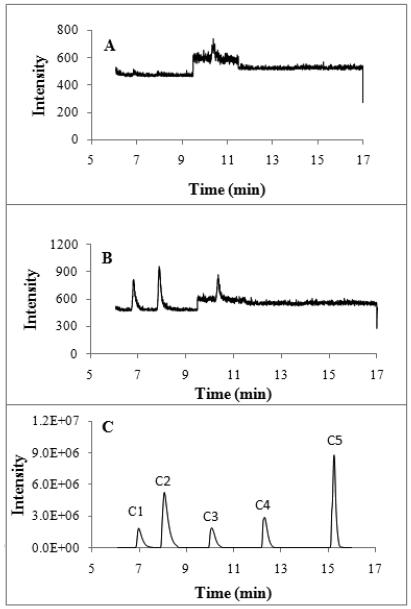
Fig. 2 is the typical GC/MS chromatogram of blank with 100 μl of distilled water, 100 μl of 50 mM phosphate buffer (pH 7) and 100 μl of 1 mM of sodium formate, sodium acetate, sodium propionate, sodium butyrate and sodium pentanoate PFBBr derivatives. The distilled Milli-Q water and phosphate buffer were used to check the contamination. There are no detectable very short chain fatty acids in the present experimental conditions (See Fig. 2A). The phosphate buffer that was prepared in distilled MilliQ water contained formic acid and acetic acid from chemicals or during the buffer preparations (Fig. 2B). All the short chain acid PFBBr derivatives have good retention on the column and they are very well separated (Fig. 2C). The chromatographic resolution (R=2*(t1-t2)/(W1+W2)) between formate-acetate, acetate-propionate, propionate-butyrate and butyrate-pentanoate are 2.3, 1.9, 5.9 and 4.9, respectively.
Fig. 2.
GC/MS chromatogram of PFBBr derivatives of unlabeled formate (C1), acetate (C2), propionate (C3), butyrate (C4) and pentanoate (C5) of 100 μl distilled Milli-Q water (panel A), 100 μl of 50 mM phosphate buffer (pH=7, prepared in distilled Milli-Q water) And the 100 μl of 1 mM of each acid was taken for analysis (panel C). The injection volume is 1 μl with splitless mode. The mass spectrometry is NCI mode with ammonium as reaction gas.
Precision, stability and accuracy of isotopomer distribution assay
Two general approaches are used in the isotopomer enrichment of assays. The first strategy is to build up a calibration curve based on different percentage of the isotopomers. The enrichment data from the sample is then quantified according to the calibration curve [31]. The second strategy is to use the mass isotopomer matrix to correct the natural mass isotopomer distribution from the samples in order to get the enrichment data [30]. The detailed calculation is described in the methods section. The calibration curve has practical difficulties for multiple isotopomer and multiple compound analyses since one needs many different isotopomers for the calibration curves. Thus, the mass isotopomer matrix correction adopted in the present work for isotopomer enrichment assay is relatively simple and practical. The precision and reproducibility are the key points to achieve success with this strategy. We injected 0.2 nmol of unlabeled formic acid, acetic acid, propionic acid, butyric acid and pentanoic acid for the accuracy, precisions and reproducibility experiments. For the reproducibility experiments, we have intra- (within one day n=5) and inter- (at different days, n=3) analysis. The results are shown in the Table 1. The Mn (n=1,2 and 3) data is normalized to the M0 (Mn = Mn peak area/ M0 peak area × 100). The theoretical values are from NIST mass spectrometry data sources. From the results of the intra- and inter-day analysis, this method showed good precision and stability including very low isotopomer distribution of M3 (around 0.02%). The relative standard deviations (RSD) of inter- and intra-day assays for all of isotopomers are lower than 10%. The accuracy of assay compared to theoretical value is around 98-109.5%.
Table 1.
Mass isotopomer distribution of short chain fatty acid standards intra- and inter- days assays
| Formate | Acetate | Propionate | Butyrate | Pentanoate | ||
|---|---|---|---|---|---|---|
| Day 1 (n=6, mean%±SD) |
M1 | 1.22±0.004 | 2.35±0.003 | 3.01±0.016 | 4.64±0.016 | 5.77±0.018 |
| M2 | NA | 0.44±0.002 | 0.47±0.001 | 0.50±0.001 | 0.54±0.002 | |
| M3 | NA | NA | 0.016±0.001 | 0.019±0.001 | 0.023±0.002 | |
|
| ||||||
| Day 2 (n=6, mean%±SD) |
M1 | 1.19±0.078 | 2.30±0.020 | 3.69±0.113 | 4.56±0.014 | 5.65±0.031 |
| M2 | NA | 0.42±0.013 | 0.46±0.008 | 0.49±0.001 | 0.53±0.005 | |
| M3 | NA | NA | 0.01±0.001 | 0.02±0.002 | 0.02±0.002 | |
|
| ||||||
| Day 3 (n=6, mean%±SD) |
M1 | 1.18±0.045 | 2.30±0.011 | 3.79±0.062 | 4.55±0.018 | 5.64±0.021 |
| M2 | NA | 0.42±0.009 | 0.45±0.004 | 0.49±0.003 | 0.53±0.002 | |
| M3 | NA | NA | 0.02±0.001 | 0.02±0.001 | 0.03±0.001 | |
|
| ||||||
| Inter-day average (n=3, mean%±SD) |
M1 | 1.206±0.019 | 2.32±0.024 | 3.50±0.347 | 4.59±0.042 | 5.69±0.060 |
| M2 | NA | 0.42±0.010 | 0.46±0.005 | 0.49±0.007 | 0.54±0.005 | |
| M3 | NA | NA | 0.015±0.0002 | 0.021±0.002 | 0.024±0.001 | |
|
| ||||||
| Theoretical value* (%) |
M1 | 1.20 | 2.34 | 3.48 | 4.62 | 5.76 |
| M2 | NA | 0.42 | 0.44 | 0.48 | 0.54 | |
| M3 | NA | NA | 0.014 | 0.019 | 0.025 | |
|
| ||||||
| Accuracy (%) |
M1 | 99.4 | 98.9 | 100.5 | 99.2 | 98.7 |
| M2 | NA | 102.1 | 103.5 | 102.1 | 100.1 | |
| M3 | NA | NA | 109.4 | 109.5 | 98.9 | |
NA: Not assayed.
Theoretical values are from NIST data.
Acids enrichments from control perfusates
Five control rat livers were perfused only with Krebs-Ringer bicarbonate buffer. The short chain acids in these control perfusates should be unlabeled; therefore they are used to test the present isotopomer enrichment assay. Control sample measurements were repeated on 3 different days, and final average of isotopomer distribution data from inter-day assay was corrected by matrix correction. The results for formate, acetate and propionate are shown in the Table 2. The mass isotopomer distribution data of acids in controls samples are close to the ones of standards, and enrichment after matrix correction is lower than 0.005% (see Table 2). These data confirm no contamination of control samples and accuracy of method.
Table 2.
Mass isotopomer distribution and enrichments (after matrix correction) of acids in control samples
| Formate | acetate | Propionate | ||
|---|---|---|---|---|
| Day 1 (n=5, mean%±SD) |
M1 | 1.20±0.07 | 2.25±0.09 | 3.45±0.1 |
| M2 | NA | 0.41±0.03 | 0.46±0.02 | |
| M3 | NA | NA | 0.016±0.001 | |
|
| ||||
| Day2 (n=5, mean%±SD) |
M1 | 1.20±0.06 | 2.25±0.04 | 3.42±0.1 |
| M2 | NA | 0.41±0.04 | 0.44±0.02 | |
| M3 | NA | NA | 0.014±0.002 | |
|
| ||||
| Day3 (n=5, mean%±SD) |
M1 | 1.22±0.02 | 2.24±0.05 | 3.55±0.08 |
| M2 | NA | 0.41±0.03 | 0.42±0.03 | |
| M3 | NA | NA | 0.015±0.002 | |
|
| ||||
| Inter-day average (n=3, mean%±SD) |
M1 | 1.21±0.01 | 2.25±0.07 | 3.47±0.07 |
| M2 | NA | 0.41±0.002 | 0.44±0.02 | |
| M3 | NA | NA | 0.015±0.001 | |
|
| ||||
| Enrichment* (%, after matrix correction) |
M1 | 0.0006 | −0.07 | −0.03 |
| M2 | NA | 0.005 | −0.01 | |
| M3 | NA | NA | 0.001 | |
NA: Not assayed.
Enrichment data is inter-day average corrected by matrix method.
Acetic acid enrichment from [3,4-13C2]-4-hydroxynonanoate rat liver perfusates
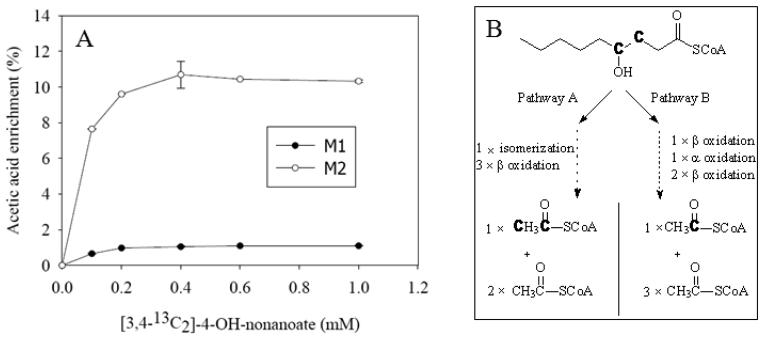
4-Hydroxynonanoate is a metabolite of 4-hydroxynonenal that is one of the lipid peroxidation products. Two catabolic pathways of 4-hydroxynonanoate in rat liver were identified by specifically designed 13C labeled 4-hydroxynonanoate, i.e., [3,4-13C2]-4-hydroxynonanoate [7;28]. [3,4-13C2]-4-hydroxynonanoate is degraded into M1 acetyl-CoA via pathway B and M2 acetyl-CoA via pathway A (Fig. 3B). The present GC/MS assay for the acetic acid derivatized by PFBBr from the perfusate samples showed the similar results of acetyl-CoA from rat liver tissues perfused with 0 to 1 mM [3,4-13C2]-4-hydroxynonanoate (Fig. 3A). The difference of enrichment between free acetic acid from the perfusates and acetyl-CoA from liver tissues is that free acetic acid enrichment is a little lower than acetyl-CoA, which can be explained by the small dilution of unlabeled acetic acid from other sources instead of hydrolysis of acetyl-CoA, such as de-acetylation and ethanol oxidation, etc [32]. Despite the dilution by the unlabeled acetic acid, the isotopomer enrichment of acetic acid from the perfusate perfused with [3,4-13C2]-4-hydroxynonanoate increased with increasing concentration of [3,4-13C2]-4-hydroxynonanoate and reached plateau after 0.4 mM of [3,4-13C2]-4-hydroxynonanoate, which is similar to the acetyl-CoA data [7;28]. However, the labeling of acetate assay is much easier than the acetyl-CoA labeling measurement by LC-MS/MS [7;28;33].
Fig. 3.
Acetic acid isotopomer enrichment in perfusate samples of rat liver perfused with increasing concentrations of [3,4-13C2]-4-hydroxynonanoate (a). The catabolic pathway scheme of [3,4-13C2]-4-hydroxynonanoate in the rat liver (b), “C” in bold represents 13C labeled carbon.
Propionic acid and acetic acid enrichments from [5,6,7-13C3]heptanoate rat liver perfusates
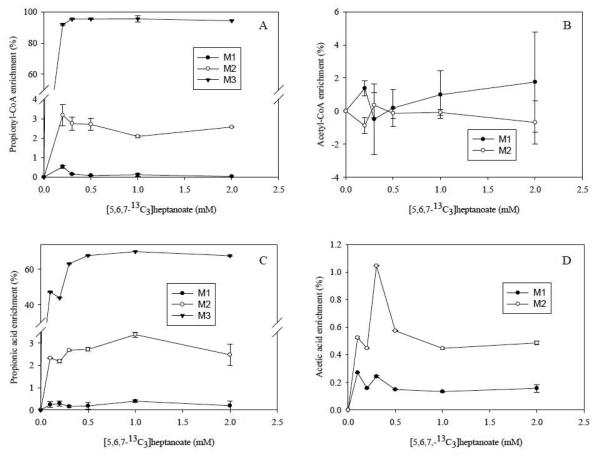
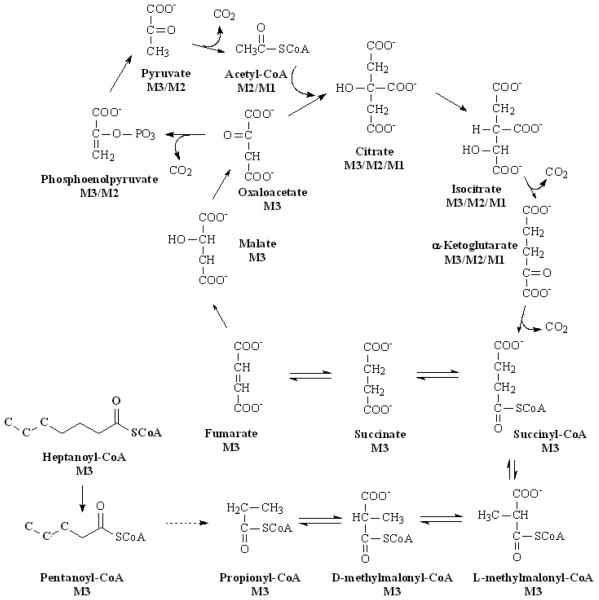
The β-oxidation of heptanoic acid produces propionyl-CoA that can covert to succinyl-CoA via methylmalonyl-CoA. Propionyl-CoA is an anaplerotic substrate that can compensate for the CAC intermediate leaks. We perfused rat livers with various concentrations of [5,6,7-13C3]heptanoate. The M3 propionyl-CoA was found in high abundance (around 90%) after concentrations above 0.2 mM [5,6,7-13C3]heptanoate (see Fig. 4A). M1 and M2 of propionyl-CoA were also found to be enriched although their enrichments were low (0.1% for M1 and 2-3% for M2, Fig. 4A). The M1 and M2 of propionyl-CoA are from the two possible sources. The first is from reverse reaction of succinic acid to succinyl-CoA, then to methyl-malonyl-CoA that loses one carbon to form propoionyl-CoA. M2 propioinyl-CoA is formed if labeled carbon is lost from methyl-malonyl-CoA. The second source of M1 and M2 propionyl-CoA is from the M1 or M2 succinyl-CoA that is from M1 or M2 acetyl-CoA. The M1 and M2 acetyl-CoA comes from the following pathways: M3 succinate → M3 fumarate → M3 malate → M3 oxaloacetate → M2 or M3 phosphoenpyruvate (one carbon loss) → M2 or M3 pyruvate → M1 or M2 acetyl-CoA (Fig. 5). Fig. 5 shows the first round metabolic fates of M3 propionyl-CoA and metabolites labeling after it enters CAC. The acetyl-CoA labeling can be confirmed by our acetic acid labeling results (Fig. 4B.). However, since acetyl-CoA has higher natural isotopomer background (M1 and M2 are 30.2 and 12.2 %), it is difficult to quantitatively measure enrichment increasing lower than 1% (Fig. 4B). GC/MS assay of acetate showed the small enrichment of acetic acid (M1 acetate is around 0.2% and M2 acetate is around 0.6%) from [5,6,7-13C3]heptanoate clearly and significantly (Fig. 4D).
Fig. 4.
The mass isotopomer enrichments results from [5,6,7-13C3]hetpanoate rat liver perfusion experiments. (a) M1, M2 and M3 of propionyl-CoA from liver tissues, (b) M1 and M2 of acetyl-CoA from liver tissues, (c) M1, M2 and M3 of propionic acid in the perfusates (d) M1 and M2 of acetic acid in the perfusates.
Fig. 5.
The metabolic scheme of M1, M2 and M3 propionyl-CoA coming from the [5,6,7-13C3]-hetpanoate metabolism. The first round [5,6,7-13C3]heptanoate metabolism forms M1, M2 and M3 CAC intermediates. And further metabolism of M1, M2 and M3 CAC intermediates produce M1, M2 and M3 succinyl-CoA that can reversibly form M1 and M2 propionyl-CoA.
From the free propionic acid labeling measurement, the same enrichment pattern was found for M1, M2 and M3 propionic acid where enrichment reached 0.2, 3 and 69%, respectively (Fig. 4C). The lowered amount of M3 propionic acid compared to propionyl-CoA is possible because of the dilution by unlabeled propionic acid. The isotopomer enrichment data of propionic acid again demonstrated that it is comparable to propionyl-CoA with higher precision in lower enrichment measurement.
CONCLUSION
A simple, sensitive and precise GC/MS assay for the very short chain fatty acids isotope enrichment has been developed for the rat liver perfusates. This method has been optimized and successfully used to measure the labeling of acetic acid and propionic acid in the perfusates of rat liver perfused with different concentrations of [3,4-13C2]-4-hydroxynonanoate and [5,6,7-13C3]heptanoate. The mass isotope enrichments of free fatty acids are comparable with the corresponding acyl-CoAs but with higher sensitivity (this method can measure 0.2% enrichment of acetic acid. Practically, it can be applied to plasma and urine samples, although plasma and urine have not been tested in this work. However, caution needs to be taken to avoid easy contamination of very short chain fatty acids. Other potential sources of short chain fatty acids include air, water, chemicals, etc, especially when assaying formate.
Acknowledgements
This work was supported, in whole or in part, by National Institutes of Health Roadmap Grant R33DK070291 and Grant R01ES013925 (to Henri Brunengraber, Dept of Nutrition, Case Western Reserve University) and R01HL053315 to G.P.T. This work was also supported by a grant from the Cleveland Mt. Sinai Health Care Foundation.
The abbreviations used are
- PFBBr
Pentafluorobenzyl bromide
- NCI
negative chemical ionization
- CAC
citric acid cycle
Footnotes
Publisher's Disclaimer: This is a PDF file of an unedited manuscript that has been accepted for publication. As a service to our customers we are providing this early version of the manuscript. The manuscript will undergo copyediting, typesetting, and review of the resulting proof before it is published in its final citable form. Please note that during the production process errors may be discovered which could affect the content, and all legal disclaimers that apply to the journal pertain.
Nomenclature and abbreviations:
Mass isotopomers are designated as M0, M1, M2…Mn, where n is the number of heavy atoms in the molecule.
Reference List
- 1.Brunengraber H, Kelleher JK, Des RC. Applications of mass isotopomer analysis to nutrition research. Annu.Rev.Nutr. 1997;17:559–596. doi: 10.1146/annurev.nutr.17.1.559. [DOI] [PubMed] [Google Scholar]
- 2.Hellerstein MK, Neese RA. Mass isotopomer distribution analysis at eight years: theoretical, analytic, and experimental considerations. Am.J.Physiol. 1999;276:E1146–E1170. doi: 10.1152/ajpendo.1999.276.6.E1146. [DOI] [PubMed] [Google Scholar]
- 3.Hiller K, Metallo CM, Kelleher JK, Stephanopoulos G. Nontargeted Elucidation of Metabolic Pathways Using Stable-Isotope Tracers and Mass Spectrometry. Anal.Chem. 2010 doi: 10.1021/ac1011574. [DOI] [PubMed] [Google Scholar]
- 4.Parks EJ, Hellerstein MK. Thematic review series: patient-oriented research. Recent advances in liver triacylglycerol and fatty acid metabolism using stable isotope labeling techniques. J.Lipid Res. 2006;47:1651–1660. doi: 10.1194/jlr.R600018-JLR200. [DOI] [PubMed] [Google Scholar]
- 5.Tang YJ, Martin HG, Myers S, Rodriguez S, Baidoo EE, Keasling JD. Advances in analysis of microbial metabolic fluxes via (13)C isotopic labeling. Mass Spectrom.Rev. 2009;28:362–375. doi: 10.1002/mas.20191. [DOI] [PubMed] [Google Scholar]
- 6.ZHang GF, Sadhukhan S, Tochtrop GP, Brunengraber H. Metabolomics, pathway regulation and pathway discovery. J.Biol.Chem. 2010 doi: 10.1074/jbc.R110.171405. in press. [DOI] [PMC free article] [PubMed] [Google Scholar]
- 7.Zhang GF, Kombu RS, Kasumov T, Han Y, Sadhukhan S, Zhang J, Sayre LM, Ray D, Gibson KM, Anderson VA, Tochtrop GP, Brunengraber H. Catabolism of 4-hydroxyacids and 4-hydroxynonenal via 4-hydroxy-4-phosphoacyl-CoAs. J.Biol.Chem. 2009;284:33521–33534. doi: 10.1074/jbc.M109.055665. [DOI] [PMC free article] [PubMed] [Google Scholar]
- 8.Gasier HG, Fluckey JD, Previs SF. The application of 2H2O to measure skeletal muscle protein synthesis. Nutr.Metab (Lond) 2010;7:31. doi: 10.1186/1743-7075-7-31. [DOI] [PMC free article] [PubMed] [Google Scholar]
- 9.Gasier HG, Previs SF, Pohlenz C, Fluckey JD, Gatlin DM, III, Buentello JA. A novel approach for assessing protein synthesis in channel catfish, Ictalurus punctatus. Comp Biochem.Physiol B Biochem.Mol.Biol. 2009;154:235–238. doi: 10.1016/j.cbpb.2009.06.012. [DOI] [PubMed] [Google Scholar]
- 10.Previs SF, Brunengraber H. Methods for measuring gluconeogenesis in vivo. Curr.Opin.Clin.Nutr.Metab Care. 1998;1:461–465. doi: 10.1097/00075197-199809000-00016. [DOI] [PubMed] [Google Scholar]
- 11.Hasunuma T, Harada K, Miyazawa S, Kondo A, Fukusaki E, Miyake C. Metabolic turnover analysis by a combination of in vivo 13C-labelling from 13CO2 and metabolic profiling with CEMS/MS reveals rate-limiting steps of the C3 photosynthetic pathway in Nicotiana tabacum leaves. J.Exp.Bot. 2010;61:1041–1051. doi: 10.1093/jxb/erp374. [DOI] [PMC free article] [PubMed] [Google Scholar]
- 12.Kombu RS, Zhang GF, Abbas R, Mieyal JJ, Anderson VE, Kelleher JK, Sanabria JR, Brunengraber H. Dynamics of glutathione and ophthalmate traced with 2H-enriched body water in rats and humans. Am.J.Physiol Endocrinol.Metab. 2009;297:E260–E269. doi: 10.1152/ajpendo.00080.2009. [DOI] [PMC free article] [PubMed] [Google Scholar]
- 13.Wang B, Sun G, Anderson DR, Jia M, Previs S, Anderson VE. Isotopologue distributions of peptide product ions by tandem mass spectrometry: quantitation of low levels of deuterium incorporation. Anal.Biochem. 2007;367:40–48. doi: 10.1016/j.ab.2007.03.036. [DOI] [PMC free article] [PubMed] [Google Scholar]
- 14.Bequette BJ, Sunny NE, El-Kadi SW, Owens SL. Application of stable isotopes and mass isotopomer distribution analysis to the study of intermediary metabolism of nutrients. J.Anim Sci. 2006;84(Suppl):E50–E59. doi: 10.2527/2006.8413_supple50x. [DOI] [PubMed] [Google Scholar]
- 15.Birkemeyer C, Luedemann A, Wagner C, Erban A, Kopka J. Metabolome analysis: the potential of in vivo labeling with stable isotopes for metabolite profiling. Trends Biotechnol. 2005;23:28–33. doi: 10.1016/j.tibtech.2004.12.001. [DOI] [PubMed] [Google Scholar]
- 16.Hellerstein MK, Murphy E. Stable isotope-mass spectrometric measurements of molecular fluxes in vivo: emerging applications in drug development. Curr.Opin.Mol.Ther. 2004;6:249–264. [PubMed] [Google Scholar]
- 17.Lane AN, Fan TW, Xie Z, Moseley HN, Higashi RM. Isotopomer analysis of lipid biosynthesis by high resolution mass spectrometry and NMR. Anal.Chim.Acta. 2009;651:201–208. doi: 10.1016/j.aca.2009.08.032. [DOI] [PMC free article] [PubMed] [Google Scholar]
- 18.Murarka A, Clomburg JM, Moran S, Shanks JV, Gonzalez R. Metabolic analysis of wild-type Escherichia coli and a pyruvate dehydrogenase complex (PDHC)-deficient derivative reveals the role of PDHC in the fermentative metabolism of glucose. J.Biol.Chem. 2010;285:31548–31558. doi: 10.1074/jbc.M110.121095. [DOI] [PMC free article] [PubMed] [Google Scholar]
- 19.Paul Lee WN, Wahjudi PN, Xu J, Go VL. Tracer-based metabolomics: concepts and practices. Clin.Biochem. 2010;43:1269–1277. doi: 10.1016/j.clinbiochem.2010.07.027. [DOI] [PMC free article] [PubMed] [Google Scholar]
- 20.Wijnen JP, Van der GM, Scheenen TW, Klomp DW, de Galan BE, Idema AJ, Heerschap A. In vivo 13C magnetic resonance spectroscopy of a human brain tumor after application of 13C-1-enriched glucose. Magn Reson.Imaging. 2010;28:690–697. doi: 10.1016/j.mri.2010.03.006. [DOI] [PubMed] [Google Scholar]
- 21.Fries E, Klasmeier J. Analysis of potassium formate in airport storm water runoff by headspace solid-phase microextraction and gas chromatography-mass spectrometry. J.Chromatogr.A. 2009;1216:879–881. doi: 10.1016/j.chroma.2008.11.052. [DOI] [PubMed] [Google Scholar]
- 22.Kim JK, Shiraishi T, Fukusaki E, Kobayashi A. Quantitation of formate by solid-phase microextraction and gas chromatography--mass spectrometry utilizing a [13C]formate internal standard. J.Chromatogr.A. 2003;986:313–317. doi: 10.1016/s0021-9673(02)01996-9. [DOI] [PubMed] [Google Scholar]
- 23.del Barrio MA, Hu J, Zhou P, Cauchon N. Simultaneous determination of formic acid and formaldehyde in pharmaceutical excipients using headspace GC/MS. J.Pharm.Biomed.Anal. 2006;41:738–743. doi: 10.1016/j.jpba.2005.12.033. [DOI] [PubMed] [Google Scholar]
- 24.Powers L, Osborn MK, Yang DW, Kien CL, Murray RD, Beylot M, Brunengraber H. Assay of the Concentration and Stable-Isotope Enrichment of Short-Chain Fatty-Acids by Gas-Chromatography Mass-Spectrometry. Journal of Mass Spectrometry. 1995;30:747–754. [Google Scholar]
- 25.Rasanen I, Viinamaki J, Vuori E, Ojanpera I. Headspace in-tube extraction gas chromatography-mass spectrometry for the analysis of hydroxylic methyl-derivatized and volatile organic compounds in blood and urine. J.Anal.Toxicol. 2010;34:113–121. doi: 10.1093/jat/34.3.113. [DOI] [PubMed] [Google Scholar]
- 26.Kage S, Kudo K, Ikeda H, Ikeda N. Simultaneous determination of formate and acetate in whole blood and urine from humans using gas chromatography-mass spectrometry. J.Chromatogr.B Analyt.Technol.Biomed.Life Sci. 2004;805:113–117. doi: 10.1016/j.jchromb.2004.02.029. [DOI] [PubMed] [Google Scholar]
- 27.Brunengraber H, Roe CR. Anaplerotic molecules: current and future. J.Inherit.Metab Dis. 2006;29:327–331. doi: 10.1007/s10545-006-0320-1. [DOI] [PubMed] [Google Scholar]
- 28.Sadhukhan S, Han Y, Zhang GF, Brunengraber H, Tochtrop GP. Using isotopic tools to dissect and quantitate parallel metabolic pathways. J.Am.Chem.Soc. 2010;132:6309–6311. doi: 10.1021/ja100399m. [DOI] [PMC free article] [PubMed] [Google Scholar]
- 29.Deng S, Zhang GF, Kasumov T, Roe CR, Brunengraber H. Interrelations between C4 ketogenesis, C5 ketogenesis, and anaplerosis in the perfused rat liver. J.Biol.Chem. 2009;284:27799–27807. doi: 10.1074/jbc.M109.048744. [DOI] [PMC free article] [PubMed] [Google Scholar]
- 30.Fernandez CA, DesRosiers C, Previs SF, David F, Brunengraber H. Correction of C-13 mass isotopomer distributions for natural stable isotope abundance. Journal of Mass Spectrometry. 1996;31:255–262. doi: 10.1002/(SICI)1096-9888(199603)31:3<255::AID-JMS290>3.0.CO;2-3. [DOI] [PubMed] [Google Scholar]
- 31.David F, Beylot M, Reider MW, Anderson VE, Brunengraber H. Assay of the Concentration and C-13 Enrichment of Acetate and Acetyl-Coa by Gas-Chromatography Mass-Spectrometry. Analytical Biochemistry. 1994;218:143–148. doi: 10.1006/abio.1994.1153. [DOI] [PubMed] [Google Scholar]
- 32.Shimazu T, Hirschey MD, Huang JY, Ho LT, Verdin E. Acetate metabolism and aging: An emerging connection. Mech.Ageing Dev. 2010 doi: 10.1016/j.mad.2010.05.001. [DOI] [PubMed] [Google Scholar]
- 33.Minkler PE, Kerner J, Ingalls ST, Hoppel CL. Novel isolation procedure for short-, medium-, and long-chain acyl-coenzyme A esters from tissue. Anal.Biochem. 2008;376:275–276. doi: 10.1016/j.ab.2008.02.022. [DOI] [PMC free article] [PubMed] [Google Scholar]


