

Abstract
Plants can defend themselves against a wide array of enemies, yet one of the most striking observations is the variability in the effectiveness of such defences, both within and between species. Some of this variation can be explained by conflicting pressures from pathogens with different modes of attack1. A second explanation comes from an evolutionary tug of war, in which pathogens adapt to evade detection, until the plant has evolved new recognition capabilities for pathogen invasion2-5. If selection is, however, sufficiently strong, susceptible hosts should remain rare. That this is not the case is best justified by costs incurred from constitutive defences in a pest free environment6-11. Using a combination of forward genetics and genome-wide association analyses, we demonstrate that allelic diversity at a single locus, ACCELERATED CELL DEATH 6 (ACD6)12,13, underpins dramatic pleiotropic differences in both vegetative growth and resistance to microbial infection and herbivory among natural Arabidopsis thaliana strains. A hyperactive ACD6 allele, compared to the reference allele, strongly enhances resistance to a broad range of pathogens from different phyla, but at the same time slows the production of new leaves and greatly reduces the biomass of mature leaves. This allele segregates at intermediate frequency both throughout the worldwide range of A. thaliana and within local populations, consistent with this allele providing substantial fitness benefits despite its drastic impact on growth.
A survey of A. thaliana accessions collected from the wild revealed extensive environment-dependent variation for leaf initiation rate (Supplementary Table 1). One of the strains, Est-1, which produced leaves more slowly than the Col-0 reference strain, also developed extensive necrosis on fully expanded leaves (Fig. 1a,b). Using a Recombinant Inbred Line (RIL) population14, we identified single major-effect QTL for both leaf initiation rate and late-onset leaf necrosis (Fig. 1c), with the Est-1 alleles acting in a semi-dominant manner. We fine-mapped both QTL to the same 12 kb region (Supplementary Fig. 1). We targeted the four protein-coding genes in this interval, At4g14400, At4g14410, At4g14420 and At4g14430, with artificial miRNAs (amiRNAs)15. Knocking down At4g14400, previously identified as ACCELERATED CELL DEATH6 (ACD6)12, suppressed late-onset necrosis and accelerated leaf initiation in Est-1 (Fig. 1a,b, Supplementary Fig. 2a), while down-regulation of the other three genes had no visible effects. We also transformed acd6-2 loss-of-function plants in the Col-0 background with an ACD6 genomic fragment from Est-1, and found that these plants suffered from late-onset necrosis (Fig. 1a). This was not the case when we used a Col-0 genomic fragment (Supplementary Fig. 3a). Thus, ACD6 is responsible for the leaf initiation and necrosis QTL.
Figure 1. Identification of a natural ACD6 allele affecting growth and defence traits.

a, Top, rosettes of six-week old plants. Bottom, close-up of 12th leaf, stained with Trypan blue for dead cells. gACD6.Est is an acd6-2 mutant in Col-0 (which is morphologically normal; Supplementary Fig. 3) transformed with an Est-1 genomic fragment. b, Leaf initiation rates. c, QTL maps. Dashed black line indicates significance threshold, and ticks positions of genetic markers14. d, PR1 expression in the 6th leaf (two biological replicates each), normalized to those in 12-day old Est-1 plants. e, PR1 expression in different genotypes. f, Leaf initiation rates. g, SA content in the sixth leaf of 35-day old plants. Only wild type Est-1 was significantly different from any of the other lines (p<0.005). The 35S::amiR-ACD6 construct had no effect on SA levels in Col-0. Standard errors are indicated. Size bars in a = 1 cm (top), and 1 mm (bottom).
ACD6 encodes a transmembrane protein with cytosolic ankyrin repeats12,13. An EMS-induced gain-of-function allele in Col-0, acd6-1, which changes a single amino acid in the transmembrane domain12,16, is characterized by spontaneous cell death. In acd6-1 and several other so-called lesion mimic mutants, this is associated with constitutive activation of defence pathways and increased resistance to microbial infection17, although the relationship between cell death and disease resistance is complex. Local cell death, known as the hypersensitive response, is a common consequence of pathogen recognition by genotypes with inducible immunity18. Not all lesion-mimic mutants, however, are more resistant to pathogen attack than wild type17, and effective disease resistance is largely uncoupled from cell death in disease no death 1 mutants19.
Similar to acd6-1 mutants, Est-1 plants had macroscopic lesions and microscopic cell death (Fig. 1a). Also like acd6-1, PR1 and other genes mediating the response to biotic stresses were expressed much more highly in Est-1 than in Col-0 wild-type plants, and this was reproduced by transforming the Est-1 allele of ACD6 into acd6-2 loss-of-function mutants (Fig. 1d,e; Supplementary Fig. 2b). Conversely, acd6-1 produced leaves more slowly than wild-type Col-0, thus mimicking Est-1 (Fig. 1f). ACD6 acts in a feed-forward loop that regulates the accumulation of SA, a key molecule in pathogen defence signalling13,16. Accordingly, conversion of SA to catechol by transgenic expression of the bacterial salicylate hydroxylase gene, nahG (ref. 20), strongly attenuates acd6-1 phenotypes12,16,21. Est-1 plants had higher SA levels than Col-0, and these were strongly reduced by knocking down ACD6 (Fig. 1g). As for acd6-1, nahG expression suppressed necrosis in Est-1 (Supplementary Fig. 4).
ACD6 RNA expression in leaves increased with age, with ACD6 levels rising earlier in Est-1 than in Col-0 (Supplementary Fig. 2c). PR1 expression followed a similar profile only in Est-1 (Fig. 1d). PR1 levels in Est-1 were reduced after knockdown of ACD6 with the amiR-ACD6 construct (Supplementary Fig. 2d). Conversely, PR1 expression in acd6-2 loss-of-function mutants transformed with an Est-1 genomic fragment was three orders of magnitude higher than in acd6-2 transformed with a Col-0 fragment, despite similar ACD6 levels (Fig. 1e; Supplementary Fig. 3b). The Col-0 and Est-1 proteins differ at 24 out of 670 amino acids (Supplementary Fig. 5). Expressing ACD6 coding sequences from Est-1 under control of the Col-0 promoter was sufficient to produce an Est-1-like phenotype in acd6-2, while the opposite configuration did not cause any symptoms (Supplementary Fig. 6). We conclude that changes in the protein sequence explain much of the differences in ACD6 activity between Est-1 and Col-0, which was further confirmed by expressing both alleles from a foreign promoter (Supplementary Fig. 2e,f).
acd6-1 plants not only have necrotic lesions, but are also small12,16,21. Both the amiR-ACD6 transgene and nahG expression caused a dramatic increase, of more than 50%, in the weight of Est-1 leaves. The difference between wild-type and 35S::amiR-ACD6 or 35S::nahG Est-1 plants was similar to that between acd6-1 and its Col-0 parent. In contrast, the 35S::amiR-ACD6 and 35S::nahG transgenes had only minor effects on Col-0 (Fig. 2a). Similarly, introduction of the Est-1, but not the Col-0 ACD6 allele, into acd6-2 loss-of-function mutants strongly reduced leaf weight (Supplementary Fig. 3c). Altered ACD6 activity in Est-1 thus has additive effects on total biomass, by slowing the rate at which new leaves are produced, and by limiting the final size of individual leaves.
Figure 2. Effects of a natural ACD6 allele on leaf biomass, pathogen susceptibility and metabolite content.
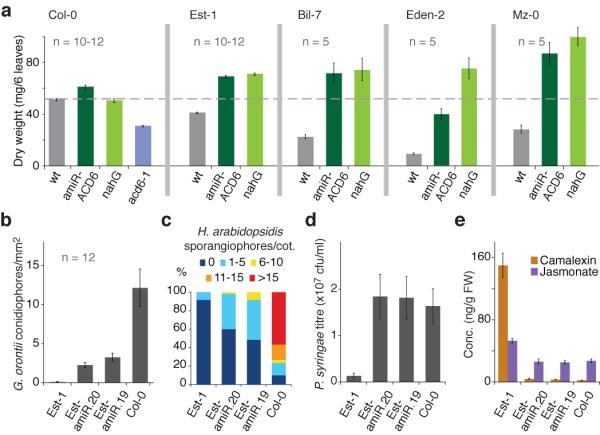
a, Leaf biomass. The difference between wild type and transgenic lines was significant for all accessions but Col-0 (p<0.001). b, G. orontii T1 conidiophores on four-week old plants (5 dpi). c, H. arabidopsidis Noco2 sporangiophores on 2-week old seedlings (5 dpi). d, P. syringae DC3000 growth. 35S::amiR-ACD6 did not affect susceptibility of Col-0. e, Camalexin and jasmonate concentrations. The difference between Est-1 and the other genotypes was significant (p<0.005). Standard errors are indicated.
acd6-1 mutants display enhanced resistance to Pseudomonas syringae pv. tomato DC3000, a hemi-biotrophic pathogen16. We isolated a biotrophic fungus, powdery mildew Golovinomyces orontii T1, from spontaneous infections of A. thaliana in Tübingen. Est-1 was resistant to this isolate, which easily infected many other accessions including Col-0. Resistance was genetically linked to the ACD6 region (Supplementary Fig. 1f), and knocking down ACD6 caused Est-1 to become susceptible to infection by G. orontii (Fig. 2b, 3a,b). Increased susceptibility of 35S::amiR-ACD6 Est-1 plants was also seen for G. cichoracearum UCSC1 (Fig. 3c), and for two other biotrophic pathogens, the downy mildew Hyaloperonospora arabidopsidis Noco2, an oomycete (Fig. 2c, 3d; Supplementary Fig. 7), and the bacterium P. syringae DC3000 (Fig. 2d).
Figure 3. Effects of a natural ACD6 allele on pathogen susceptibility.
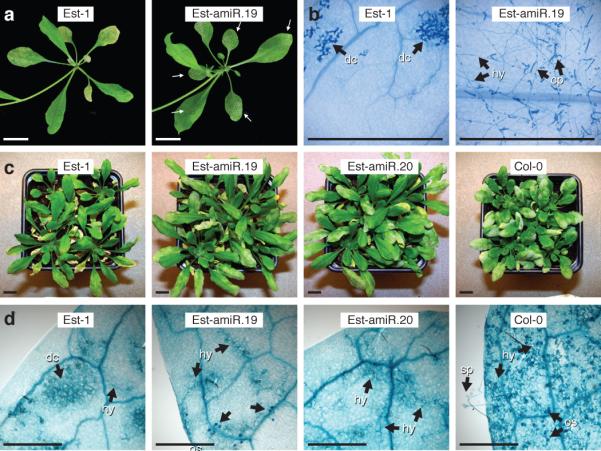
a, Infection of four-week old plants by G. orontii T1 (5 dpi). Arrows indicate fungal growth. b, Trypan blue staining of inoculated leaves. Dead plant cells (dc), hyphae (hy) and mature conidiophores (cp) are indicated. c, Infection of six-week old plants with G. cichoracearum UCSC1 (10 dpi). Note increasing severity of infection symptoms from left to right. d, Five-week old plants inoculated with H. arabidopsidis Noco 2. Trypan blue staining of the 4th leaf (7 dpi) is shown. Hyphal growth (hy), which was seldom observed in Est-1, as well as oosporangia (os) were common in 35S::amiR-ACD6 Est-1 plants. See Supplementary Fig. 8 for adult leaves. In Col-0, many sporangiophores (sp) were seen. For both powdery and downy mildews, pathogen susceptibility and ACD6 expression levels in 35S::amiR-ACD6 lines were correlated ( see Supplementary Fig. 2a). Size bars = 1 cm in a and c, 1 mm in b and d.
Variation in leaf weight associated with differences in SA content is positively correlated with several fitness-related traits, such as seed yield, in A. thaliana22. The increased resistance to biotrophic pathogens conditioned by the Est-1 allele of ACD6 suggests that this allele can provide environment-dependent fitness advantages and may therefore not be rare, despite its negative effects on biomass. Across 96 strains from throughout the world-wide range of A. thaliana23, 71 accessions had ACD6 alleles similar to those of Est-1 and Col-0 (Fig. 4a). The 73 strains featured a total of 141 non-synonymous substitutions, of which 67 were located in the ankyrin repeats and 17 in the predicted transmembrane domains (Supplementary Fig. 5, 8a,b). Most of the remaining strains had an ACD6 allele, exemplified by KZ-10, that was as divergent from the Col-0 reference allele as it was from the MN47 strain of Arabidopsis lyrata (Fig. 4a,b). The relationship among the three alleles as well as At4g14390, a homolog immediately upstream of ACD6, is complex, and might involve a history of gene conversion.
Figure 4. ACD6 sequence diversity in Arabidopsis.

a, Hierarchical clustering of ACD6 alleles. Col-0 and Est-1 are indicated with arrows, and Est-1-like sequences are highlighted. Yellow indicates mild, orange intermediate, and red severe late-onset necrosis. KZ-10-like alleles are gray. b, Pair-wise identity of ACD6 alleles. c, Whole-genome scan of 216,130 SNPs for association with necrosis across 96 accessions shown in a24. d, Genomic region containing nine of 15 SNPs with lowest p-values. e, Polymorphism and divergence levels at ACD6 (see also Supplementary Fig. 8, 10; Supplementary Table 6). Blue lines indicate non-synonymous SNPs shared among Est-1-like alleles, and Fab-2 and Fab-4 (Supplementary Fig. 5). The two causal SNPs (see f) are indicated by asterisks, as is the acd6-1 mutation. f, Six-week old acd6-2 plants transformed with modified genomic clones of ACD6, in which two codons were swapped between Est-1 and Col-0. See also Supplementary Fig. 7. Compare to Fig. 1a and Supplementary Fig. 3a for unmutated versions. Size bars = 1 cm.
Eighteen accessions shared ACD6 sequences closely related to the Est-1-like allele. All except two of these strains suffered from symptoms similar to Est-1, while necrosis was rare among the other 77 strains (Fig. 4a, 5a; Supplementary Fig. 9a; Supplementary Table 2). These observations are consistent with the identification of the ACD6 region in a genome-wide association scan for loci causing necrosis in the same set of 96 accessions24. Nine of the 15 SNPs with the lowest p-values in the genome-wide scan mapped to the ACD6 region, and most were within or next to ACD6 (Fig. 4c,d). The predominance of the peak near ACD6 in the genome-wide scan demonstrates that allelic variation at this locus is the major determinant of global variation for this trait.
Figure 5. Correlation between late-onset necrosis, growth and defence traits.

a, Late-onset necrosis in accessions with an Est-1-like ACD6 allele is suppressed by 35::amiR-ACD6, or by nahG-mediated SA depletion. See Supplementary Fig. 9 for additional accessions. b, Correlation between late-onset necrosis and different traits across 96 accessions used for genome-wide association studies24. Lesioning scores reflect the range of symptoms indicated in Fig. 4a. Size bars = 2 cm for rosettes, 1 mm for micrographs.
The group of Est-1-like alleles shared three non-synonymous substitutions in the transmembrane region (Fig. 4e; Supplementary Fig. 5, 8a,b). This region also stood out because of its excess of non-synonymous over synonymous substitutions between Col-0 and Est-1, which contrasts with this segment being highly conserved in an interspecific comparison (Fig. 4e; Supplementary Fig. 8c,d, 10). An exchange of two of these non-synonymous substitutions between Est-1 and Col-0 genomic clones demonstrated that they were both necessary and sufficient for strong late-onset necrosis and activation of immune reactions (Fig. 4f; Supplementary Fig. 6b,c).
We crossed several Est-1-like accessions to the Col-0 reference strain, and confirmed in F2 populations that ACD6 co-segregated with necrosis (Supplementary Table 2). Both reduction of SA using the 35S::nahG transgene and amiRNA-mediated knockdown of ACD6 suppressed late-onset necrosis and increased leaf biomass in several strains (Fig. 2a, 5a; Supplementary Fig. 9; Supplementary Table 2), confirming increased activity of ACD6 in these accessions.
We have shown that the Est-1-like ACD6 allele has dramatic effects on leaf biomass, late-onset necrosis and pathogen susceptibility. In the collection of 96 strains, we observed strong negative correlation of late-onset necrosis not only with leaf biomass, but also with resistance to G. orontii T1 and P. syringae DC3000, and with the extent to which proliferation of the aphid Myzus persicae was supported (Fig. 5b). Interestingly, while SNPs in the ACD6 region were strongly associated with necrosis in a genome-wide scan, associations with leaf biomass as well as G. orontii and M. persicae resistance were much weaker, and not significant at all for DC3000 growth24 (Supplementary Tables 3, 4, 5). Including necrosis as a co-factor in genome-wide scans revealed additional associations outside the ACD6 region (Supplementary Fig. 11), suggesting that other factors can mask the effects of ACD6 on disease resistance.
Despite the strong sequence differentiation between the two clades of ACD6 alleles, there is no obvious geographic structure to their distribution, and FST values do not deviate from the genome-wide pattern23 (Supplementary Fig. 12). We also analyzed a local collection of 890 A. thaliana individuals representing 202 distinct multi-locus genotypes from the Tübingen region25. All three allele types defined by function or sequence, Col-0-like, Est-1-like and KZ-10-like, were present throughout the region, and often co-occurred (Supplementary Fig. 13). It therefore appears that evolutionary forces maintain allelic variation at ACD6 both across the global range of A. thaliana, and within local populations.
Fitness costs imposed by activation of defence have often been proposed as a possible explanation for genetic variation in disease resistance6, and costs associated with individual genes have been detected in field trials9-11. Specifically, priming of SA-related defence responses significantly increases disease resistance and plant fitness in the field26, but reduces fitness in the absence of pathogens22. The developmentally regulated activation of ACD6 and downstream defence components in wild A. thaliana strains carrying the hyperactive ACD6 allele (Fig. 1d; Supplementary Fig. 2c) could induce a similar primed state.
The positive association between necrosis and reduced susceptibilities to many different microbes, including bacteria, oomycetes, fungi, and at least some insects, is remarkable. Effectiveness of the Est-1 allele of ACD6 against such a wide range of enemies is likely due to elevated levels of SA (Fig. 1g), and of the antimicrobial compound camalexin, which is moderately increased in acd6-1 mutants16, as well as another defence hormone, jasmonate (Fig. 2e). In this context, it is interesting that the effects of knocking down ACD6 in different accessions varied (Fig. 2a, 5a; Supplementary Fig. 9), suggesting that there is a suite of genetic factors that modulate and fine-tune ACD6 activity.
The co-occurrence of functionally distinct alleles across both global and local populations of A. thaliana is consistent with this locus being under balancing selection, a pattern often seen for conventional disease resistance (R) genes27. What sets ACD6 apart from R genes is, however, that the latter confer race-specific disease resistance, whereas ACD6 protects against a broad spectrum of unrelated enemies and predators. Unusually large benefits in turn might make the substantial reduction in vegetative biomass caused by ACD6 more acceptable. To put it differently, accessions with Est-1-like alleles of ACD6 appear to pursue an alternative life-history strategy, being small, but well protected, compared to other strains that are larger, but less well prepared to combat pathogens.
Methods Summary
Unless otherwise stated, plants were grown under short days (8 or 9 hours light). For phenotypic assays and pathotesting, a randomized design was used.
Methods
Plant material
The acd6-1 mutant16 and the Recombinant Inbred Line (RIL) population14 have been described; the acd6-2 T-DNA insertion line was from the Salk collection28.
Phenotyping and QTL Mapping
For phenotypic measurements, a completely randomized design was used. To minimize positional effects, trays were turned every two days, and their position in the growth rooms was rotated every two days.
Leaf initiation rate was measured by marking the newly developed visible leaves every two days. Values reported are averages across the whole life of the plant, and were calculated as [(ll – l0)÷ (dl – d0)], in which dl is the last day in which the plant produced leaves, d0 is the first day in which leaves appeared, ll is the final leaf number and l0 is the number of leaves at d0 (usually two).
As a quantitative indicator of necrosis, we recorded the day on which the extent of yellowing in the sixth true leaf reached approximately 50% of the leaf area.
Leaf biomass was measured on six fully expanded rosette leaves without signs of necrosis, collected from individual 40 to 45 day old plants. Leaves were weighed after desiccation for 24 hours at 85°C. Inbred strains were arbitrarily divided into four classes (severe, intermediate, mild, absent) according to the onset and extent of necrosis.
For QTL analysis, six plants were grown for each of the 180 RILs14. QTL analysis was done using the R-qtl package29 implemented in R (http://www.r-project.org). For fine mapping, we combined information from a F2 population between Col-0 and Est-1 with the Heterogeneous Inbred Family (HIF) strategy30. Descendants of RIL48, which was segregating for the interval of interest, were genotyped throughout the interval, to identify new recombinants. In addition to microsatellite markers, predicted single nucleotide polymorphisms (http://polymorph.weigelworld.org) were exploited for marker design (Supplementary Table 7a). Genotyping of HIF48 plants with additional 311 markers 31 confirmed that these plants were otherwise homozygous across the rest of the genome. The leaf initiation rate QTL was fine mapped through progeny testing of the plants used for mapping the necrosis QTL. For each line, 10 plants fixed for the Col-0 allele and 10 fixed for the Est-1 allele were phenotyped.
Tukey-Kramer tests were used to determine significance for multiple comparisons.
Histology
Trypan blue (Sigma-Aldrich, St. Louis, MO, USA) staining was performed as described32.
Transgenes and expression assays
Three amiRNAs each for At4g14400, At4g14410, At4g14420 and At4g14430 (Supplementary Table 8) were designed using the WMD online tool (http://wmd.weigelworld.org/)33 against sequences conserved between Col-0 and Est-1, and cloned into the pRS300 vector. A nahG clone was a kind gift from Sang-Wook Park and Dan Klessig (Cornell University). AmiRNAs, the nahG open reading frame and the ACD6 cDNAs were placed under control of the constitutive CaMV 35S promoter in pFK210 derived from pGREEN (ref. 34). Genomic fragments containing the entire non-coding region upstream of ACD6, the transcribed sequences and 500 bp or more of downstream sequences from Col-0, Est-1 and acd6-1 were cloned into pFK202, a pGREEN-derived binary vector. To exchange the promoter regions, the clones were restricted at a BspEI site. Non-synonymous substitutions affecting amino acids at position 566 and 634 of the ACD6 reference protein were introduced by PCR-mediated mutagenesis in both the Col-0 and Est-1 genomic construct. Constructs were introduced into plants by Agrobacterium tumefaciens-mediated transformation35. The acd6-2 (N545869) T-DNA insertion line from the Salk collection28 was obtained from the European Arabidopsis Stock Centre (NASC).
Quantitative reverse transcription PCR (qRT-PCR) assays were performed as described36, using RNA extracted from the sixth leaf of 6-week old plants, unless otherwise stated. Expression levels were normalized against β-tubulin-2 (At5g62690). An experimentally quantified average amplification efficiency of 1.98 was used in the calculations. Primers used for qRT-PCR are given in Supplementary Table 9.
Sequencing of ACD6
Fragments of about 1 kb in length covering the ACD6 region were PCR amplified, and pooled products from two independent PCR reactions were sequenced. For KZ-10, which belongs to the same haplogroup as KZ-9 (http://arabidopsis.usc.edu/Accession/haploGroup/58)37, a fosmid library was prepared using the CopyControl Fosmid Library Production Kit (Epicentre Biotechnologies, Madison, WI, USA), according to the manufacturer’s instructions. The library was screened using probes corresponding to sequences upstream and downstream of ACD6 in Col-0. A fosmid containing the entire ACD6 region was shotgun sequenced; individual sequences were assembled using SeqMan (DNAstar, Madison, WI, USA). ACD6 sequences from Col-0, Est-1, KZ-10 and Arabidopsis lyrata MN47 were aligned using ClustalW version 2 (ref. 38). Coordinates reflect TAIR8 annotation.
Population genetic analyses
Sequences were aligned using both PAL2NAL39 and MUSCLE40. The subsequent alignments were then inspected visually and edited as necessary. Population genetic summary statistics were computed using code based on the libsequence package41. Divergence at synonymous and non-synonymous sites (dS, dN) was estimated using PAML42. Trees were computed and plotted using PhyML under the R package ape (ref. 43).
Segregation analysis in F2 populations
Nine accessions with late-onset necrosis (Supplementary Table 2) were crossed to the reference strain Col-0. Between 120 and 240 F2 plants from each cross were phenotyped for presence and severity of necrosis, using an arbitrary scale from 0 (absence of necrosis) to 4 (severe necrosis). These plants were then genotyped using a marker that distinguishes Est-1-like alleles from the Col-0 allele of ACD6 (Supplementary Table 7b).
Pathogen testing
A local isolate of powdery mildew occurring on A. thaliana plants in Tübingen was identified as G. orontii through analysis of the sequence of ribosomal DNA internal transcribed spacers (rDNA ITS)44. For inoculation, leaves from heavily infected A. thaliana plants were passed repeatedly over pots of three-week old plants to spread the fungal spores. Leaves from inoculated plants were collected 5 dpi and stained with Trypan blue. For Col-0, Est-1 and transgenic derivatives, conidiophore density was determined by dividing the total number of conidiophores present on the adaxial side of a leaf by total leaf area, which was measured using ImageJ (http://rsbweb.nih.gov/ij/). To assess susceptibility to G. orontii in a set of 96 accessions23, spontaneous infection in a greenhouse with heavy pathogen load was exploited. Ten plants for each strain were monitored for 40 days, and arbitrarily divided into four classes of susceptibility.
Golovinomyces cichoracearum UCSC1 (ref. 45) was propagated on squash plants for 10 to 12 days and then applied to A. thaliana. Plants were grown in a phytochamber under short days (9 hours light), at 20°C and 60% humidity. For inoculation, an 85-cm-tall settling tower was placed over the four- to five-week old A. thaliana plants and five to eight highly infected squash leaves were tapped over the top of the settling tower46.
For Hyaloperonospora arabidopsidis isolate Noco2, plants were grown in a phytochamber under short days (9 hours light), at 22°C during the day and 18°C during the night. Ten-day old seedlings or four-week old plants were spray inoculated with 50,000 spores/ml (in water). Sporangiophores were counted on seedlings at 5 dpi as described47,48. Adult leaves were stained with Trypan blue at 7 dpi to visualize cell death and hyphal growth.
For the common peach aphid, Myzus persicae, plants were grown on soil in a phytochamber at 20°C, 12 hour light. Aphid proliferation was assessed by placing two alate females on three or four replicates of each of 96 plant genotypes and counting the number of offspring nine days later.
For Pseudomonas syringae pv. tomato DC3000, plants were grown on soil in a phytochamber at 20°C, 12 hour light. To generate the inoculation solution, bacteria were streaked on King’s B medium49. A single colony was transferred to liquid media, which was shaken in an incubator for 24 hrs at 28°C. A 1:10 dilution of the solution was then incubated for 8 hrs. A 1 ml aliquot was removed and pelleted in an Eppendorf tube at 2040 g. The pellet was resuspended in 1 ml of 10 mM MgSO4, vortexed, and diluted to the inoculation concentration of 5×10⁴ cfu/ml. The seventh leaf on each of twenty replicate plants of each genotype was injected with 0.1 ml of the inoculation solution using blunt syringes50. At 4 dpi, a disk was removed by hole-punch, surface-sterilized in 70% ethanol for 5 sec, dried with a sterile paper towel, and ground in a 1.5 ml centrifuge tube containing 200 μl 10mM MgSO4 buffer. The homogenate was diluted 1:1,000 and 1:100,000 in buffer. A 50 μl aliquot of each dilution was spread on plates containing King’s B medium and incubated for 2 days at 28°C. Colony number was multiplied by 20 and the dilution factor to determine leaf bacterial titre50.
Metabolite measurements
These were carried out independently in the Bergelson and Traw laboratories. In the Bergelson laboratory, previously published methods51 were modified to enable high-throughput extraction using two 2.3 mm Zirconia beads, 1.4 ml ScreenMate tubes and a Spex Geno/Grinder 2010. All LC/MS analyses were performed on an Agilent Technologies (Santa Clara, CA, USA) 1200 SL high performance liquid chromatography (HPLC) system connected to a 6410 triple quadrupole mass spectrometer. Deuterated benzoic(d5) acid was used as an internal standard. Jasmonic acid, salicylic acid, camalexin and benzoic(d5) acid were quantified in positive ion mode using the quasi-molecular ion transitions [M+H]+ 211 > 151 and 211 > 165 (JA), 139 > 121 and 139 > 93 (salicylic acid), 202 > 117 (camalexin) and 128 > 82.4 (Benzoic[d5] Acid). Salicylic-acid glucoside was quantified in negative ion mode using the [M-H]-transition 299>136.8.
The chromatographic method included an Eclipse-XDB C18 (Agilent) column (4.6 × 50 mm 1.8 μm) using gradient elution with 0.1% HOAc in water (A) and MeCN (B) under a flow-rate of 800 μL min-1. The gradient increase of solvent B was as follows: Time (min) / Solvent B (MeCN) /Flow (ml): 0 / 30% / 0.8; 2.7 / 100% / 0.8; 3.7 / 100% / 0.8; 3.71 / 30% / 0.8; 7 / 30% / 0.8.
In the Traw laboratory, fresh leaves were flash frozen in liquid nitrogen, and stored at −80°C. To increase sample volume, three leaves were pooled and a total of eight samples were analyzed per genotype. Extraction and analysis followed a standard protocol52. Approximately 100 mg of tissue was weighed, pulverized, and suspended in 3 ml of 90% methanol. An internal control of 1 μg of O-anisic acid (Sigma-Aldrich, St. Louis, MO, USA) was added to each sample tube (100 μl of a 10 μg / ml solution in 100% methanol), which was vortexed to resuspend the tissue. Tubes were rocked in a shaker at room temperature for 24 hours. The liquid was transferred to a new tube and the pellet resuspended in 3 ml of 100% methanol, vortexed, and rocked again for 24 hours. The supernatant fractions were combined, the sample was split into equal volumes in two screw cap tubes, and tubes were placed in the front of a fume hood until dry (roughly 24 hrs later). One volume received 40 U of β-glucosidase enzyme (Sigma-Aldrich) in 400 μl of 100 mM sodium acetate buffer (pH 5.5), which cleaves the sugar from salicylic acid glucoside, thus providing an estimate of total salicylic acid present in the sample (free plus glucoside). The other volume received the 400 μl buffer, but no enzyme. All samples were incubated overnight at 37°C, after which 400 μl of 10% trichloroacetic acid was added. Samples were then partitioned twice with 1 ml of an organic extraction solvent (100:99:1 of ethylacetate : cyclopentane : 2-propanol), and vortexed each time before collecting the two organic phase fractions in a centrifuge tube. Tubes were placed in a fume hood until dry (24 to 48 hrs). Samples were resuspended in 600 μl of 55% methanol, vortexed, and placed in a rocker overnight. After centrifugation at 5000 g for 15 min, the supernatant was transferred to 0.2 μm nylon spin-prep membrane filters (Thermo Fisher Scientific, Waltham, MA, USA), and centrifuged at 10,000 g for 5 min.
Concentrations of salicylic acid were measured by HPLC on an HP1100 system with a 4.6 × 150 mm Eclipse XDB C-18 column and fluorescence detector (Agilent Technologies) with excitation at 301 nm and emission at 412, 386, and 365 nm for salicylic acid, camalexin, and O-anisic acid, respectively. Solvent flow was 1 ml/min, beginning at 30% of 100% methanol and 70% of 0.5% acetic acid for 5 min, increasing to 40% methanol at 7.5 min and 60% methanol at 18 min, returning to 30% methanol at 21 min. Concentrations of salicylic acid and camalexin (μg/g fresh weight) were calculated as the peak area of the compound divided by the product of the peak area of O-anisic acid and sample mass.
Genome-wide association studies
The biological material, SNP markers and statistical methods are described in detail in the accompanying article24.
Tübingen area accessions
A set of 890 plants collected around Tübingen25 was genotyped with primers that distinguished between Col-0-like and Est-1-like alleles of ACD6, and with a primer pair specific for KZ-10-like alleles (Supplementary Table 7b). Genotyping for Est-1-like alleles was confirmed in a subset of 384 individuals using a CAPS53 marker (Supplementary Table 7b).
Supplementary Material
Acknowledgements
We thank Sang-Wook Park and Dan Klessig for a nahG clone; Jean Greenberg, the NSF-supported Arabidopsis Biological Resource Centre (ABRC) and the European Arabidopsis Stock Centre (NASC) for seeds; and Suzi Atwell, Karl Broman and Ya-Long Guo for advice. We are particularly grateful to Kirsten Bomblies and Levi Yant for establishing the Tübingen A. thaliana collection. This work was supported by NIH NRSA fellowship F23-GM65032-1 (C.S.), an EMBO Long-Term Fellowship (S.B.), NIH grants GM62932 (J.C. and D.W.), GM057171 (J.L.D.), GM057994 (J.B.) and GM073822 (J.O.B.), NSF grants DEB-0519961 (J.B. and M.N.) and NSF MCB0603515 (J.B.), HFSPO grant RGP0057/2007-C (J.L.D. and D.W.), DFG grant LI 1317/2-1 (V.L.), the Gatsby Foundation (V.L.), the Dropkin Foundation (J.B.), the Howard Hughes Medical Institute (J.C.), Marie Curie RTN SY-STEM (D.W.), ERA-PG (BMBF) grant ARABRAS (D.W.), FP6 IP AGRON-OMICS (contract LSHG-CT-2006-037704, D.W.), a Gottfried Wilhelm Leibniz Award of the DFG (D.W.), and the Max Planck Society (D.W.).
Footnotes
Full Methods and any associated references are available in the online version of the paper at www.nature.com/nature.
Supplementary Information is linked to the online version of the paper at www.nature.com/nature.
Author Information DNA sequences have been deposited in GenBank under accession numbers XXXXX.
References
- 1.Glazebrook J. Contrasting mechanisms of defense against biotrophic and necrotrophic pathogens. Annu. Rev. Phytopathol. 2005;43:205–227. doi: 10.1146/annurev.phyto.43.040204.135923. [DOI] [PubMed] [Google Scholar]
- 2.Holub EB. The arms race is ancient history in Arabidopsis, the wildflower. Nat. Rev. Genet. 2001;2:516–527. doi: 10.1038/35080508. [DOI] [PubMed] [Google Scholar]
- 3.Holub EB. Natural variation in innate immunity of a pioneer species. Curr. Opin. Plant Biol. 2007;10:415–424. doi: 10.1016/j.pbi.2007.05.003. [DOI] [PubMed] [Google Scholar]
- 4.Jones JD, Dangl JL. The plant immune system. Nature. 2006;444:323–329. doi: 10.1038/nature05286. [DOI] [PubMed] [Google Scholar]
- 5.Bent AF, Mackey D. Elicitors, effectors, and R genes: the new paradigm and a lifetime supply of questions. Annu. Rev. Phytopathol. 2007;45:399–436. doi: 10.1146/annurev.phyto.45.062806.094427. [DOI] [PubMed] [Google Scholar]
- 6.Heil M, Baldwin IT. Fitness costs of induced resistance: emerging experimental support for a slippery concept. Trends Plant Sci. 2002;7:61–67. doi: 10.1016/s1360-1385(01)02186-0. [DOI] [PubMed] [Google Scholar]
- 7.Mauricio R. Costs of resistance to natural enemies in field populations of the annual plant Arabidopsis thaliana. Am. Nat. 1998;151:20–28. doi: 10.1086/286099. [DOI] [PubMed] [Google Scholar]
- 8.Heil M, Hilpert A, Kaiser W, Linsenmair KE. Reduced growth and seed set following chemical induction of pathogen defence: Does Systemic Acquired Resistance (SAR) incur allocation costs? J. Ecol. 2000;88:645–654. [Google Scholar]
- 9.Tian D, Traw MB, Chen JQ, Kreitman M, Bergelson J. Fitness costs of R-gene-mediated resistance in Arabidopsis thaliana. Nature. 2003;423:74–77. doi: 10.1038/nature01588. [DOI] [PubMed] [Google Scholar]
- 10.Zavala JA, Baldwin IT. Fitness benefits of trypsin proteinase inhibitor expression in Nicotiana attenuata are greater than their costs when plants are attacked. BMC Ecol. 2004;4:11. doi: 10.1186/1472-6785-4-11. [DOI] [PMC free article] [PubMed] [Google Scholar]
- 11.Korves T. A novel cost of R gene resistance in the presence of disease. Am. Nat. 2004;163:489–504. doi: 10.1086/382552. [DOI] [PubMed] [Google Scholar]
- 12.Lu H, Rate DN, Song JT, Greenberg JT. ACD6, a novel ankyrin protein, is a regulator and an effector of salicylic acid signaling in the Arabidopsis defense response. Plant Cell. 2003;15:2408–2420. doi: 10.1105/tpc.015412. [DOI] [PMC free article] [PubMed] [Google Scholar]
- 13.Lu H, Liu Y, Greenberg JT. Structure-function analysis of the plasma membrane- localized Arabidopsis defense component ACD6. Plant J. 2005;44:798–809. doi: 10.1111/j.1365-313X.2005.02567.x. [DOI] [PubMed] [Google Scholar]
- 14.Balasubramanian S, et al. QTL mapping in new Arabidopsis thaliana advanced intercross-recombinant inbred lines. PLoS ONE. 2009;4:e4318. doi: 10.1371/journal.pone.0004318. [DOI] [PMC free article] [PubMed] [Google Scholar]
- 15.Schwab R, Ossowski S, Riester M, Warthmann N, Weigel D. Highly specific gene silencing by artificial microRNAs in Arabidopsis. Plant Cell. 2006;18:1121–1133. doi: 10.1105/tpc.105.039834. [DOI] [PMC free article] [PubMed] [Google Scholar]
- 16.Rate DN, Cuenca JV, Bowman GR, Guttman DS, Greenberg JT. The gain-of-function Arabidopsis acd6 mutant reveals novel regulation and function of the salicylic acid signaling pathway in controlling cell death, defenses, and cell growth. Plant Cell. 1999;11:1695–1708. doi: 10.1105/tpc.11.9.1695. [DOI] [PMC free article] [PubMed] [Google Scholar]
- 17.Lorrain S, Vailleau F, Balague C, Roby D. Lesion mimic mutants: keys for deciphering cell death and defense pathways in plants? Trends Plant Sci. 2003;8:263–271. doi: 10.1016/S1360-1385(03)00108-0. [DOI] [PubMed] [Google Scholar]
- 18.Greenberg JT, Yao N. The role and regulation of programmed cell death in plant-pathogen interactions. Cell. Microbiol. 2004;6:201–211. doi: 10.1111/j.1462-5822.2004.00361.x. [DOI] [PubMed] [Google Scholar]
- 19.Yu IC, Parker J, Bent AF. Gene-for-gene disease resistance without the hypersensitive response in Arabidopsis dnd1 mutant. Proc. Natl. Acad. Sci. USA. 1998;95:7819–7824. doi: 10.1073/pnas.95.13.7819. [DOI] [PMC free article] [PubMed] [Google Scholar]
- 20.Gaffney T, et al. Requirement of salicylic acid for the induction of systemic acquired resistance. Science. 1993;261:754–756. doi: 10.1126/science.261.5122.754. [DOI] [PubMed] [Google Scholar]
- 21.Lu H, et al. Genetic analysis of acd6-1 reveals complex defense networks and leads to identification of novel defense genes in Arabidopsis. Plant J. 2009;58:401–412. doi: 10.1111/j.1365-313X.2009.03791.x. [DOI] [PMC free article] [PubMed] [Google Scholar]
- 22.Abreu ME, Munné-Bosch S. Salicylic acid deficiency in NahG transgenic lines and sid2 mutants increases seed yield in the annual plant Arabidopsis thaliana. J. Exp. Bot. 2009;60:1261–1271. doi: 10.1093/jxb/ern363. [DOI] [PMC free article] [PubMed] [Google Scholar]
- 23.Nordborg M, et al. The pattern of polymorphism in Arabidopsis thaliana. PLoS Biol. 2005;3:e196. doi: 10.1371/journal.pbio.0030196. [DOI] [PMC free article] [PubMed] [Google Scholar]
- 24.Atwell S, et al. Genome-wide association study of 107 phenotypes in a common set of Arabidopsis thaliana inbred lines. Nature. 2010;(this issue) doi: 10.1038/nature08800. [DOI] [PMC free article] [PubMed] [Google Scholar]
- 25.Bomblies K, et al. Local-scale patterns of genetic variability, outcrossing and spatial structure in natural stands of Arabidopsis thaliana. PLoS Genet. 2010;6:e1000890. doi: 10.1371/journal.pgen.1000890. [DOI] [PMC free article] [PubMed] [Google Scholar]
- 26.Traw MB, Kniskern JM, Bergelson J. SAR increases fitness of Arabidopsis thaliana in the presence of natural bacterial pathogens. Evolution. 2007;61:2444–2449. doi: 10.1111/j.1558-5646.2007.00211.x. [DOI] [PubMed] [Google Scholar]
- 27.Van der Hoorn RA, De Wit PJ, Joosten MH. Balancing selection favors guarding resistance proteins. Trends Plant Sci. 2002;7:67–71. doi: 10.1016/s1360-1385(01)02188-4. [DOI] [PubMed] [Google Scholar]
- 28.Alonso JM, et al. Genome-wide insertional mutagenesis of Arabidopsis thaliana. Science. 2003;301:653–657. doi: 10.1126/science.1086391. [DOI] [PubMed] [Google Scholar]
- 29.Broman KW, Wu H, Sen S, Churchill GA. R/qtl: QTL mapping in experimental crosses. Bioinformatics. 2003;19:889–890. doi: 10.1093/bioinformatics/btg112. [DOI] [PubMed] [Google Scholar]
- 30.Tuinstra M, Ejeta G, Goldsbrough P. Heterogenous inbred family (HIF) analysis: a method for developing near-isogenic lines that differ at quantitative trait loci. Theor. Appl. Genet. 1997;95:1005–1011. [Google Scholar]
- 31.Warthmann N, Fitz J, Weigel D. MSQT for choosing SNP assays from multiple DNA alignments. Bioinformatics. 2007;23:2784–2787. doi: 10.1093/bioinformatics/btm428. [DOI] [PubMed] [Google Scholar]
- 32.Koch E, Slusarenko A. Arabidopsis is susceptible to infection by a downy mildew fungus. Plant Cell. 1990;2:437–445. doi: 10.1105/tpc.2.5.437. [DOI] [PMC free article] [PubMed] [Google Scholar]
- 33.Ossowski S, Schwab R, Weigel D. Gene silencing in plants using artificial microRNAs and other small RNAs. Plant J. 2008;53:674–690. doi: 10.1111/j.1365-313X.2007.03328.x. [DOI] [PubMed] [Google Scholar]
- 34.Hellens RP, Edwards EA, Leyland NR, Bean S, Mullineaux PM. pGreen: a versatile and flexible binary Ti vector for Agrobacterium-mediated plant transformation. Plant Mol. Biol. 2000;42:819–832. doi: 10.1023/a:1006496308160. [DOI] [PubMed] [Google Scholar]
- 35.Weigel D, Glazebrook J. Arabidopsis: A Laboratory Manual. Cold Spring Harbor Laboratory Press; 2002. [Google Scholar]
- 36.Lempe J, et al. Diversity of flowering responses in wild Arabidopsis thaliana strains. PLoS Genet. 2005;1:109–118. doi: 10.1371/journal.pgen.0010006. [DOI] [PMC free article] [PubMed] [Google Scholar]
- 37.Platt A, et al. The scale of population structure in Arabidopsis thaliana. PLoS Genet. 6:e1000843. doi: 10.1371/journal.pgen.1000843. [DOI] [PMC free article] [PubMed] [Google Scholar]
- 38.Larkin MA, et al. Clustal W and Clustal X version 2.0. Bioinformatics. 2007;23:2947–2948. doi: 10.1093/bioinformatics/btm404. [DOI] [PubMed] [Google Scholar]
- 39.Suyama M, Torrents D, Bork P. PAL2NAL: robust conversion of protein sequence alignments into the corresponding codon alignments. Nucleic Acids Res. 2006;34:W609–612. doi: 10.1093/nar/gkl315. [DOI] [PMC free article] [PubMed] [Google Scholar]
- 40.Edgar RC. MUSCLE: multiple sequence alignment with high accuracy and high throughput. Nucleic Acids Res. 2004;32:1792–1797. doi: 10.1093/nar/gkh340. [DOI] [PMC free article] [PubMed] [Google Scholar]
- 41.Thornton K. libsequence: a C++ class library for evolutionary genetic analysis. Bioinformatics. 2003;19:2325–2327. doi: 10.1093/bioinformatics/btg316. [DOI] [PubMed] [Google Scholar]
- 42.Yang Z. PAML 4: phylogenetic analysis by maximum likelihood. Mol. Biol. Evol. 2007;24:1586–1591. doi: 10.1093/molbev/msm088. [DOI] [PubMed] [Google Scholar]
- 43.Paradis E, Claude J, Strimmer K. APE: Analyses of Phylogenetics and Evolution in R language. Bioinformatics. 2004;20:289–290. doi: 10.1093/bioinformatics/btg412. [DOI] [PubMed] [Google Scholar]
- 44.Hirata T, Takamatsu S. Nucleotide sequence diversity of rDNA internal transcribed spacers extracted from conidia and cleistothecia of several powdery mildew fungi. Mycoscience. 1996;37:283–288. [Google Scholar]
- 45.Adam L, Somerville SC. Genetic characterization of five powdery mildew disease resistance loci in Arabidopsis thaliana. Plant J. 1996;9:341–356. doi: 10.1046/j.1365-313x.1996.09030341.x. [DOI] [PubMed] [Google Scholar]
- 46.Vogel J, Somerville S. Isolation and characterization of powdery mildew-resistant Arabidopsis mutants. Proc. Natl. Acad. Sci. USA. 2000;97:1897–1902. doi: 10.1073/pnas.030531997. [DOI] [PMC free article] [PubMed] [Google Scholar]
- 47.Holt BF, 3rd, et al. An evolutionarily conserved mediator of plant disease resistance gene function is required for normal Arabidopsis development. Dev. Cell. 2002;2:807–817. doi: 10.1016/s1534-5807(02)00174-0. [DOI] [PubMed] [Google Scholar]
- 48.Kaminaka H, et al. bZIP10-LSD1 antagonism modulates basal defense and cell death in Arabidopsis following infection. EMBO J. 2006;25:4400–4411. doi: 10.1038/sj.emboj.7601312. [DOI] [PMC free article] [PubMed] [Google Scholar]
- 49.King EO, Ward MK, Raney DE. Two simple media for the demonstration of pyocyanin and fluorescin. J. Lab. Clin. Med. 1954;44:301–307. [PubMed] [Google Scholar]
- 50.Jakob K, et al. Pseudomonas viridiflava and P. syringae--natural pathogens of Arabidopsis thaliana. Mol Plant Microbe Interact. 2002;15:1195–1203. doi: 10.1094/MPMI.2002.15.12.1195. [DOI] [PubMed] [Google Scholar]
- 51.Segarra G, Jauregui O, Casanova E, Trillas I. Simultaneous quantitative LC-ESI-MS/MS analyses of salicylic acid and jasmonic acid in crude extracts of Cucumis sativus under biotic stress. Phytochemistry. 2006;67:395–401. doi: 10.1016/j.phytochem.2005.11.017. [DOI] [PubMed] [Google Scholar]
- 52.Dewdney J, et al. Three unique mutants of Arabidopsis identify eds loci required for limiting growth of a biotrophic fungal pathogen. Plant J. 2000;24:205–218. doi: 10.1046/j.1365-313x.2000.00870.x. [DOI] [PubMed] [Google Scholar]
- 53.Konieczny A, Ausubel FM. A procedure for mapping Arabidopsis mutations using co-dominant ecotype-specific PCR-based markers. Plant J. 1993;4:403–410. doi: 10.1046/j.1365-313x.1993.04020403.x. [DOI] [PubMed] [Google Scholar]
Associated Data
This section collects any data citations, data availability statements, or supplementary materials included in this article.