Abstract
Due to the biocompatibility of poly(ethylene glycol) (PEG), PEG-based hydrogels have attracted considerable interest for use as biomaterials in tissue engineering applications. In this work, we show that PEG-based hydrogels prepared by photopolymerization of PEG macromonomers functionalized with either acrylate or acrylamide end-groups generate networks with crosslink junctions of high functionality. Although the crosslink functionality is not well controlled, the resultant networks are sufficiently well ordered to generate a distinct correlation peak in the small angle x-ray scattering (SAXS) related to the distance between crosslink junctions within the PEG network. The crosslink spacing is a useful probe of the PEG chain conformation within the hydrogel and ranges from approximately 6 to 16 nm, dependent upon both the volume fraction of polymer and the molecular weight of the PEG macromonomers. The presence of a peak in the scattering of photopolymerized PEG networks is also correlated with an enhanced compressive modulus in comparison to PEG networks reported in the literature with much lower crosslink functionality that exhibit no scattering peak. This comparison demonstrates that the method used to link together PEG macromonomers has a critical impact on both the nanoscale structure and the macroscopic properties of the resultant hydrogel network.
Keywords: Poly(ethylene glycol), hydrogel, small angle x-ray scattering
Introduction
Poly(ethylene glycol) (PEG) hydrogels consist of crosslinked networks of PEG chains swollen in an aqueous solution. PEG hydrogels are typically prepared either by γ-irradiation of linear PEG chains or by linking together telechelic PEG macromonomers having functional end-groups via step or free radical polymerization.1-4 Networks formed from telechelic macromonomers can be considered “model” networks in the sense that the molecular weight between crosslinks is determined by the macromonomer molecular weight and is, therefore, well-controlled.3 Despite the well-controlled molecular weight between crosslink junctions, the crosslink functionality and the resulting nanoscale morphology of end-linked PEG networks can still be influenced by the nature of the reactive end-groups and polymerization method.
In this work, we use small angle x-ray scattering (SAXS) to explore the nanoscale morphology of PEG hydrogels prepared by free radical photopolymerization of PEG-diacrylate and PEG-diacrylamide macromonomers. The nanoscale structure and the resulting macroscopic mechanical properties of hydrogels prepared from PEG-diacrylate and PEG-diacrylamide macromonomers are of interest for several reasons. For one, these hydrogels have been used as a first network in high strength interpenetrating polymer networks wherein loosely crosslinked poly(acrylic acid) forms the second network.5 In order to understand the structure and mechanisms for strength enhancement in these interpenetrating polymer networks, it is essential to first understand the structure of the photopolymerized PEG networks before addition of a second polymer network. Second, the nanoscale morphology of photopolymerized PEG hydrogels is of general interest because such hydrogels are easily prepared and are commonly used as cell scaffolds.6-8 A better understanding of the structure of photopolymerized PEG hydrogels may help to gain a better insight into cellular interactions with synthetic PEG-based scaffolds.
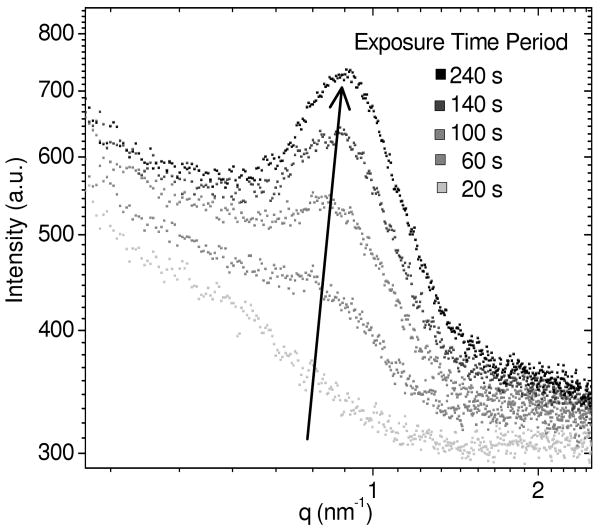
Small angle x-ray scattering (SAXS) and small angle neutron scattering (SANS) are able to probe differences in electron or neutron density within hydrogel networks on length scales ranging from sub nanometer up to ∼100 nm.9 SAXS and SANS are, therefore, valuable tools for characterizing the morphology of water-swollen polymer networks in their native state. In this study, we have observed that there is a distinct correlation peak in the SAXS pattern of photopolymerized PEG-diacrylate and PEG-diacrylamide hydrogels. This correlation peak is present both in hydrogels polymerized by ultraviolet (UV) radiation and hydrogels polymerized by x-ray radiation from the SAXS beamline. For in situ SAXS measurements of PEG macromonomer precursor solutions, the correlation peak is not initially present in the polymer solutions but develops only after the x-ray radiation has induced polymerization of the free radical reactive end-groups. X-ray radiation is known to induce the polymerization of acrylamide functionalities, and gelation of the PEG macromonomers is confirmed by the formation of a transparent gel the size and shape of the SAXS beamline.10 The correlation peak position shifts with the macromonomer molecular weight, polymer volume fraction, solvent quality, and uniaxial tension in a manner that demonstrates that the peak position is related to the spacing between crosslink junctions within the PEG hydrogel network. The correlation peak is, therefore, attributed to the average spacing between dense crosslink junction regions within PEG networks prepared by photopolymerization of PEG macromonomers with free radical reactive end-groups.
The crosslink spacing obtained from the correlation peak position is used to probe the PEG chain conformation within the hydrogel and to estimate the average crosslink functionality of the networks. The presence of a peak in the SAXS pattern of photopolymerized PEG networks is also correlated with an enhanced compressive modulus in comparison to PEG networks from the literature with much lower crosslink functionality. We are unaware of any previous studies demonstrating that either PEG-diacrylate or PEG-diacrylamide hydrogels have a correlation peak in their small angle scattering and that this correlation peak can be used to obtain information about the crosslink junction morphology and crosslink junction spacing within photopolymerized PEG hydrogels.
Experimental Section
Chemicals
2-Hydroxy-2-methyl-propiophenone, acryloyl chloride, mesyl chloride, diol-terminated poly(ethylene glycol) (PEG) [Mn≈3,400 g/mol (prod.# 202444), Mn≈4,600 mol (prod.# 373001), Mn≈8,000 g/mol (prod.# 202452)], and triethylamine were purchased from Sigma-Aldrich Chemical Co. (Milwaukee, WI) and used as received. Dichloromethane, diethyl ether, and anhydrous tetrahydrofuran were purchased from Fisher Scientific (Pittsburgh, PA).
PEG-diacrylate and PEG-diacrylamide synthesis
Diacrylate-terminated PEG was prepared by reacting diol-terminated PEG with a 2.5 mol excess of acryloyl chloride and triethylamine base catalyst in tetrahydrofuran overnight at room temperature. Diacrylamide-terminated PEG was prepared following the synthetic protocol described previously by Elbert and Hubbell.11 In this procedure, PEG-diamine is synthesized first and then reacted with a 2.5 mol excess of acryloyl chloride and triethylamine base catalyst to produce PEG-diacrylamide. PEG-diacrylate and PEG-diacrylamide products were purified by filtration, liquid-liquid extraction in dichloromethane, and precipitation in diethyl ether. From here on, PEG-diacrylate will be denoted as PEG-DA(Mn) and PEG-diacrylamide as PEG-DAam(Mn), where the number average molecular weight, Mn, is abbreviated as 3.4k for Mn=3,400 g/mol, 4.6k for Mn=4,600 g/mol, and 8.0k for Mn=8,000 g/mol.
End-group functionalization efficiency
The degree of end-group functionalization was evaluated by 1H-NMR. However, the exact extent of functionalization is difficult to determine using 1H-NMR, as the ratio of end-groups to PEG monomer units is low and the PEG chains are not monodisperse. Within this limitation, the ratio of end-groups to PEG chain segments revealed near-complete functionalization of end-groups for each PEG molecular weight synthesized. A sample 1H-NMR spectrum for PEG-DA(3.4k) is shown in Figure S01 in the Supplemental Information.
Hydrogel preparation
PEG hydrogel precursor solutions were prepared by dissolving dried PEG-DA or PEG-DAam powder in deionized water. Precursor solution concentrations are reported as % wt/wt unless otherwise noted (e.g., 1 g of PEG-DA(3.4k) macromonomer dissolved in 1 g of water is referred to as PEG-DA(3.4k)-50%). The photoinitiator, 2-hydroxy-2-methyl-propiophenone, was then added to the solution at 1 wt% with respect to the PEG. PEG precursor solutions with photoinitiator were injected between two glass slides separated by a 0.5 mm thick Teflon spacer and exposed to an UV light source, 365 nm at 10 mW/cm2, for 5 min (UV chamber model ELC-500, Electro-lite Corporation, Danbury, CT). Upon exposure to UV light, the macromonomer end-groups reacted via free radical polymerization to create an end-linked PEG network. The PEG hydrogels were placed in deionized water and allowed to reach equilibrium swelling overnight. The equilibrium swelling ratio (Ws/Wd) is defined as the mass of the fully swollen hydrogel (Ws) divided by the mass of the dry hydrogel (Wd). The equilibrium polymer volume fraction was obtained by first determining the polymer mass fraction (Wd/Ws) and then converting to volume fraction using a specific volume of 0.92 cm3/g for PEG.12
Sol-fraction determination
To determine the unreacted sol-fraction of macromonomer in the PEG networks, the PEG hydrogels were dried in a vacuum desiccator immediately after photopolymerization and their mass was recorded. The dried hydrogels were then re-swollen in deionized water and placed in a Soxhlet extractor with deionized water as the solvent for three days. The hydrogels were then re-dried in a vacuum desiccator and their mass was recorded once more. Any loss in mass was attributed to a sol-fraction of unreacted PEG macromonomers in the PEG networks being removed during the Soxhlet extraction process.
Small angle x-ray scattering (SAXS) measurements
SAXS measurements were performed at the Stanford Synchrotron Radiation Lightsource (SSRL) on beamlines 1-4 and 4-2. Hydrogel samples between 0.5 and 1.0 mm thick and 15 mm in diameter were placed into sample holders with no windows. To study the effect of uniaxial tension on the hydrogel morphology, SAXS was performed on hydrogels under tension by clamping a rectangular hydrogel slab into a straining rig placed in-line on beamline 1-4. The strain on the hydrogel was determined by the distance between grips, and samples were held under a constant strain for the duration of the data collection (10 min). Background and empty cell scattering were determined by separate measurements with no beam and empty sample holders. Depending upon the sample-to-detector distance, detector distances and beam centers were calibrated with silver behenate, cholesteryl myristate, or chicken collagen standard samples. Multiple sample-to-detector distances were used, and the data were aligned by shifting intensities by an arbitrary factor. All peak positions were determined by fitting to a Lorentzian shape with a Levenberg-Marquardt nonlinear regression algorithm within OriginPro8 software (OriginLab, Northampton, MA).
Estimation of crosslink functionality
For the purpose of estimating the crosslink functionality of PEG-DA hydrogels, it was assumed that all of the macromonomer end-groups were functionalized, had reacted into a crosslink junction, and that the crosslinks formed a face centered cubic (fcc) lattice structure. The assumption that the crosslink junctions conform to an fcc structure is made solely to obtain an estimate of the crosslink functionality. Since any actual lattice structure is unknown, this assumption is not intended to imply that the actual hydrogel structure is an fcc lattice. For the purposes of estimating the crosslink functionality, the specific lattice structure assumed is not of critical importance since comparable results are obtained for different lattices. Analogous analyses have been used to determine the number of end-groups per aggregate for associative polymers, which consist of hydrophilic polymers with hydrophobic end-groups that aggregate together in aqueous solution.13,14
To estimate the crosslink functionality, the relationship that the plane d-spacing of the lowest order diffraction peak is d = 2π/qmax was used to determine the nearest neighbor spacing between lattice points. The lattice parameter was then calculated as with four crosslink junctions per unit cell for an fcc structure. The functionality or the number of end-groups per crosslink junction was determined by dividing the concentration of end-groups in the hydrogel, which was obtained from the hydrogel's polymer volume fraction, by the number of lattice points per unit volume.
SAXS in situ polymerization
To determine how the structure of PEG-DA hydrogels developed during the polymerization process, PEG-DA precursor solutions were polymerized in situ using x-ray radiation from SAXS wiggler beamline 4-2. PEG precursor solution samples were injected between two Kapton windows. The precursor solutions were exposed to x-ray radiation at λ = 0.155 nm in a series of 20-second exposures. After exposure to a sufficient amount of x-ray radiation, a small transparent gel the size and shape of the x-ray beam was obtained. This allowed scattering data to be collected during polymerization so that the structural transitions occurring during the transition from a PEG precursor solution to a PEG network could be followed. Polymer solutions of diol-terminated PEG did not polymerize or show a scattering peak when exposed to x-ray radiation, indicating that the free radical reactive acrylate end-groups are necessary for polymerization. It has previously been shown that x-ray radiation can just as readily initiate the polymerization of an acrylamide functionality in the same manner as UV radiation.10 In situ polymerizations were carried out on PEG-DA(3.4k), PEG-DA(4.6k), and PEG-DA(8.0k) precursor solutions at concentrations of 20%, 30%, 40%, and 50% wt/wt. Precursor solutions at 10%, 5%, and 1% wt/wt did not form gels and did not develop well-defined correlation peaks. No photoinitiator was added to either PEG-DA or PEG-DAam precursor solutions, as the free radicals were generated directly from the acrylate or acrylamide groups. Polymerization of precursor solutions did not occur on bending magnet beamline 1-4, as the x-ray flux is much lower than on wiggler beamline 4-2.
Compressive mechanical testing
The initial compressive modulus, stress at break, and strain at break for PEG-DA hydrogels were determined using an Instron Universal Materials Testing Machine (Instron Model #5844) (Norwood, MA) with Bluehill 2 software. Following the work of Gong et al., we performed compressive tests on PEG hydrogel cylinders 9 mm in diameter and 4 mm in height.15 The cylinders were obtained by cutting out 9 mm diameter cylinders with a trephine punch from a 4 mm thick hydrogel slab. Stress and strain are reported as true stress and true strain, assuming isotropic deformation during compression. A strain rate of 1 mm/min was used for compressive testing on fully swollen PEG-DA-50% hydrogels. Measurements for each type of sample were performed at least six times. The initial compressive modulus was determined by taking the slope of the true stress/strain curve between strains of 5 and 15%. The true strain at break was determined as the true strain reached before failure, which was indicated by a sudden drop in the true stress. The true stress at break was taken as the true stress at the maximum true strain before failure.
Results and Discussion
SAXS from equilibrium-swollen PEG hydrogels
Equilibrium-swollen PEG hydrogels were prepared via free radical photopolymerization of diacrylate or diacrylamide-terminated macromonomers followed by swelling in deionized water. Table 1 shows the equilibrium swelling ratios, volume fractions of polymer, and polymer sol-fractions for these hydrogels. As the macromonomer molecular weight increased, the equilibrium swelling ratios increased due to the increased molecular weight between crosslink junctions.
Table 1. Equilibrium swelling ratios, volume fractions of polymer, and sol-fractions for PEG-DA hydrogels prepared at 50% wt/wt.
| PEG Mn (g/mol) | Swelling Ratio (Ws/Wd) | Polymer Vol. Frac. (φ) | Polymer Sol-Fraction |
|---|---|---|---|
| 3400 | 3.944 | 0.238 | 0.006 |
| 4600 | 4.833 | 0.194 | 0.016 |
| 8000 | 5.886 | 0.156 | 0.006 |
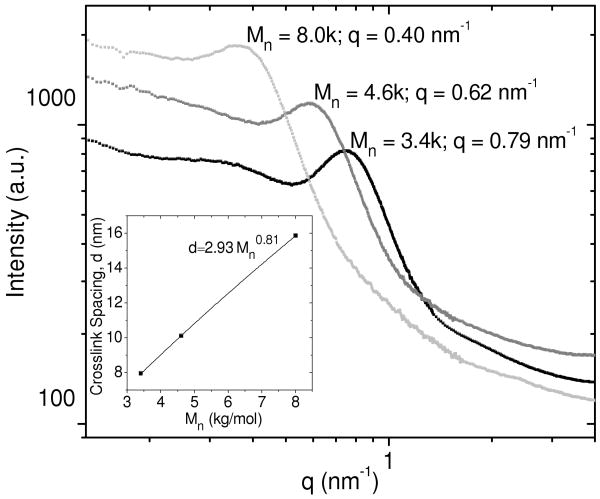
The SAXS from these hydrogels is shown in Figure 1 and reveals a correlation peak in the range q = 0.40-0.79 nm-1. The peak position depended upon the PEG macromonomer molecular weight with peak centers at lower q values (larger length scales) for higher molecular weight PEG chains. The SAXS curves for PEG-DA and PEG-DAam were similar (Figure S02 in the Supplemental Information), suggesting that from the perspective of SAXS, a change from diacrylate to diacrylamide end-group functionality does not significantly alter the hydrogel nanoscale structure.
Figure 1.
SAXS curves from equilibrium-swollen PEG-DA(8.0k)-50% (light gray), PEG-DA(4.6k)-50% (gray), and PEG-DA(3.4k) (black). Intensities are offset for clarity. The inset shows the crosslink spacing vs. the number average molecular weight of the PEG macromonomers.
| (1) |
The correlation peak in the SAXS pattern is attributed to the spacing between dense crosslink junctions in the PEG network. The peak positions are related to the spacing between the crosslink junctions by using Bragg's law (Equation 1), where d is the spacing between scattering centers and θ is half of the scattering angle. The crosslink junction spacings obtained from the peak positions in Figure 1 are shown in Table 2. These values are compared to the theoretical end-to-end distances of a PEG chain assuming either a random walk Gaussian ideal chain, a self-avoiding random walk in three dimensions (3-D SAW), a self-avoiding random walk in two dimensions (2-D SAW), and, finally, the contour length of a fully extended PEG chain. The end-to-end distances were calculated using Equation 2, where r0 is the end-to-end distance, b is the Kuhn length for PEG (0.76 nm), N is the corresponding number of Kuhn segments, and ν1 is the scaling exponent.16 The value for the exponent ν1 is dependent upon the model used for the PEG chain. For an ideal Gaussian chain modeled as a random walk, ν1 = 0.5; for a self-avoiding polymer chain in a good solvent, ν1 = 0.588; for a self-avoiding polymer chain in two dimensions, ν1 = 0.75; and, finally, for the contour length of a fully extended chain ν1 = 1.0.17 The values in Table 2 obtained for the crosslink spacing in equilibrium-swollen PEG networks suggest that the PEG chains have a more extended conformation than a simple 3-D SAW, but are not quite as fully extended as a pure 2-D SAW.
Table 2. Crosslink spacing (d-spacing) in equilibrium-swollen PEG hydrogels that were prepared at 50% wt/wt and theoretical end-to-end distances for a PEG chain.
| Mn (g/mol) | d-spacing (nm) | Ideal Chain (nm) ν1 = 0.5 | 3-D SAW (nm) ν1 = 0.588 | 2-D SAW (nm) ν1 = 0.75 | Contour Length (nm) ν1 = 1.0 |
|---|---|---|---|---|---|
| 3400 | 8.0 | 4.6 | 6.3 | 11.4 | 28.0 |
| 4600 | 10.1 | 5.4 | 7.6 | 14.3 | 37.9 |
| 8000 | 15.9 | 7.1 | 10.5 | 21.6 | 65.9 |
| (2) |
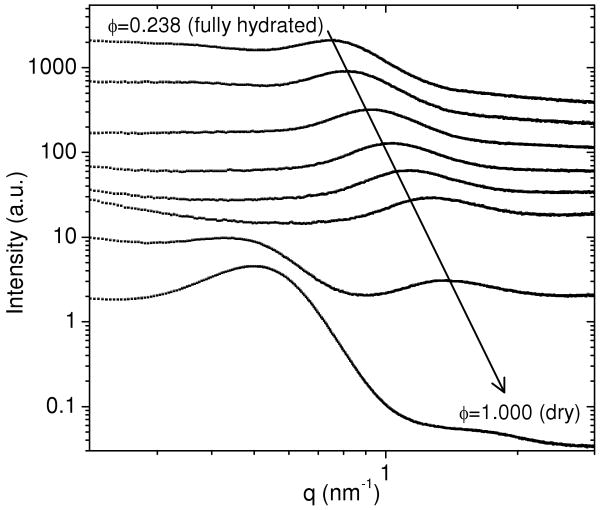
For the correlation peak to correspond to the well-ordered spacing of the crosslink junctions in the PEG network, the peak position should shift to a higher q (smaller length scale) as the volume fraction of polymer in the hydrogel increases. This trend was seen when the molecular weight was varied, as shown in Figure 1. To further examine the effect of changing the polymer volume fraction, a PEG-DA(3.4k)-50% hydrogel was dried in a humidity-controlled chamber, with SAXS measurements made approximately every 30 min. Figure 2 shows the scattering curves for fully swollen, partially dried, and fully dried PEG-DA(3.4k)-50%. As the PEG hydrogel was dried, the correlation peak position shifted to a higher q, indicating that the distance between crosslink junctions decreased. When most of the water was removed from the hydrogel at a polymer volume fraction of φ = 0.931, a second peak became visible near q = 0.5 nm-1. This peak is caused by the partial crystallization of the PEG chains as the hydrogel is dried. A peak in the SAXS near q = 0.5 nm-1 is consistent with previous studies on the structure of semi-crystalline PEG.18 The semi-crystalline nature of this peak is confirmed by the wide angle x-ray scattering (WAXS) pattern from a dried PEG hydrogel (Figure S03 in the Supplemental Information), which shows sharp diffraction peaks. These peaks indicate molecular scale ordering in semi-crystalline PEG chains. At a volume fraction of φ = 0.931, the correlation peak relating to the crosslink junction spacing could still be observed, yielding a crosslink spacing of 4.3 nm. This distance is predicted well by the end-to-end distance of an ideal Gaussian chain, which is given as 4.6 nm, as shown in Table 2. This suggests that at low degrees of swelling, the PEG chain conformation is modeled well as an ideal Gaussian chain. Upon complete dehydration of the PEG network, however, the correlation peak due to the crosslink junction spacing becomes obscured by the semi-crystalline lamellar peak.
Figure 2.
As a PEG-DA(3.4k)-50% hydrogel is dried (curves from top to bottom), the peak due to the crosslink spacing shifts to a smaller length scale, as indicated by the arrow. At a particular polymer volume fraction (φ = 0.931) (second from bottom), a second peak near q = 0.5 nm-1 begins to appear as some PEG chains begin to form ordered domains. Intensities are in arbitrary units and are offset for clarity.
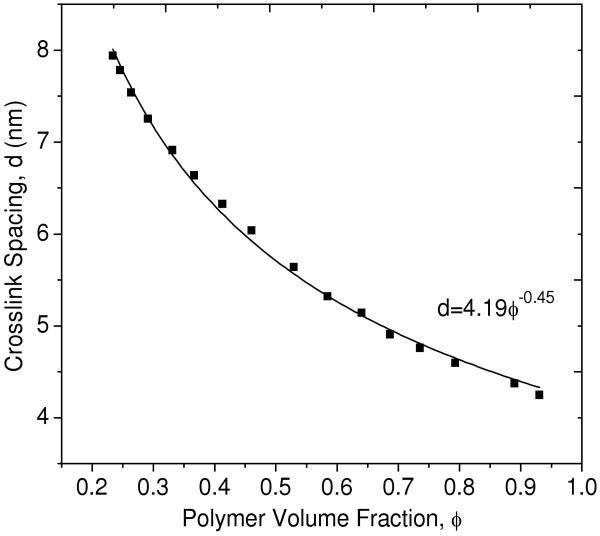
Figure 3 shows the crosslink spacing in the PEG network as a function of increasing polymer volume fraction as the PEG-DA(3.4k)-50% hydrogel was dried. The data are fit to a power law (Equation 3), where d is the crosslink spacing, C1 is a proportionality constant, and ν2 is a scaling exponent. For a three-dimensional PEG chain morphology, the crosslink spacing should scale with the polymer volume fraction as d∼φ-0.33, while for a two-dimensional morphology the crosslink spacing should scale as d∼φ-0.50. The scaling exponent observed here is ν2 = -0.45, which is between that for two and three dimensional networks but closer to that of a two-dimensional network. This suggests that PEG-DA(3.4k)-50% hydrogels may have a PEG chain conformation that scales more closely to a two-dimensional object rather than a three-dimensional one.
Figure 3.
Crosslink spacing vs. polymer volume fraction as a PEG-DA(3.4k)-50% hydrogel is dried. The solid line represents a best fit to the power law relationship shown.
| (3) |
The crosslink spacing was also plotted as a function of the macromonomer molecular weight, which is shown in the inset in Figure 1. The data are fit to the power law (Equation 4) with a scaling exponent ν1 = 0.81. This is near the scaling relationship expected for a 2-D SAW which is given as d∼Mn0.75. Since Mn is proportional to the number of Kuhn segments, N, this is an analogous scaling relationship to the end-to-end distance of a polymer chain modeled as a 2-D SAW given previously. This near two-dimensional scaling is consistent with the scaling observed for the crosslink spacing with the polymer volume fraction.
| (4) |
Due to the unique hydrogen bonding interaction between PEG and water, the conformation of PEG chains swollen in an aqueous solution is still a subject of debate in the literature. Some studies suggest that a random walk (Gaussian) or self-avoiding random walk chain structure holds, while others predict a more ordered structure resulting from the hydrogen bonding interactions between PEG and water.16, 19-24 In fact, one recent SANS study on the conformation of PEG suggests that PEG chains (Mn = 2.0k - 8.0k g/mol) may even adopt a two-dimensional planar structure in aqueous solutions.24 A more planar PEG structure could perhaps explain the more two-dimensional-like scaling we observe here. Our measurements of the spacing between crosslink junctions within photopolymerized PEG networks suggest that the end-to-end distance of the PEG chains within the network is close to that of an ideal Gaussian chain only at very low swelling ratios. As the network swells to equilibrium swelling, the PEG chains become more extended than a simple 3D-SAW and may adopt a more fully extended two-dimensional conformation; however, the end-to-end chain distance is still less extended than what is predicted by a pure 2-D SAW.
Effect of solvent quality
In addition to SAXS measurements on water-swollen PEG hydrogels, SAXS was also performed on PEG networks swollen in acetonitrile, a polar organic solvent, and toluene, a non-polar organic solvent. PEG-DA networks in acetonitrile and toluene were prepared by first polymerizing the networks in deionized water at 50% wt./wt., drying the networks, and then reswelling them in either acetonitrile or toluene. These measurements were performed to determine if swelling in an organic solvent could more efficiently solubilize the crosslink junctions such that the electron density contrast between the more hydrophobic polyacrylate crosslink junctions and the remainder of the PEG network could be reduced.
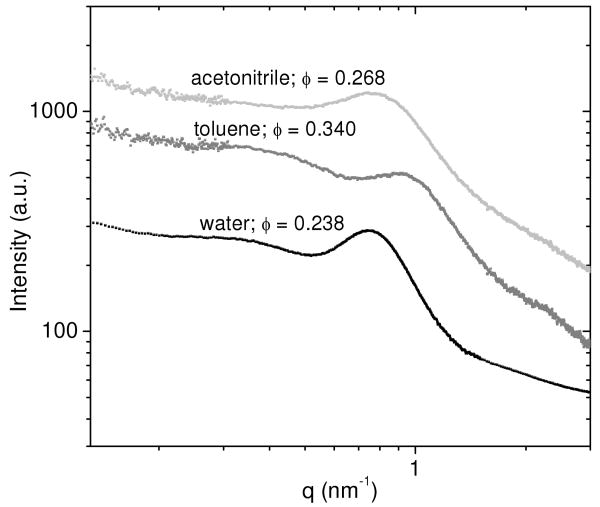
Figure 4 shows the scattering curves for PEG networks swollen in deionized water, acetonitrile, and toluene. PEG networks swollen in acetonitrile and toluene maintained a correlation peak in the scattering pattern; however, the peaks broadened and shifted to a higher q. The peak broadening may indicate that toluene and acetonitrile solubilize the crosslink junctions to some extent, but not to a significant enough degree to eliminate the correlation peak in the SAXS pattern. PEG networks also have an increased equilibrium volume fraction of polymer when swollen in acetonitrile (φ = 0.268) and toluene (φ = 0.340) compared to water (φ = 0.238). Since the PEG chains are not as swollen in acetonitrile and toluene, the distance between crosslink junctions will be smaller. The shift of the correlation peak position to a higher q value (smaller length scale) is therefore consistent with the interpretation of the peak as the distance between crosslink junctions.
Figure 4.
SAXS curves from PEG-DA(3.4k) networks swollen in acetonitrile (light gray), toluene (gray), and deionized water (black). Equilibrium volume fractions of polymer (φ) are shown for each solvent. PEG networks swollen in deionized water have the most well-defined correlation peak.
SAXS from PEG hydrogels under uniaxial tension
To further confirm that the correlation peak in the SAXS pattern is related to the spacing between the crosslink junctions, SAXS was performed on PEG hydrogel samples placed under uniaxial tension. If the correlation peak is generated by uniform spacing between crosslink junctions and if affine deformation is assumed, then the peak position should shift to a lower q in the direction parallel to the strain and to a higher q in the direction perpendicular to the strain.
A rectangular slab of a PEG-DAam(8.0k)-20% hydrogel was brought to 20% strain and held for the duration of the SAXS data accumulation (10 min). This 20% strain was chosen to demonstrate the expected behavior of the SAXS pattern, not to show the maximum strain. The one-dimensional reduction of SAXS data was performed by splitting the two-dimensional SAXS pattern into directions perpendicular and parallel to the axis of the uniaxial tension. Figure 5a shows the resultant one-dimensional SAXS reduction in both the perpendicular and parallel directions, and Figure 5b shows the original two-dimensional SAXS patterns.
Figure 5.
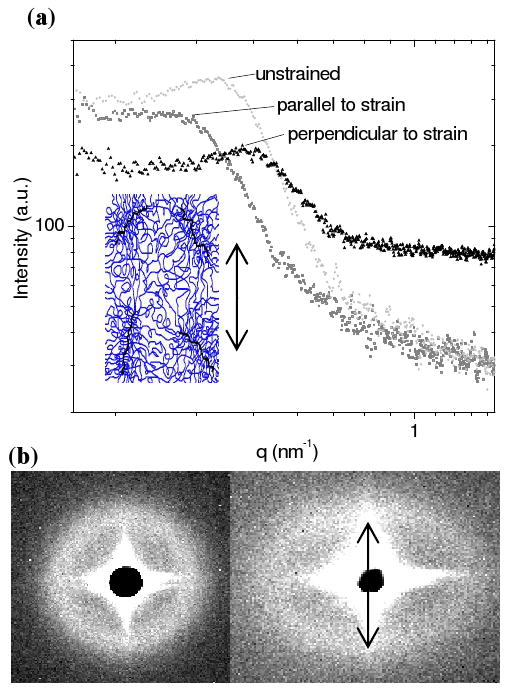
(a) One-dimensional reduction of the SAXS pattern from a PEG-DAam(8.0k)-20% hydrogel placed under uniaxial tension. The inset shows a schematic of a PEG network under strain. (b) Two-dimensional SAXS patterns for the same hydrogel under no strain (left) and under a 20% strain (right). The arrow indicates the direction of the strain in the hydrogel. The intense scattering pattern surrounding the beamstop is due to slit scattering, which is subtracted in the one-dimensional reduction.
SAXS from PEG hydrogels placed under uniaxial tension show that the correlation peak does in fact shift in a manner that is consistent with the interpretation of the peak as the distance between crosslink junctions. As shown in Figure 5, PEG hydrogels placed under uniaxial tension displayed an anisotropic SAXS pattern. The correlation peak shifted to a higher q in the direction perpendicular to the deformation and to a lower q in the direction parallel to the deformation. This indicates that the crosslink spacing in the direction perpendicular to the tension decreased while the crosslink spacing in the direction parallel to the tension increased. The broadening of the correlation peak in the direction parallel to the axis of deformation may be due to the fact that the SAXS data were averaged over 10 min during which some chain relaxation may occur. Unfortunately, chain relaxation during the course of the measurement makes it difficult to determine a more quantitative relationship between nanoscale deformation and macroscale deformation.
SAXS from in situ polymerized PEG
We measured the SAXS pattern of PEG-DA and PEG-DAam macromonomer precursor solutions in order to determine whether the more hydrophobic end-groups associated into well-ordered clusters before polymerization. Figure 6 shows how the scattering curves developed as a PEG-DA(3.4k)-30% precursor solution was exposed to the SAXS beamline x-ray radiation. Initially, there was no correlation peak, indicating that there was no well-ordered structure detectable in either the PEG-DA or PEG-DAam macromonomer precursor solutions. However, after 60 seconds of exposure to x-ray radiation, a correlation peak began to develop. Upon further exposure, the correlation peak became sharper and shifted to a slightly higher-q (smaller length scale). After 240 seconds of total exposure time, the peak intensity and position did not change further. Following the measurement, a transparent gel the size and shape of the x-ray beam was obtained. Using diol-terminated PEG solutions as a control having no polymerizable functional groups, we found that no correlation peak develops nor was a gel formed after x-ray exposure. The formation of this correlation peak is therefore attributed to the formation of a network structure with regular spacing between dense crosslink junctions that act as the scattering centers.
Figure 6.
SAXS curves showing in situ polymerization of a PEG-DA(3.4k)-30% precursor solution. The scattering curve after 20 s of x-ray exposure (light gray) shows no well defined peak, but after 240 s of total exposure (black), gelation occurs and a correlation peak appears.
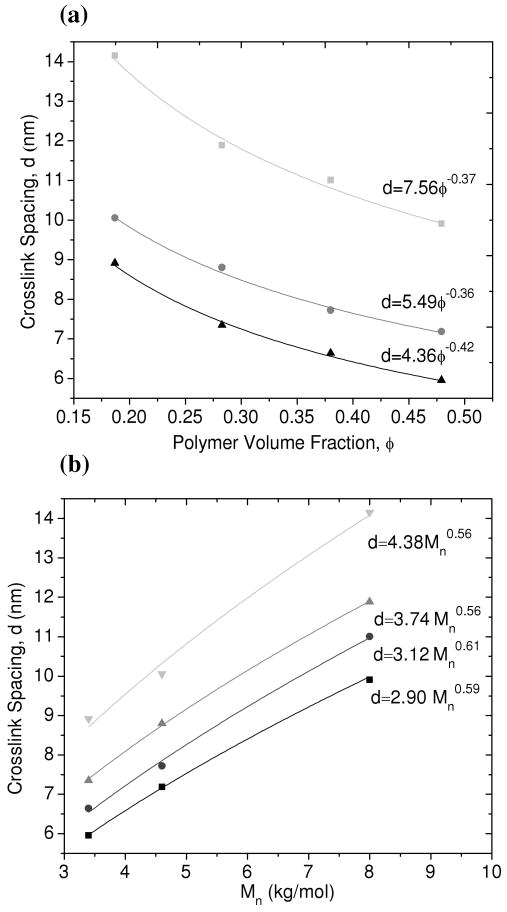
In the same manner as the equilibrium-swollen hydrogels, the correlation peak position for in situ polymerized hydrogels should change in a predictable fashion if the peak was, in fact, generated by the spacing between crosslink junctions within the network. Figure 7a shows how the crosslink spacing scales with volume fraction of polymer. The scaling of the crosslink spacing with polymer volume fraction was found to be between d∼φ-0.36 and d∼φ-0.42, dependent on Mn. For PEG-DA(3.4k), the scaling relationship d∼φ-0.42 is close to that observed for the equilibrium-swollen UV-polymerized network of the same molecular weight (d∼φ-0.45). The scaling exponents for Mn = 8.0k and Mn = 4.6k are lower but they are still in between what is expected for a 3D network (d∼φ-0.33) and a 2D network (d∼φ-0.50).
Figure 7.
(a) Crosslink spacing vs. polymer volume fraction for PEG-DA(8.0k) ( ), PEG-DA(4.6k) (
 ), and PEG-DA(3.4k) (▲) hydrogels polymerized in situ by x-ray radiation. Solid lines represent best fits to the power law relationship shown. (b) Crosslink spacing vs. macromonomer molecular weight at a polymer concentration of 20% wt/wt (
 ), 30% wt/wt (
 ), 40% wt/wt (●), and 50% wt/wt (■).
Figure 7b shows the relationship between the crosslink spacing within the network and the PEG macromonomer molecular weight. The scaling with molecular weight for each volume fraction of polymer is between d∼Mn0.56 and d∼Mn0.61. This is nearly identical to what is predicted for fully swollen chains that are modeled as a 3D-SAW, where the scaling relationship is d∼Mn0.588.
It is interesting that a more three-dimensional scaling was observed for the in situ polymerized PEG networks, whereas a more two-dimensional scaling was observed for equilibrium-swollen PEG networks. Immediately after polymerization, the PEG chains may maintain a good solvent conformation closer to a 3D-SAW, but then after the network reaches equilibrium swelling, the PEG chains become more extended and have a more two-dimensional conformation. Although the limited number of data points in this study makes it difficult to precisely determine the scaling relationships, the observed scaling exponents are in a range that is reasonable for a PEG chain conformation between two and three dimensions. The observed scaling relationships are therefore consistent with the interpretation of the correlation peak in the SAXS pattern as the spacing between crosslink junctions within the PEG network.
Estimation of crosslink functionality
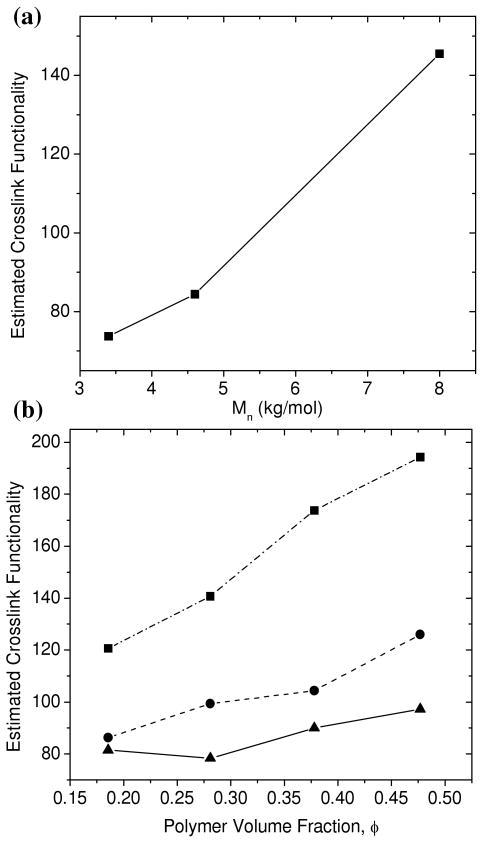
The crosslink functionality or the degree of polymerization of the PEG-DA macromonomers was estimated for both equilibrium-swollen PEG-DA-50% networks prepared by UV polymerization and for in situ x-ray polymerized networks. The crosslink functionality estimates range between 70 and 200 and are shown in Figure 8a for the UV polymerized networks and in Figure 8b for the in situ x-ray polymerized networks. The crosslink functionality estimates increase with increasing polymer concentration in precursor solutions and increased PEG macromonomer molecular weight. The crosslink functionality for equilibrium-swollen UV polymerized networks were 20-30% lower than for the in situ polymerized PEG networks. This may be due to reduced initiation efficiency in the x-ray polymerized hydrogels where no photoinitiator was present. A lower number of initiation events would lead to a higher degree of polymerization of PEG macromonomers. Additionally, the equilibrium-swollen hydrogels were washed extensively before the SAXS measurements such that any unreacted PEG macromonomers were extracted. The concentration of reacted end-groups for equilibrium-swollen PEG hydrogels therefore accounts for the polymer sol-fraction.
Figure 8.
(a) Estimated crosslink functionalities as a function of Mn for UV-polymerized PEG-DA-50% hydrogels swollen to equilibrium. (b) Estimated crosslink functionalities for networks polymerized in situ by the SAXS x-ray radiation for PEG-DA(3.4k) (–▲–▲–), PEG-DA(4.6k) (--●--●--), and PEG-DA(8.0k) (-·-■-·-■--).
The estimates for the crosslink functionality are average values since in reality there is a distribution of crosslink functionalities. Additionally, we cannot rule out the possibility that not all of the end-groups have reacted or that some intrachain loops have formed. Unreacted end-groups would cause an overestimation of the number of participating end-groups in each crosslink junction, leading to an overestimation of the crosslink functionality. Nevertheless, we believe these values provide a reasonable approximation for the degree of polymerization of the crosslink junctions.
Given the relatively high estimates for the crosslink functionality, it is worth considering the likely conformation of the crosslink junctions. Previous studies have explored the conformation of free radical polymerized macromonomers, wherein only one end-group is functionalized.25-30 If the degree of polymerization of these polymacromonomers is relatively low, they are best represented as star polymers where many chains originate from a central core. However, free radical polymerizations readily yield high degrees of polymerization and longer polymacromonomers are better represented as “molecular bottle-brushes”. In this case, the polyacrylate backbone adopts a more fully extended flexible rod conformation due to the steric hindrance from the densely grafted PEG chains.25-30 The conformations of the polymer chains grafted to the flexible rod backbone have been modeled in some cases as unperturbed 3D-SAWs as expected for polymer chains in a good solvent. In other cases, the chains have been modeled as more extended 2D-SAWs wherein the side chains are confined in the quasi-two-dimensional space formed with adjacent side chains.26, 28, 29 Given our estimates for the crosslink functionality between 70 and 200, the structure of the crosslink junctions within photopolymerized PEG-DA and PEG-DAam networks can be thought of as analogous to the molecular bottle-brush model except that each PEG chain terminates at a crosslink junction such that the hydrogel structure consists of a network of molecular bottle-brushes (Figure 9). The correlation peak position, therefore, gives us the average spacing between the dense crosslink junction regions within the hydrogel.
Figure 9.
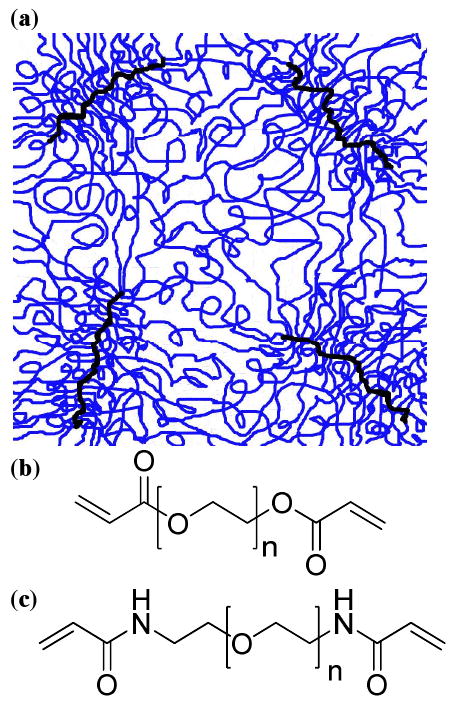
(a) Schematic depicting the structure of photopolymerized PEG hydrogels with dense extended crosslink junctions spaced 6 - 16 nm apart. The thick dark lines represent the crosslink junctions and the lighter lines represent the PEG chains. These junctions are spaced uniformly enough such that there is a correlation peak in the SAXS pattern. Photopolymerized PEG networks are generated with either (b) diacrylate or (c) diacrylamide end-groups.
Compressive mechanical testing and comparison to other PEG-based networks
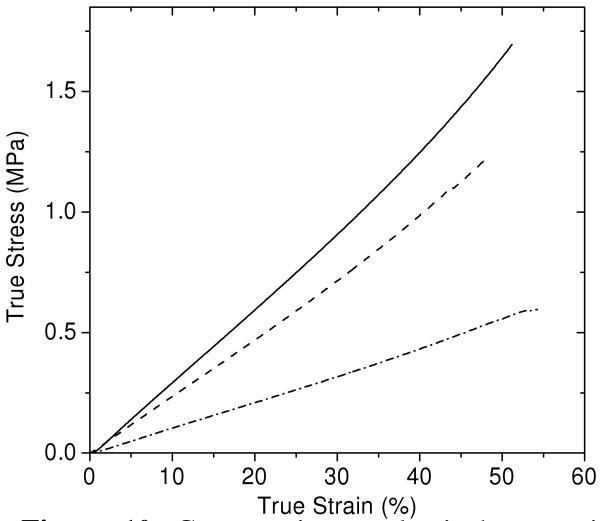
Compressive tests were performed on equilibrium-swollen PEG-DA-50% hydrogels to evaluate their mechanical properties and to compare them to PEG networks prepared by other methods. These hydrogels were prepared with 50% wt/wt. precursor solutions and were then allowed to reach equilibrium swelling, which yielded hydrogels with equilibrium polymer volume fractions shown in Table 1. Figure 10 shows representative stress-strain curves for PEG-DA-50% hydrogels and Table 3 summarizes the average values obtained for the initial compressive modulus, maximum true strain, and maximum true stress for each hydrogel.
Figure 10.
Compressive mechanical properties for equilibrium-swollen PEG-DA(3.4k) (—), PEG-DA(4.6k) (----), and PEG-DA(8.0k) (-·-·-) hydrogels that were prepared at 50% wt/wt.
Table 3. Initial compressive moduli, fracture strains, and fracture stresses for equilibrium-swollen PEG-DA hydrogels that were prepared 50% wt/wt.
| PEG Mn (g/mol) | Init.Mod. 5-15% (MPa) | Fracture Strain (%) | Fracture Stress (MPa) |
|---|---|---|---|
| 8000 | 1.02 ± 0.04 | 57.68 ± 4.40 | 0.57 ± 0.07 |
| 4600 | 2.24 ± 0.11 | 49.85 ± 7.38 | 1.19 ± 0.29 |
| 3400 | 2.91 ± 0.12 | 49.10 ± 7.50 | 1.50 ± 0.33 |
A higher molecular weight PEG macromonomer resulted in hydrogels with a lower volume fraction of polymer (Table 1), a lower initial modulus, and a lower fracture stress. This is expected as higher molecular weight PEG macromonomers yield networks with a lower number of crosslink junctions per unit volume. The fracture strain, however, was not as strongly affected by the PEG macromonomer molecular weight, with maximum fracture strains occurring near 50-60% strain for each sample. This may indicate that the maximum fracture strain is influenced more by macroscopic defects within the hydrogels rather than molecular level considerations.
The mechanical properties of model end-linked PEG networks have been studied extensively by Gnanou, Hild, and Rempp.1-3 The PEG networks studied by Gnanou and coworkers were prepared via a step polymerization of diol-terminated PEG macromonomers reacted with multifunctional isocyanate crosslinkers. This yielded networks crosslinked by urethane linkages with functionality ranging from 2 to 7. The crosslink functionality in these hydrogels is much lower than the crosslink functionality estimated for the photopolymerized PEG hydrogels in the current study. The compressive moduli, denoted as E, of the urethane crosslinked PEG hydrogels were evaluated as a function of polymer volume fraction, φ, and polymer volume fraction during crosslinking, φc, for PEG macromonomers with Mn ranging from 1.0k-8.0k g/mol. Three of the hydrogels prepared by Gnanou and coworkers (Mn = 3.4k g/mol, φc = 0.50, E = 0.52 MPa; Mn = 5.6k g/mol, φc = 0.48, E = 0.61 MPa; Mn = 8.3k g/mol, φc = 0.47, E = 0.79 MPa) had similar PEG molecular weights and polymer volume fractions during crosslinking compared to the photopolymerized PEG networks in the current study. Additionally, each of these networks had a similarly low unreacted sol-fraction of less than 0.02. Interestingly, the equilibrium polymer volume fraction and the compressive moduli of the urethane crosslinked PEG networks were found to be much lower compared to photopolymerized PEG networks in the current study. Gnanou and coworkers found that the equilibrium polymer volume fraction in their networks (φ = 0.077-0.106) was about half that of our photopolymerized PEG hydrogels (φ = 0.156-0.238). Moreover, the compressive moduli of these networks ranged from 0.52 to 0.79 MPa and were also significantly lower than the compressive moduli of our photopolymerized PEG networks, which ranged from 1.02 to 2.91 MPa. Since similar PEG macromonomer molecular weights and polymer volume fractions during network formation were used for both the urethane crosslinked PEG networks and our photopolymerized PEG networks, it is reasonable to assume that the number of trapped entanglements within each type of PEG network is comparable. The differences in swelling and compressive moduli are, therefore, attributed to the significant difference in the crosslink junction functionality and the resulting crosslink morphology. The urethane crosslinked PEG networks have relatively small crosslink junctions with a functionality (2 to 7), whereas our photopolymerized PEG networks have much larger crosslink junctions that likely resemble a molecular bottle-brush morphology (crosslink functionality from 70 to 200).
The nanoscale structural differences between networks with low functionality crosslink junctions and networks with high functionality crosslink junctions can be revealed by differences in the small angle scattering from these networks. Even though end-linked networks with low crosslink functionality have a uniform molecular weight between crosslinks, previous work in the literature has shown that such networks typically do not have a correlation peak in their small angle scattering. For instance, networks with low crosslink functionality prepared from polydimethylsiloxane (PDMS) or polystyrene (PS) lack correlation peaks unless selective deuteration of the crosslink junctions is used to generate contrast for SANS.31, 32 The lack of a correlation peak in these systems is, thus, due to the fact that the crosslink junctions do not have sufficient size or difference in electron density from the rest of the network to act as distinct scattering centers.
One previous small angle scattering study on PEG hydrogels by Shekuov, Taylor, and Grossman did show a correlation peak in the SAXS.33, 34 Shekuov and coworkers prepared end-linked PEG networks with urethane linkages in a similar manner to Gnanou and coworkers; however, they also added a tri-hydroxy terminated crosslinker in addition to the diol-terminated PEG and multi-functional isocyanate crosslinkers. This addition allowed them to achieve much higher crosslink functionality. The fact that these networks have high crosslink functionality and also exhibit a peak in their SAXS is consistent with our reasoning that high crosslink functionality is required to generate a SAXS correlation peak.
Our line of reasoning is further supported by a more recent study, wherein Sakai and coworkers generated PEG networks with a crosslink functionality of exactly four by linking together four-armed PEG macromonomers with each arm terminated by either N-hydroxysuccinimide (NHS) or a primary amine.35-37 These PEG hydrogels are referred to as “tetra-PEG” hydrogels and are described as having enhanced strain and stress at break due to their near-perfect network structure. Despite the uniform molecular weight between crosslinks and the well-ordered structure of these networks, no correlation peak is present in the SANS due to the low crosslink functionality.36, 37 Mechanical testing reported for “tetra-PEG” hydrogels revealed that these networks exhibited a strain hardening response before failure and had a higher strain at break than photopolymerized PEG hydrogels (near 90% strain compared to 50-60% strain for photopolymerized PEG hydrogels). A direct comparison between the mechanical properties of “tetra-PEG” hydrogels and the mechanical properties of photopolymerized PEG hydrogels is difficult to assess since the “tetra-PEG” hydrogels had a higher molecular weight between crosslinks (10.0k-20.0k g/mol) and were prepared at a lower polymer volume fraction (φ = 0.06). However, the compressive moduli reported for “tetra-PEG” hydrogels (0.04 MPa) are significantly lower than the compressive moduli of photopolymerized PEG networks (1.02-2.91 MPa).35 Despite differences between the networks, the lack of a correlation peak in the SANS from “tetra-PEG” networks and their corresponding lower compressive moduli are still consistent with our reasoning that networks with crosslink junctions of high functionality are required to generate a peak in the small angle scattering pattern and that such networks generally have lower degrees of swelling and higher compressive moduli.
Conclusions
PEG hydrogels generated by photopolymerization of macromonomers functionalized with either acrylate or acrylamide end-groups result in PEG networks with evenly spaced crosslink junctions of high functionality. The high functionality crosslink junctions likely resemble a molecular bottle brush morphology wherein the steric hindrance from densely grafted PEG chains results in an extended flexible rod-like crosslink junction. The average spacing of these crosslink junctions is controlled by the uniform molecular weight of the PEG macromonomers and is confirmed by SAXS patterns that show a distinct correlation peak. In situ SAXS measurements show that the correlation peak arises during the polymerization process, indicating that the quasi-ordered structure is generated during network formation. The position of the peak is affected by the volume fraction of polymer, PEG macromonomer molecular weight, solvent quality, and uniaxial tension in a manner that is consistent with the interpretation of this peak as the spacing between crosslink junctions. Since the location of the peak in the scattering function yields the spacing between crosslink junctions, the SAXS technique is a useful nondestructive probe of the PEG chain conformation in the hydrogel's native state.
Previous literature shows that model networks prepared from macromonomers with different end-linking mechanisms do not always show a correlation peak in their SAXS/SANS pattern. The lack of a correlation peak in these systems is attributed to low functionality crosslink junctions, which do not have sufficient electron density contrast with the rest of the polymer network to produce a correlation peak. Photopolymerized PEG hydrogels with high functionality crosslink junctions and a correlation peak in their small angle scattering are shown here to have lower degrees of swelling and an enhanced compressive modulus compared to networks with lower crosslink functionality. These differences highlight the fact that the mechanisms used for linking together PEG macromonomers have a significant impact on both the nature of the crosslink junctions and the nanoscale network structure. These structural differences can have a measurable effect on the resulting swelling and mechanical properties of the hydrogel. It is important to consider that linking together well-defined macromonomers does not always produce the same nanoscale structure and, therefore, does not always result in the same macroscopic properties.
Supplementary Material
Acknowledgments
The authors thank the National Institutes of Health (NIH) grant R01 EY016987-03 for funding. Portions of this research were carried out at the Stanford Synchrotron Radiation Lightsource (SSRL), a national user facility operated by Stanford University on behalf of the U.S. Department of Energy, Office of Basic Energy Sciences. The authors thank John Pople at SSRL for assistance with SAXS measurements on beamline 1-4, Anne Martel and Thomas Weiss at SSRL for assistance with measurements on beamline 4-2, and Boualem Hammouda and Andrew Jackson at the National Center for Neutron Research (NCNR) for helpful discussions. Additional thanks to Prof. Joon-Seop Kim for advice on revising this manuscript for publication.
Footnotes
Supporting Information Available: Supplemental information containing additional figures referenced in this manuscript is available online. This material is available free of charge via the Internet at http://pubs.acs.org
References
- 1.Gnanou Y, Hild G, Rempp P. Macromolecules. 1984;17(4):945–952. [Google Scholar]
- 2.Gnanou Y, Hild G, Rempp P. Macromolecules. 1987;20(7):1662–1671. [Google Scholar]
- 3.Hild G. Progress in Polymer Science. 1998;23(6):1019–1149. [Google Scholar]
- 4.Peppas NA, Keys KB, Torres-Lugo M, Lowman AM. Journal of Controlled Release. 1999;62(1-2):81–87. doi: 10.1016/s0168-3659(99)00027-9. [DOI] [PubMed] [Google Scholar]
- 5.Myung D, Koh WU, Ko JM, Hu Y, Carrasco M, Noolandi J, Ta CN, Frank CW. Polymer. 2007;48(18):5376–5387. [Google Scholar]
- 6.Mann BK, Gobin AS, Tsai AT, Schmedlen RH, West JL. Biomaterials. 2001;22(22):3045–3051. doi: 10.1016/s0142-9612(01)00051-5. [DOI] [PubMed] [Google Scholar]
- 7.Salinas CN, Cole BB, Kasko AM, Anseth KS. Tissue Engineering. 2007;13(5):1025–1034. doi: 10.1089/ten.2006.0126. [DOI] [PubMed] [Google Scholar]
- 8.Cushing MC, Anseth KS. Science. 2007;316(5828):1133–1134. doi: 10.1126/science.1140171. [DOI] [PubMed] [Google Scholar]
- 9.Chu B, Hsiao BS. Chemical Reviews. 2001;101(6):1727–1761. doi: 10.1021/cr9900376. [DOI] [PubMed] [Google Scholar]
- 10.Collinson E, Dainton FS, McNaughton GS. Transactions of the Faraday Society. 1957;53(4):476–488. [Google Scholar]
- 11.Elbert DL, Hubbell JA. Biomacromolecules. 2001;2(2):430–441. doi: 10.1021/bm0056299. [DOI] [PubMed] [Google Scholar]
- 12.Welsh WJ. Physical Properties of Polymers Handbook. AIP Press; Woodbury, NY: 1996. pp. 401–407. [Google Scholar]
- 13.Serero Y, Aznar R, Porte G, Berret JF, Calvet D, Collet A, Viguier M. Physical Review Letters. 1998;81(25):5584–5587. [Google Scholar]
- 14.Tae GY, Kornfield JA, Hubbell JA, Lal JS. Macromolecules. 2002;35(11):4448–4457. [Google Scholar]
- 15.Gong JP, Katsuyama Y, Kurokawa T, Osada Y. Advanced Materials. 2003;15(14):1155–1158. [Google Scholar]
- 16.Mark JE, Flory PJ. Journal of the American Chemical Society. 1965;87(7):1415–&. [Google Scholar]
- 17.Rubinstein M, Colby RH. Polymer Physics. Oxford University Press; New York, NY: 2003. p. 326. [Google Scholar]
- 18.Cheng SZD, Zhang AQ, Barley JS, Chen JH, Habenschuss A, Zschack PR. Macromolecules. 1991;24(13):3937–3944. [Google Scholar]
- 19.Kjellander R, Florin E. Journal of the Chemical Society-Faraday Transactions I. 1981;77:2053–2077. [Google Scholar]
- 20.Devanand K, Selser JC. Nature. 1990;343(6260):739–741. [Google Scholar]
- 21.Bieze TWN, Barnes AC, Huige CJM, Enderby JE, Leyte JC. J Phys Chem. 1994;98(26):6568–6576. [Google Scholar]
- 22.Thiyagarajan P, Chaiko DJ, Hjelm RP. Macromolecules. 1995;28(23):7730–7736. [Google Scholar]
- 23.Polverari M, vandeVen TGM. J Phys Chem. 1996;100(32):13687–13695. [Google Scholar]
- 24.Rubinson KA, Krueger S. Polymer. 2009;50(20):4852–4858. [Google Scholar]
- 25.Wataoka I, Urakawa H, Kajiwara K, Schmidt M, Wintermantel M. Polymer International. 1997;44(3):365–370. [Google Scholar]
- 26.Saariaho M, Szleifer I, Ikkala O, ten Brinke G. Macromolecular Theory and Simulations. 1998;7(2):211–216. [Google Scholar]
- 27.Ito K, Kawaguchi S. Advances in Polymer Science. 1999;142:129–178. [Google Scholar]
- 28.Shiokawa K, Itoh K, Nemoto N. Journal of Chemical Physics. 1999;111(17):8165–8173. [Google Scholar]
- 29.Rathgeber S, Pakula T, Wilk A, Matyjaszewski K, Beers KL. Journal of Chemical Physics. 2005;122(12) doi: 10.1063/1.1860531. [DOI] [PubMed] [Google Scholar]
- 30.Sheiko SS, Sumerlin BS, Matyjaszewski K. Progress in Polymer Science. 2008;33(7):759–785. [Google Scholar]
- 31.Mendes E, Hakiki A, Herz J, Boue F, Bastide J. Macromolecules. 2004;37(7):2643–2649. [Google Scholar]
- 32.Sukumaran SK, Beaucage G, Mark JE, Viers B. European Physical Journal E. 2005;18(1):29–36. doi: 10.1140/epje/i2005-10030-x. [DOI] [PubMed] [Google Scholar]
- 33.Shekunov BY, Taylor P, Grossmann JG. Journal of Crystal Growth. 1999;198:1335–1339. [Google Scholar]
- 34.Shekunov BY, Chattopadhyay P, Tong HHY, Chow AHL, Grossmann JG. Journal of Pharmaceutical Sciences. 2007;96(5):1320–1330. doi: 10.1002/jps.20950. [DOI] [PubMed] [Google Scholar]
- 35.Sakai T, Matsunaga T, Yamamoto Y, Ito C, Yoshida R, Suzuki S, Sasaki N, Shibayama M, Chung Ui. Macromolecules. 2008;41(14):5379–5384. [Google Scholar]
- 36.Matsunaga T, Sakai T, Akagi Y, Chung U, Shibayama M. Macromolecules. 2009;42(4):1344–1351. [Google Scholar]
- 37.Matsunaga T, Sakai T, Akagi Y, Chung UI, Shibayama M. Macromolecules. 2009;42(16):6245–6252. [Google Scholar]
Associated Data
This section collects any data citations, data availability statements, or supplementary materials included in this article.


