Abstract
Experimental postexcitation signal data of collapsing Definity microbubbles are compared with the Marmottant theoretical model for large amplitude oscillations of ultrasound contrast agents (UCAs). After taking into account the insonifying pulse characteristics and size distribution of the population of UCAs, a good comparison between simulated results and previously measured experimental data is obtained by determining a threshold maximum radial expansion (Rmax) to indicate the onset of postexcitation. This threshold Rmax is found to range from 3.4 to 8.0 times the initial bubble radius, R0, depending on insonification frequency. These values are well above the typical free bubble inertial cavitation threshold commonly chosen at 2R0. The close agreement between the experiment and models suggests that lipid-shelled UCAs behave as unshelled bubbles during most of a large amplitude cavitation cycle, as proposed in the Marmottant equation.
INTRODUCTION
Since their commercial introduction in the early 1990s,1 ultrasound contrast agents (UCAs) have gained significant interest in the ultrasound research community. UCAs are micron-sized, gas-filled bubbles that are surrounded by a thin shell coating typically consisting of albumin, lipids, or other surfactants for stability from dissolution. UCAs are successfully used in applications where their increased scattering over surrounding vasculature improves imaging.2 Other proposed uses for these microbubbles involve taking further advantage of their response to ultrasound for mechanically induced bioeffects, including sonothrombolysis,3, 4 material transport across the blood–brain barrier,5, 6, 7 and sonoporation.8, 9, 10
Understanding the dynamic behavior of these microbubbles has been a particular focus of many studies. The effect of the interfacial shell alters the response of UCAs from non-encapsulated, or free, bubbles; for example, the damping effect of an albumin shell leads to increased resonance frequency.11 Newer generation lipid-shelled microbubbles such as Definity (Lantheus Medical Imaging, N. Billerica, MA), SonoVue (Bracco Research, Geneva, Switzerland), and Sonozoid (GE Healthcare, Oslo, Norway) have also been shown to exhibit unusual dynamic behaviors including thresholding to onset of oscillation12 and “compression-only” response.13, 14
Numerous models of unshelled single bubble dynamics15, 16, 17, 18 have been developed to varying orders of accuracy based on the bubble wall Mach velocity.19 Many of these have been shown to be capable of describing the majority of the bubble oscillatory cycle even in cases of extreme bubble expansion such as occurs in single bubble sonoluminescence,20 where bubble expansion may be ten times the initial radius.21 However, experimental UCA results such as those mentioned above indicate the inadequacy of directly applying free bubble models to shelled UCAs undergoing small oscillations. Therefore, existing free bubble models have been modified to incorporate terms corresponding to the damping and elasticity of the shell material. Albumin-coated UCAs were first modeled by adding damped linear oscillator terms to describe the effect of the shell,22 while later models more rigorously derived shell terms assuming shell behavior as an elastic solid23, 24 or with an infinitesimally thin Newtonian rheology.25 Increasingly complicated behaviors observed with UCAs containing more flexible lipid shells have prompted the introduction of a rich variety of UCA models, incorporating descriptions such as Maxwell rheology,26 shear thinning,27 and strain-softening,28, 29 among others.
The earliest model to capture a wide range of lipid-based UCA responses was the Marmottant model, which postulated that the UCA shell behaves as a two-dimensional monolayer with varying surface tension.30 In contrast to other shelled bubble models which assume a continuous shell state indefinitely, a unique feature of the Marmottant model is the explicitly incorporated rupture or breakup tension based on radial growth. After reaching a specified rupture radius, the bubble is assumed to continue to behave as a single entity but with new characteristics—as an unshelled bubble. However, the validity of this claim for large amplitude UCA oscillation and collapse was unsupported by the examples provided in the original paper, and to the best of our knowledge, there have been no subsequent studies further exploring this hypothesis experimentally.
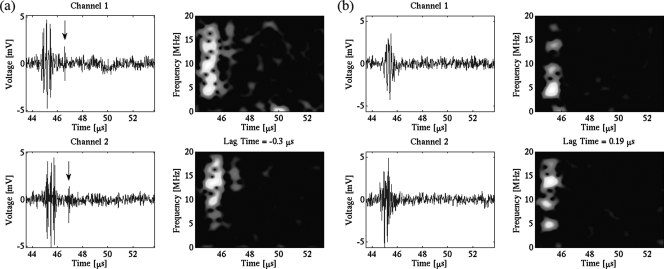
Recently, we have conducted acoustic experimental measurements of single bubble UCA collapse.31, 32 The passive cavitation detection (PCD) criterion to monitor a microbubble’s destruction was based on the relationship between two characteristic features of the acquired temporal signals: the principal response and the postexcitation signal (PES). The principal response is defined as the initial harmonic response of the microbubble lasting in duration up to that of the transmitted pulse, while the PES is defined as a secondary broadband response separated in time from the principal response—typically 1–5 μs later—whose presence indicates UCA collapse (Fig. 1). By using two receive transducers aligned orthogonally, curves of microbubble postexcitation activity as a function of peak rarefactional pressure can be obtained.33 These curves show that postexcitation activity increases in a given population of single microbubbles at a specific frequency as peak rarefactional pressure amplitude (PRPA) increases, and is therefore a useful measure for characterizing large amplitude cavitation activity.
Figure 1.
(Color online) Examples of voltage–time signals (left columns) and their corresponding frequency–time images (right columns) from a Definity microbubble at 4.6 MHz and PRPA 4.47 MPa. (a) Single bubble with postexcitation (marked with an arrow) in both receive channels. (b) Single bubble with no postexcitation, only the principal response, in both receive channels.
The physical origin of the postexcitation emissions from single UCAs is believed to be related to similar examples of free bubble rebound and re-collapse which occur with larger clouds of bubbles. For example, such behavior has been observed in simultaneous optic and PCD lithotripsy experiments34 and during sonoluminescence.35 In the proposed scenario, the encapsulated UCA undergoing inertial cavitation emits one or more free gas bubbles due to shell rupture which then serve as the source for the PES.
Previous simulation work using the Marmottant model has suggested that both shell rupture and inertial cavitation are together necessary conditions for the occurrence of PES in UCAs.36 In practice, this establishes a minimum bound on UCA postexcitation at the inertial cavitation threshold 2R0, since the shell rupture threshold for the Marmottant model is typically set to 1.5R0 or less. In this work, we more thoroughly evaluate modeling and experiment by comparing the predictions from the Marmottant equation with the experimental postexcitation curves collected for Definity microbubbles from our earlier double PCD work.33 The numerous variables which affect the modeled response of UCAs, including the forcing acoustic pressure waveform, the bubble size, and the material properties of the bubble, are determined by measurement and from values reported in the literature. The goal of this modeling is not to accurately replicate the full dynamics of a collapsing, fragmenting, and rebounding bubble, but rather to propose that experimental thresholds obtained from the rebound signal associated with shell rupture can be linked to a relatively simple model as in the case of the transient inertial collapse a free bubble.37
MATERIALS AND METHODS
Bubble size distribution
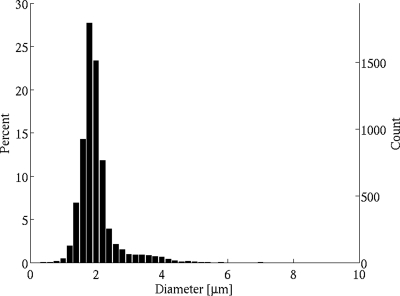
Definity UCAs are lipid-shelled microbubbles containing octafluoropropane as the gas core. The reported mean diameter range of Definity is 1.1–3.3 μm, with 98% having a diameter less than 10 μm; the maximum initial concentration is 1.2 × 10¹⁰ microspheres∕mL. In order to obtain a size distribution measurement of Definity UCAs, images were acquired using a microscope and camera system (Axiovert 200M w∕63× objective, Zeiss AxioCam MRm, Carl Zeiss Inc., Thornwood, NY) with a resolution of 0.10 μm∕pixel. The saved images were analyzed using a circular size detection routine based on the Hough transform to determine the size distribution of a standard population of Definity microbubbles. The resulting distribution from analysis of approximately 6500 microbubbles (Fig. 2) had a mean diameter of 1.98 μm, within the reported values from the manufacturer and from alternate size measurement techniques.38
Figure 2.
Measured size distribution of approximately 6500 Definity microbubbles.
Implementation of Marmottant equation
Because the modeled bubbles were undergoing large amplitude responses including inertial cavitation and rebound, the Marmottant model was modified to incorporate a van der Waals gas rather than an ideal gas. The largest percentage difference in terms of maximum radial expansion between the original and modified models for the tested range of pressures and radii was approximately 130%, suggesting there is value in making such an alteration. The modified Marmottant equation is given as
| (1) |
In this equation, ρ and c are the density and speed of sound of the surrounding medium, P0 is the ambient pressure, μ is the surrounding liquid viscosity, κ is the polytropic gas exponent (assumed to be adiabatic), h is the van der Waals’ hard-core radius, and κs is the monolayer surface dilatational viscosity. The size dependent surface tension, σ(R), is given by
| (2) |
where χ is the elastic compression modulus. We note that the modified Rayleigh–Plesset equation previously used in large amplitude free bubble studies20 is recovered when the shell term κs is set to zero and the surface tension σ(R) is always set to that of water. The parameter values used in this paper are listed in Table TABLE I..
Table 1.
Summary of values used in simulations.
The Rbreakup parameter also deserves special mention. As given, the rupture radius is determined by
| (3) |
However, the breakup radius is left as an undetermined variable in the original paper since the breakup surface tension is unknown. From the two fitted examples in the Marmottant paper, it is observed that one example uses Rbreakup = 1.06R0 while the other uses Rbreakup > 1.4R0. In a separate study involving slow, quasi-static lipid microbubble growth and dissolution,41 it has been reported that the best fit surface tension for their model is a sevenfold increase over that of water; assuming an elastic compression modulus of 0.5–1.0 N∕m as is typical for a lipid bubble shell gives 1.22R0 ≤ Rbreakup ≤ 1.41R0. In other studies which use the Marmottant model, Rbreakup has been chosen to be 1.2R036 and 1.5R0.29 Therefore, several breakup radii were tested in the range from Rrupture to 1.5R0; in nearly all cases, only minor differences (less than 10% in terms of predicted pressure thresholds) were observed among this range of breakup radii with the one exception of the lowest tested frequency, 0.9 MHz. Results are therefore reported using two values for the breakup radius, Rrupture and 1.5R0, which give the greatest differences.
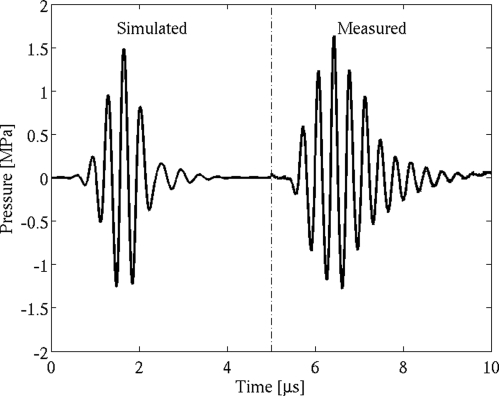
Given that water is a highly nonlinear medium, the large acoustic pressures used experimentally lead to an asymmetrical waveform at the transducer focus. In order to match closely the conditions at the confocal region while also allowing for more pressure levels to be tested than were used experimentally, simulated waveforms were generated as three cycle Gaussian-weighted pulses modified using a time-domain form of the Khokhlov–Zabolotskaya–Kuznetsov (KZK) equation to account for the effects of diffraction, absorption, and nonlinearity during propagation in water.42, 43, 44, 45 The resulting simulated waveforms yielded better agreement with calibration measurements in terms of peak compression and peak rarefaction at the focal region than did symmetric waveforms (Fig. 3).
Figure 3.
Simulated and measured three cycle, 2.8 MHz pulses (PRPA = 1.26 MPa).
The simulations were evaluated using a stiff solver routine (ode23s) in MATLAB (The MathWorks, Natick, MA). The initial radii ranged from 0.2 to 5.0 μm in increments of 0.1 μm and the bubble wall was assumed to be initially at rest. The PRPAs covered the range for each of the four frequencies used in the double PCD experiment: 0.9 MHz (0.1–1.6 MPa), 2.8 MHz (0.1–3.6 MPa), 4.6 MHz (0.2–4.0 MPa), and 7.1 MHz (0.1–4.2 MPa).
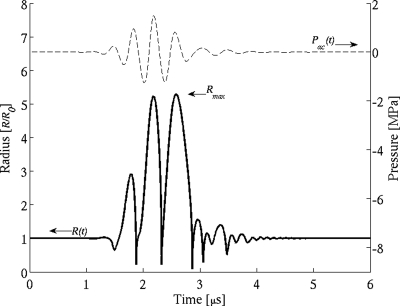
Rather than assuming any postexcitation peak from these spherically modeled bubbles will directly correspond with experimental PES measurements of a collapsing UCA, the resulting radius–time curves were instead interrogated for their maximum radial expansion, Rmax, as indicated in Fig. 4. This value was used to set up an indicator function for whether or not a bubble would be considered to have undergone postexcitation as a function of insonifying frequency, PRPA, and initial microbubble radius,
| (4) |
Figure 4.
Radial expansion of 1 μm radius Definity UCA for a 1.26 MPa PRPA pulse at 2.8 MHz.
The indicator function threshold value, a(f), is similar in form to that which is often used to define the inertial cavitation threshold of a bubble, and this threshold was individually determined for each frequency by the best fit in a least-squares sense to the experimental data points. The indicator function was then weighted by the measured bubble distribution (Fig. 2) to determine the predicted percentage of PES at each simulated pressure level.
Logistic curve fitting
As in the experimental case mentioned previously,33 the theoretical prediction of postexcitation was fit with the modified logistic equation,
| (5) |
Here, P(z) is the percentage of collapse, Q is the maximum observed fraction of PES (0 ≤ Q ≤ 1), and α0 and α1 are the fitting coefficients. The independent variable z is the logarithmic transformation of the PRPA, which is used to ensure the logistic curve begins at zero for zero acoustic pressure. This curve determines the fraction of PES present at any specified PRPA proportional to the maximum fraction observed in the pressure range for a specific frequency, and is used as a metric for comparing similar relative amounts of cavitation activity across different insonifying conditions.
RESULTS
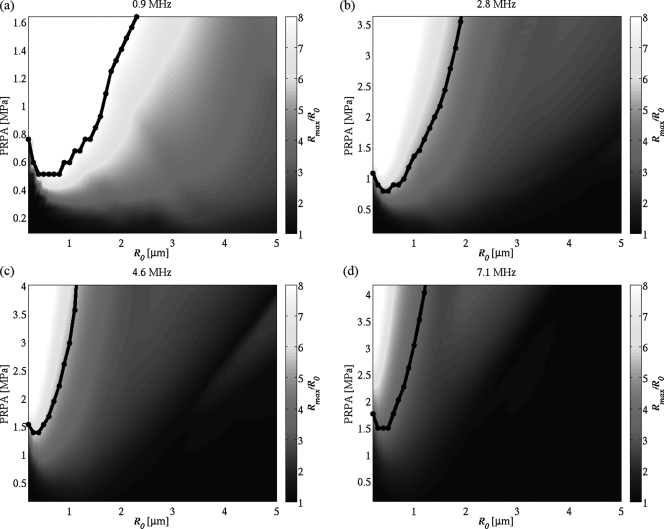
The predicted maximum radial expansions from the Marmottant equation for the case where Rbreakup = Rrupture for each frequency as a function of initial radius and PRPA are plotted in Fig. 5. These figures demonstrate trends in the response of microbubbles. As pressure is increased for a given frequency, the size of microbubble responding most strongly is seen to shift toward smaller bubbles—a downward shift in resonance frequency which is attributed to increased pressure.15, 46 For a specified PRPA, an increase in frequency narrows the range of bubble sizes expanding to a specific Rmax.
Figure 5.
(Color online) Maximum radial expansion Rmax of Definity bubbles calculated using the Marmottant equation with Rbreakup = Rrupture. The black lines indicate the threshold Rmax above which postexcitation is assumed to occur for optimal fit to the experimental results. (a) 0.9 MHz, threshold at 8.0R0; (b) 2.8 MHz, 5.0R0; (c) 4.6 MHz, 5.2R0; and (d) 7.1 MHz, 3.4R0.
The black curves in Fig. 5 indicate the lowest pressure at which a specified microbubble size reaches the threshold Rmax value yielding the best comparison with the experimental postexcitation results. These threshold Rmax values are 8.0R0 at 0.9 MHz, 5.0R0 at 2.8 MHz, 5.2R0 at 4.6 MHz, and 3.4R0 at 7.1 MHz. For PRPAs above these curves, the indicated microbubble size is assumed to undergo collapse with observable postexcitation emission.
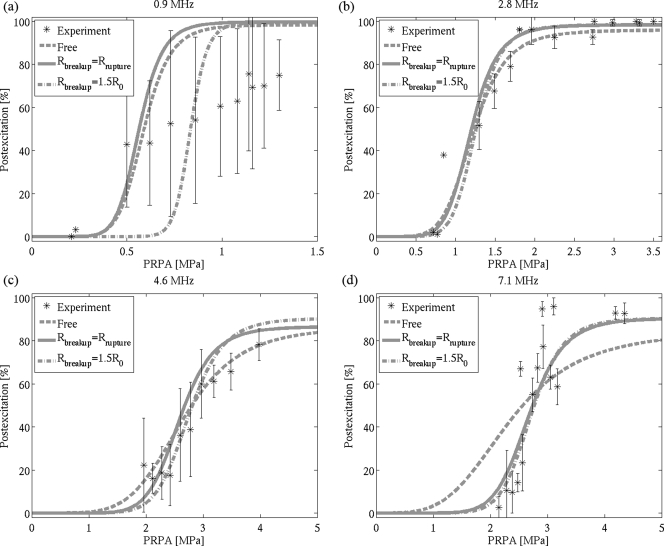
By weighting the threshold results (as shown in Fig. 5) with the population distribution (as shown in Fig. 2), the percentage of PES as a function of PRPA is obtained. The curve fitting results using the logistic equation [Eq. 5] for each frequency are presented in Fig. 6, comparing the experimental data and three simulated results: the modified Rayleigh–Plesset (free) equation, the Marmottant equation with Rbreakup = Rrupture, and the Marmottant equation with Rbreakup = 1.5R0. Table TABLE II. lists the 5% and 50% postexcitation thresholds obtained from these curves, as well as the threshold Rmax values for each model giving an optimal fit for the simulated data. The threshold Rmax was typically larger for those bubbles modeled as free rather than shelled.
Figure 6.
Simulated percentage postexcitation curves for Definity using a free bubble model and the Marmottant model at (a) 0.9 MHz, (b) 2.8 MHz, (c) 4.6 MHz, and (d) 7.1 MHz. Experimental data points (mean ± standard deviation) are represented as asterisks (*).
Table 2.
Experimental percentage postexcitation thresholds (with 95% confidence intervals) in MPa PRPA, proportional to the maximum observed in the pressure range at each frequency, compared with simulated thresholds given by the specified Rmax.
| Simulation | |||||
|---|---|---|---|---|---|
| Frequency | Experimental | Free | Rbreakup = Rrupture | Rbreakup = 1.5R0 | |
| 0.9 MHz | 5% | 0.19 (0.12–0.26) | 0.42 | 0.41 | 0.72 |
| 50% | 0.54 (0.46–0.60) | 0.59 | 0.57 | 0.84 | |
| Threshold Rmax | 9.8 | 8.0 | 8.0 | ||
| 2.8 MHz | 5% | 0.68 (0.62–0.74) | 0.75 | 0.79 | 0.88 |
| 50% | 1.22 (1.17–1.28) | 1.22 | 1.20 | 1.26 | |
| Threshold Rmax | 5.9 | 5.0 | 5.0 | ||
| 4.6 MHz | 5% | 1.63 (1.45–1.77) | 1.53 | 1.85 | 1.99 |
| 50% | 2.65 (2.57–2.74) | 2.65 | 2.59 | 2.75 | |
| Threshold Rmax | 5.7 | 5.2 | 5.2 | ||
| 7.1 MHz | 5% | 2.10 (2.03–2.16) | 1.07 | 1.91 | 2.01 |
| 50% | 2.67 (2.64–2.70) | 2.33 | 2.68 | 2.71 | |
| Threshold Rmax | 3.4 | 3.4 | 3.4 | ||
At 2.8 and 4.6 MHz, all three curves fit the experimental results well. Both Marmottant curves also fit the data well at 7.1 MHz; however, the slope of the fit using the Rayleigh–Plesset model is insufficiently steep compared to the experimental data. At 0.9 MHz, none of the curves appear to fit the experiment across the full range of PRPAs; all predict higher percentages of PES and a steeper slope than were observed experimentally. The large standard deviations for the 0.9 MHz experimental data compared to other frequencies suggest there may be only limited value in trying to interpret fitted simulation results to these data.
DISCUSSION
In this work, the primary factors which affect the modeled response of a single UCA are considered known a priori from experiments: the PRPA from calibrated hydrophone measurements at the PCD transducers’ confocal region, the bubble size distribution measured from images, and the bubble material properties from measurements documented in the literature, including shell properties extracted from low pressure attenuation experiments which assume linear behavior. Therefore, the only available fitting parameters come from the simulated bubble responses themselves; using a threshold maximum expansion ratio from the initial radius in this work was chosen based on its usefulness in previous studies on free bubble cavitation.
Both the free bubble model and the Marmottant model fit the experimental data quite well at 2.8 and 4.6 MHz, suggesting that lipid-shelled UCAs do indeed respond as free bubbles for large oscillations. Furthermore, where the threshold Rmax was smaller at 7.1 MHz, the Marmottant model significantly outperforms the free bubble model. This result may indicate that it is necessary to consider the impact of a lipid shell even beyond the inertial cavitation threshold, despite the fact that it only impacts a small portion of the overall oscillatory cycle.
The simulations indicate that the microbubble size distribution will have a considerable effect on postexcitation curves. For example, a shift in the mean microbubble radius will affect the slope of the PES curve as can be ascertained from the maximum radial expansion images in Fig. 5. The presence of many UCAs far from the resonant size may limit the maximum observable percentage of postexcitation, particularly at higher insonifying frequencies since the largest microbubbles may not grow to sufficient size to collapse with postexcitation.
The quality of the obtained fits between simulation and experiment at the three higher frequencies gives confidence that a simple model can predict the occurrence of UCA postexcitation activity. Nevertheless, the variation of this threshold with frequency deserves further investigation. All fitted postexcitation curves give a threshold Rmax above the inertial cavitation threshold, noted in the Introduction to be a prerequisite for postexcitation emissions. However, the threshold at 7.1 MHz is 3.4R0, while the threshold at 0.9 MHz is 8.0R0, a significant discrepancy.
Two explanations seem plausible. The first is that the observed frequency variability for a threshold growth leading to collapse with postexcitation emission is a real dependency based on the underlying physics of shelled bubble collapse. In other words, the bubble may grow to a larger size at lower frequencies than at higher frequencies before its inertial collapse with postexcitation activity.
However, another possible explanation may be that the ratio of receiving center frequency to insonifying frequency plays an appreciable role in the experimental results. As mentioned earlier, the definition of the PES criterion involves two components: a principal harmonic response, followed by a secondary broadband response. If the receiving center frequency is considerably higher than the insonifying frequency, as was the case for the lowest frequency in the described double PCD experiment, the sensitivity to the initial response will be low unless significant higher harmonic content is present. In the experiment, a microbubble insonified at a lower frequency such as 0.9 MHz is significantly further from the receive transducers’ center frequencies at 15 MHz than one insonified at 7.1 MHz. The microbubble insonified at the lower frequency must therefore grow to greater initial amplitude of oscillation before being identified as collapsing with PES, because it will not be classified until both the initial harmonic and secondary broadband responses are observed. Further investigation will be necessary to ascertain the significance, if any, of the dependency of postexcitation curves on the separation between receiving and insonifying frequencies.
CONCLUSIONS
Good agreement between experimental measurements of microbubble postexcitation collapse and the simulated curves using the Marmottant equation may be obtained using the criterion of maximum radial expansion to indicate the onset of postexcitation collapse. However, the relationship between the threshold Rmax and experimental PES is found to vary depending on insonifying frequency, which either may have basis in the underlying bubble dynamics or may imply that experimental measurement conditions have a noticeable impact on the level of cavitation activity at which postexcitation emissions are observed.
The Marmottant model is shown to provide effective predictions for large amplitude oscillations due to its assumption that UCAs with lipid shells rupture and behave as free bubbles under large expansion. Additionally, while the free bubble model was limited in only being able to closely match experimental data assuming expansions greater than five times the initial radius, the Marmottant model showed no such restrictions down to 3.4 times the initial radius.
ACKNOWLEDGMENTS
The authors would like to acknowledge classification efforts of the experimental data by Michael Malloy and Alayna Roberts. This research was supported by NIH under Grant No. R37EB002641.
References
- de Jong N., Emmer M., van Wamel A., and Versluis M., “Ultrasonic characterization of ultrasound contrast agents,” Med. Biol. Eng. Comput. 47, 861–873 (2009). 10.1007/s11517-009-0497-1 [DOI] [PMC free article] [PubMed] [Google Scholar]
- Goldberg B. B., Raichlen J. S., and Forsberg F., Ultrasound Contrast Agents: Basic Principles and Clinical Applications, 2nd ed. (Martin Dunitz, London, 2001), pp. 1–440. [Google Scholar]
- Birnbaum Y., Luo H., Nagai T., Fishbein M. C., Peterson T. M., Li S., Kricsfeld D., Porter T. R., and Siegel R. J., “Noninvasive in vivo clot dissolution without a thrombolytic drug: Recanalization of thrombosed iliofemoral arteries by transcutaneous ultrasound combined with intravenous infusion of microbubbles,” Circulation 97, 130–134 (1998). [DOI] [PubMed] [Google Scholar]
- Datta S., Coussios C. C., Ammi A. Y., Mast T. D., de Courten-Myers G. M., and Holland C. K., “Ultrasound enhanced thrombolysis using definity as a cavitation nucleation agent,” Ultrasound Med. Biol. 34, 1421–1433 (2008). 10.1016/j.ultrasmedbio.2008.01.016 [DOI] [PMC free article] [PubMed] [Google Scholar]
- McDannold N., Vykhodtseva N., and Hynynen K., “Targeted disruption of the blood–brain barrier with focused ultrasound: Association with cavitation activity,” Phys. Med. Biol. 51, 793–807 (2006). 10.1088/0031-9155/51/4/003 [DOI] [PubMed] [Google Scholar]
- Choi J. J., Pernot M., Brown T. R., Small S. A., and Konofagou E. E., “Spatio-temporal analysis of molecular delivery through the blood brain barrier using focused ultrasound,” Phys. Med. Biol. 52, 5509–5530 (2007). 10.1088/0031-9155/52/18/004 [DOI] [PubMed] [Google Scholar]
- McDannold N., Vykhodtseva N., and Hynynen K., “Blood brain barrier disruption induced by focused ultrasound and circulating preformed microbubbles appears to be characterized by the mechanical index,” Ultrasound Med. Biol. 34, 834–840 (2008). 10.1016/j.ultrasmedbio.2007.10.016 [DOI] [PMC free article] [PubMed] [Google Scholar]
- Ward M., Wu J., and Chiu J. F., “Ultrasound-induced cell lysis and sonoporation enhanced by contrast agents,” J. Acoust. Soc. Am. 105, 2951–2957 (1999). 10.1121/1.426908 [DOI] [PubMed] [Google Scholar]
- van Wamel A., Kooiman K., Harteveld M., Emmer M., ten Cate F. J., Versluis M., and de Jong N., “Vibrating microbubbles poking individual cells: Drug transfer into cells via sonoporation,” J. Controlled Release 112, 149–155 (2006). 10.1016/j.jconrel.2006.02.007 [DOI] [PubMed] [Google Scholar]
- Forbes M. M., Steinberg R. L., and W. D.O’Brien, Jr. , “Examination of inertial cavitation of Optison in producing sonoporation of Chinese hamster ovary cells,” Ultrasound Med. Biol. 34, 2009–2018 (2008). 10.1016/j.ultrasmedbio.2008.05.003 [DOI] [PMC free article] [PubMed] [Google Scholar]
- de Jong N., Hoff L., Skotland T., and Born N., “Absorption and scatter of encapsulated gas filled microspheres: Theoretical considerations and some measurements,” Ultrasonics 32, 95–103 (1992). 10.1016/0041-624X(92)90041-J [DOI] [PubMed] [Google Scholar]
- Emmer M., Van Wamel A., Goertz D. E., and de Jong N., “The onset of microbubble vibration,” Ultrasound Med. Biol. 33, 941–949 (2007). 10.1016/j.ultrasmedbio.2006.11.004 [DOI] [PubMed] [Google Scholar]
- de Jong N., Emmer M., Chin C. T., Bouakaz A., Mastik F., Lohse D., and Versluis M., “‘Compression-only’ behavior of phospholipid-coated contrast bubbles,” Ultrasound Med. Biol. 33, 653–656 (2007). 10.1016/j.ultrasmedbio.2006.09.016 [DOI] [PubMed] [Google Scholar]
- Dollet B., van der Meer S. M., Garbin V., de Jong N., Lohse D., and Versluis M., “Nonspherical oscillations of ultrasound contrast agent microbubbles,” Ultrasound Med. Biol. 34, 1465–1473 (2008). 10.1016/j.ultrasmedbio.2008.01.020 [DOI] [PubMed] [Google Scholar]
- Lauterborn W., “Numerical investigation of nonlinear oscillations of gas bubbles in liquids,” J. Acoust. Soc. Am. 59, 283–293 (1976). 10.1121/1.380884 [DOI] [Google Scholar]
- Gilmore F. R., “The growth or collapse of a spherical bubble in a viscous compressible fluid,” Cal. Tech. Inst. Rep. 26–4, pp. 1–40 (1952). [Google Scholar]
- Flynn H. G., “Cavitation dynamics. I. A mathematical formulation,” J. Acoust. Soc. Am. 57, 1379–1396 (1975). 10.1121/1.380624 [DOI] [Google Scholar]
- Vokurka K., “Comparison of Rayleigh’s, Herring’s, and Gilmore’s models of gas bubbles,” Acustica 59, 214–219 (1986). [Google Scholar]
- Prosperetti A. and Lezzi A., “Bubble dynamics in a compressible liquid. Part 1. First-order theory,” J. Fluid Mech. 168, 457–478 (1986). 10.1017/S0022112086000460 [DOI] [Google Scholar]
- Hilgenfeldt S., Brenner M. P., Grossmann S., and Lohse D., “Analysis of Rayleigh–Plesset dynamics for sonoluminescing bubbles,” J. Fluid Mech. 365, 171–204 (1998). 10.1017/S0022112098001207 [DOI] [Google Scholar]
- Löfstedt R., Barber B. P., and Putterman S. J., “Toward a hydrodynamic theory of sonoluminescence,” Phys. Fluids A 5, 2911–2928 (1993). 10.1063/1.858700 [DOI] [Google Scholar]
- de Jong N., Cornet R., and Lancée C. T., “Higher harmonics of vibrating gas-filled microspheres. Part one: Simulations,” Ultrasonics 32, 447–453 (1994). 10.1016/0041-624X(94)90064-7 [DOI] [Google Scholar]
- Church C. C., “The effects of an elastic solid-surface layer on the radial pulsations of gas-bubbles,” J. Acoust. Soc. Am. 97, 1510–1521 (1995). 10.1121/1.412091 [DOI] [Google Scholar]
- Hoff L., Sontum P. C., and Hovem J. M., “Oscillations of polymeric microbubbles: Effect of the encapsulating shell,” J. Acoust. Soc. Am. 107, 2272–2280 (2000). 10.1121/1.428557 [DOI] [PubMed] [Google Scholar]
- Chatterjee D. and Sarkar K., “A Newtonian rheological model for the interface of microbubble contrast agents,” Ultrasound Med. Biol. 29, 1749–1757 (2003). 10.1016/S0301-5629(03)01051-2 [DOI] [PubMed] [Google Scholar]
- Doinikov A. A. and Dayton P. A., “Maxwell rheological model for lipid-shelled ultrasound microbubble contrast agents,” J. Acoust. Soc. Am. 121, 3331–3340 (2007). 10.1121/1.2722233 [DOI] [PMC free article] [PubMed] [Google Scholar]
- Doinikov A. A., Haac J. F., and Dayton P. A., “Modeling of nonlinear viscous stress in encapsulating shells of lipid-coated contrast agent microbubbles,” Ultrasonics 49, 269–275 (2009). 10.1016/j.ultras.2008.09.007 [DOI] [PMC free article] [PubMed] [Google Scholar]
- Tsiglifis K. and Pelekasis N. A., “Nonlinear radial oscillations of encapsulated microbubbles subject to ultrasound: The effect of membrane constitutive law,” J. Acoust. Soc. Am. 123, 4059–4070 (2008). 10.1121/1.2909553 [DOI] [PubMed] [Google Scholar]
- Paul S., Katiyar A., Sarkar K., Chatterjee D., Shi W. T., and Forsberg F., “Material characterization of the encapsulation of an ultrasound contrast microbubble and its subharmonic response: Strain-softening interfacial elasticity model,” J. Acoust. Soc. Am. 127, 3846–3857 (2010). 10.1121/1.3418685 [DOI] [PMC free article] [PubMed] [Google Scholar]
- Marmottant P., van der Meer S., Emmer M., Versluis M., N. de Jong, Hilgenfeldt S., and Lohse D., “A model for large amplitude oscillations of coated bubbles accounting for buckling and rupture,” J. Acoust. Soc. Am. 118, 3499–3505 (2005). 10.1121/1.2109427 [DOI] [Google Scholar]
- Ammi A. Y., Cleveland R. O., Mamou J., Wang G. I., Bridal S. L., and W. D.O’Brien, Jr. , “Ultrasonic contrast agent shell rupture detected by inertial cavitation and rebound signals,” IEEE Trans. Ultrason. Ferroelectr. Freq. Control 53, 126–136 (2006). 10.1109/TUFFC.2006.1588398 [DOI] [PMC free article] [PubMed] [Google Scholar]
- Haak A. and W. D.O’Brien, Jr. , “Detection of microbubble ultrasound contrast agent destruction applied to Definity®,” in Proceedings of the International Congress on Ultrasound, Paper No. 1710 (2007), pp. 1–4.
- King D. A., Malloy M. J., Roberts A. C., Haak A., Yoder C. C., and W. D.O’Brien, Jr. , “Determination of postexcitation thresholds for single ultrasound contrast agent microbubbles using double passive cavitation detection,” J. Acoust. Soc. Am. 127, 3449–3455 (2010). 10.1121/1.3373405 [DOI] [PMC free article] [PubMed] [Google Scholar]
- Cleveland R. O., Sapozhnikov O. A., Bailey M. R., and Crum L. A., “A dual passive cavitation detector for localized detection of lithotripsy-induced cavitation in vitro,” J. Acoust. Soc. Am. 107, 1745–1758 (2000). 10.1121/1.428572 [DOI] [PubMed] [Google Scholar]
- Coleman A. J., Choi M. J., Saunders J. E., and Leighton T. G.. “Acoustic emission and sonoluminescence due to cavitation at the beam focus of an electrohydraulic shock wave lithotripter,” Ultrasound Med. Biol. 18, 267–281 (1992). 10.1016/0301-5629(92)90096-S [DOI] [PubMed] [Google Scholar]
- Santin M., King D. A., Foiret J., Haak A., W. D.O’Brien, Jr. , and Bridal S. L., “Encapsulated contrast microbubble radial oscillation associated with postexcitation pressure peaks,” J. Acoust. Soc. Am. 127, 1156–1164 (2010). 10.1121/1.3277216 [DOI] [PMC free article] [PubMed] [Google Scholar]
- Leighton T. G., The Acoustic Bubble (Academic Press, London, 1997), pp. 312–335 . [Google Scholar]
- Goertz D. E., de Jong N., and van der Steen A. F. W., “Attenuation and size distribution measurements of DefinityTM and manipulated DefinityTM populations,” Ultrasound Med. Biol. 33, 1376–1388 (2007). 10.1016/j.ultrasmedbio.2007.03.009 [DOI] [PubMed] [Google Scholar]
- Lide D. R., ed., “Van der Waals constants for gases,” in CRC Handbook of Chemistry and Physics, 90th ed. (CRC Press, Boca Raton, 2009), pp. 6–33. [Google Scholar]
- Kimmel E., Krasovitski B., Hoogi A., Razansky D., and Adam D., “Subharmonic response of encapsulated microbubbles: Conditions for existence and amplification,” Ultrasound Med. Biol. 33, 1767–1776 (2007). 10.1016/j.ultrasmedbio.2007.05.011 [DOI] [PubMed] [Google Scholar]
- Kwan J. J. and Borden M. A., “Microbubble dissolution in a multigas environment,” Langmuir 26, 6542–6548 (2009). 10.1021/la904088p [DOI] [PubMed] [Google Scholar]
- Lee Y. -S., “Numerical solution of the KZK equation for pulsed finite amplitude sound beams in thermoviscous fluids,” Ph. D. dissertation, The University of Texas at Austin, pp. 1–195 (1993). [Google Scholar]
- Lee Y. S. and Hamilton M. F., “Time-domain modeling of pulsed finite amplitude sound beams,” J. Acoust. Soc. Am. 97, 906–917 (1995). 10.1121/1.412135 [DOI] [Google Scholar]
- Cleveland R. O., Hamilton M. F., and Blackstock D. T., “Time-domain modeling of finite-amplitude sound in relaxing fluids,” J. Acoust. Soc. Am. 99, 3312–3318 (1996). 10.1121/1.414983 [DOI] [Google Scholar]
- Averkiou M. A. and Hamilton M. F., “Nonlinear distortion of short pulses radiated by plane and focused circular pistons,” J. Acoust. Soc. Am. 102, 2539–2548 (1997). 10.1121/1.420308 [DOI] [PubMed] [Google Scholar]
- Doinikov A. A., Haac J. F., and Dayton P. A., “Resonance frequencies of lipid-shelled microbubbles in the regime of nonlinear oscillations,” Ultrasonics 49, 263–268 (2009). 10.1016/j.ultras.2008.09.006 [DOI] [PMC free article] [PubMed] [Google Scholar]


