Abstract
Neurodevelopmental disorders, such as schizophrenia and autism, have been associated with disturbances of the GABAergic system in the brain. We examined immediate and long-lasting influences of exposure to the GABA-potentiating drug vigabatrin (GVG) on the GABAergic system in the hippocampus and cerebral cortex, before and during the developmental switch in GABA function (postnatal days P1–7 and P4–14). GVG induced a transient elevation of GABA levels. A feedback response to GABA enhancement was evident by a short-term decrease in glutamate decarboxylase (GAD) 65 and 67 levels. However, the number of GAD65/67-immunoreactive (IR) cells was greater in 2-week-old GVG-treated mice. A long-term increase in GAD65 and GAD67 levels was dependent on brain region and treatment period. Vesicular GABA transporter was insensitive to GVG. The overall effect of GVG on the Cl− co-transporters NKCC1 and KCC2 was an enhancement of their synthesis, which was dependent on the treatment period and brain region studied. In addition, a short-term increase was followed by a long-term decrease in KCC2 oligomerization in the cell membrane of P4–14 hippocampi and cerebral cortices. Analysis of the Ca2+ binding proteins expressed in subpopulations of GABAergic cells, parvalbumin and calbindin, showed region-specific effects of GVG during P4–14 on parvalbumin-IR cell density. Moreover, calbindin levels were elevated in GVG mice compared to controls during this period. Cumulatively, these results suggest a particular susceptibility of the hippocampus to GVG when exposed during days P4–14. In conclusion, our studies have identified modifications of key components in the inhibitory system during a critical developmental period. These findings provide novel insights into the deleterious consequences observed in children following prenatal and neonatal exposure to GABA-potentiating drugs.
Keywords: hippocampus, glutamate decarboxylase, NKCC1, KCC2, calbindin, parvalbumin
INTRODUCTION
Disturbance of the GABAergic system in the brain is associated with neurological disorders, including neurodevelopmental disorders such as schizophrenia and autism (Levitt et al, 2004; Lewis et al, 2005). In the developing brain of the rodent, neurogenesis is mainly a prenatal event, followed by cell migration that extends to neonatal periods, thereafter synaptogenesis and network refinement occur. During development of the hippocampus and cerebral cortex, GABAergic synapses develop before glutamatergic synapses (Di Cristo, 2007; Gozlan and Ben-Ari, 2003), thereafter GABAergic and glutamatergic synaptogeneses take place in parallel. The expression pattern of GABAergic interneuron subpopulations varies between calcium binding protein-immunoreactive (IR) interneurons. Calbindin-IR (CB-IR) neurons are apparent from embryonic stages, whereas parvalbumin-IR (PV-IR) cells begin to be expressed during the first postnatal week, in the hippocampus as well as the neocortex (Danglot et al, 2006; Hof et al, 1999).
During late pregnancy and early postnatal life in both humans and rodents, various GABAergic components undergo significant changes (Conti et al, 2004; Herlenius and Lagercrantz, 2004). In rodents, the expression of the GABA-synthesizing enzyme—glutamate decarboxylase (GAD)—changes from embryonic truncated forms (GAD25 and GAD45) to the postnatal GAD65 and GAD67 isoforms; the profile of GABAA and GABAB receptor subunits expression is also regulated during this developmental period (Ma and Barker, 1998). GAD65 and GAD67 differ in their subcellular localization and function in the brain (Soghomonian and Martin, 1998). A higher sensitivity of GAD67 protein levels to changes in GABA expression was shown by a robust decrease in GAD67 but not GAD65 protein levels in response to increasing levels of GABA (Rimvall and Martin, 1992, 1994; Rimvall et al, 1993).
In the mature brain, the GABAergic synaptic potentials mediated by GABAA receptors generate an inhibitory synaptic response. However, under various conditions GABA facilitates neuronal depolarization, including human epileptogenesis (Cohen et al, 2002), after neuronal injury (van den Pol et al, 1996) and during normal early brain development (Ben-Ari et al, 1989; Khazipov et al, 2001; Owens et al, 1996). In the immature brain, activation of GABAA depolarizes the neuron membrane, and within the first and second postnatal weeks of life in mice ECl− shifts toward a hyperpolarizing potential thereby leading to inhibitory GABA-mediated responses. Modulation of GABA-mediated transmission is accompanied by alterations in intracellular chloride concentration. Cl− homeostasis in CNS neurons is mainly regulated by the balance between the Cl− accumulating Na+-K+-2Cl− co-transporter NKCC1 and the Cl− extruding K+-Cl− co-transporter KCC2. An essential role in the functional GABA shift has been shown for NKCC1 (Dzhala et al, 2005; Sipilä et al, 2006; Yamada et al, 2004) and KCC2 (Hübner et al, 2001; Rivera et al, 1999), which are developmentally downregulated and upregulated, respectively. The temporal expression of KCC2 is regulated by a number of factors, including neuronal activity, GABA level, and brain-derived neurotrophic factor (Aguado et al, 2003; Fiumelli and Woodin, 2007; Ganguly et al, 2001). Moreover, the activity of NKCC1 and KCC2 has been shown to be regulated by various mechanisms, including phosphorylation, cell volume, and oligomerization of KCC2 (Blaesse et al, 2009; Payne et al, 2003).
All the above suggest that modifications in the GABA pathway during neurogenesis and synaptogenesis may perturb neuronal circuits in the brain and, consequently, behavior (Levav et al, 2004, 2008). However few studies have sought to examine the potential consequences of perturbations in this critical signaling circuitry during the neonatal period. In this study we hypothesized that neonatal vigabatrin (GVG) application induces immediate and delayed alterations in the GABAergic pathway. Sensitivity to GABA potentiation was examined in hippocampal and cortical tissues of newborn and mature mice during two exposure periods; postnatal days (P) 1–7 and P4–14, before and during the switch in GABA function from depolarizing to hyperpolarizing synaptic response. These treatment periods partially overlap so that in both groups GABA levels were enhanced at the time when KCC2 expression begins (P4–7). Whereas one treatment period includes also the time before KCC2 expression, the other treatment period covers the entire period in which KCC2 undergoes upregulation. Initially we measured the levels of the main inhibitory and excitatory neurotransmitters, GABA and glutamate. Thereafter, we quantified proteins critical for GABAergic synaptic function and transmission—GAD65, GAD67, the vesicular GABA transporter (VGAT), KCC2, and NKCC1. Finally, we tested the possibility that GVG modifies the density and size of inhibitory neurons in the hippocampus: GAD-IR neurons and subpopulations of inhibitory GABAergic interneurons, immunoreactivity to the Ca2+ binding proteins CB and PV.
MATERIALS AND METHODS
Study Design
On the day of delivery, the size of each litter was reduced to eight pups. A within-litter design was used: offspring to Balb/C mice were marked daily with a nontoxic dye and randomly assigned to treatment and control groups (four newborns per group in each litter). GVG (Sigma-Aldrich, St Louis, MO), 50 mg/kg, in a volume of 50 μl, was injected subcutaneously to newborns of the GVG group during the light cycle of postnatal days (P) 1–7 or P4–14 (GVG1–7 or GVG4–14). The control group was treated with the same volume of vehicle according to the same schedule (Ct1–7 or Ct4–14). GVG dose was selected based on previous studies indicating behavioral outcomes of the treatment (Levav et al, 2004). All groups were matched for sex, to ensure similar proportions of male and female mice in each group.
To monitor the treatment effect on newborns, we observed offspring behavior and maternal care during the neonatal period and no differences between the groups were detected (data not shown). Because differential effects on body weight in both treatment groups were previously observed after weaning (Levav et al, 2004), daily food intake was monitored and was found to be similar between GVG and Ct groups (data not shown).
The mouse colony was maintained in a 12 : 12 h light/dark cycle, and food and water were provided ad libitum. All procedures were performed according to guidelines of the Israeli Council for Animal Care and approved by the animal care and use committee of Ben-Gurion University of the Negev.
Tissue Preparation
Mice were killed at the ages of 1, 2, and 16 weeks (for the P1–7 treated group) or 2, 3, and 16 weeks (for the P4–14 treated group). For the study of short-term effects, brains were sampled 5 h after the last administration (1-week-old mice treated during P1–7 or 2-week-old mice treated during P4–14).
Mice were anesthetized by inhalation of 30% isoflurane (Minrad, NY, USA) diluted in isopropanol (Fluka Chemie, Buchs, the Netherlands). Brains were rapidly removed into ice-cold saline solution. The hippocampus and cerebral cortex were separated and stored at −80°C for either subcellular fractionation and immunoblot analysis or HPLC analysis.
Alternatively, mice were anesthetized by sequential administration of 30 and 10% isoflurane diluted in isopropanol, and transcardially perfused with 4% paraformaldehyde. Brains were removed, paraffin-embedded, and stored at 4°C for immunohistochemistry (IHC).
HPLC Sample Analysis
Sample analysis was carried out by HPLC coupled to fluorescence detection as described previously (Clarke et al, 2007). Briefly, samples were sonicated for 4 s (Sonoplus; Bandelin) in chilled homogenization buffer (0.1 M citric acid, 0.1 M sodium dihydrogen phosphate monohydrate, 5.6 mM octane sulfonic acid, 10 μM EDTA in 10% (v/v) methanol solution (pH 2.8) with 4 M NaOH). After centrifugation at 14 000 r.p.m. (Mikro 22R; Hettich, Germany), the supernatant was removed for derivatization.
We added 100 μl of sample supernatant, 900 μl of borate buffer (0.1 M, pH 9.5), 200 μl of potassium cyanide (10 mM) and 200 μl of Naphthalene-2,3-dicarboxaldehyde (NDA; 6 mM) to a single reaction tube, vortex mixed, and the reaction was allowed to proceed at ambient temperatures in the absence of light. A 20 μl aliquot of the derivative was injected onto the HPLC system.
The HPLC system consisted of a Waters 510 pump, 717plus Autosampler, a Hewlett Packard 1046A fluorescent detector, a waters bus SAT/IN module, and a Croco-Cil column oven. System components were used in conjunction with Waters Empower software. All samples were injected onto a reversed phase Luna 3 μm C18(2) 150 mm × 2 mm column (Phenomenex), which was protected by KrudKatcher disposable precolumn filters and SecurityGuard cartridges (Phenomenex).
The mobile phase used on the system was composed of a mixture of 0.1 M di-sodium hydrogen orthophosphate/50 μM EDTA (pH 5.3, 1 M orthophosphoric acid) and HPLC-grade methanol (35 : 65). Mobile phase was filtered and vacuum was degassed before use. Compounds were eluted isocratically over a 20 min runtime at a flow rate of 0.1 ml/min. The fluorescent detector was set at an excitation wavelength of 420 nm, an emission wavelength of 480 nm, and a PMT gain of 5.
GABA and glutamate were identified by their characteristic retention times as determined by standard injections run at regular intervals during sample analysis. Sample peak heights were measured and compared with standard injections to quantify amino acids.
Subcellular Fractionation
Subcellular fractionation was performed as described by Huttner et al (1983) and Berton et al (2000). Hippocampi were homogenized in the presence of protease inhibitors (Sigma-Aldrich) with a hand grinder (15 strokes) in 0.3 ml homogenization buffer (0.32 M sucrose, 5 mM Tris-base, pH 7.4). Homogenates (H) were centrifuged for 10 min at 800 g. The resulting supernatant (S1) was collected and centrifuged for 15 min at 9200 g, and the supernatant obtained (S2) was used as the crude cytoplasmic fraction. The pellet (P2) was suspended in 25 μl homogenization buffer and centrifuged for 15 min at 10 200 g to yield a supernatant (S2′) and the crude synaptosomal fraction (P2′). A dilution of P2′ (1 : 9) in ice-cold water was subjected to several strokes, and 1 M Tris-base (pH 7.4) was added to the resulting P2′ lysate (L), which was kept on ice for 30 min. The lysate was centrifuged for 30 min at 25 000 g to yield a plasma-membrane-enriched fraction (LP1). The samples were kept at 4°C during the entire fractionation process.
Immunoblot Analysis
Proteins were separated by 6 and 7.5% sodium dodecyl sulfate–polyacrylamide gel electrophoresis, under reducing or nonreducing conditions. Membranes were probed with the following primary antibodies: anti-GAD65/67 (1 : 20 000; Chemicon International, Temecula, CA, USA), anti-VGAT (1 : 2500; Synaptic Systems, Gottingen, Germany), anti-KCC2 (1 : 1000; Sigma-Aldrich), anti-CB (1 : 2500; Chemicon International), anti-β-actin (1 : 10 000; Sigma-Aldrich), and monoclonal anti-NKCC1 (T4; 1 : 2500; developed by Christian Lytle, obtained from the Developmental Studies Hybridoma Bank developed under the auspices of the NICHD and maintained by the Department of Biological Sciences, University of Iowa, Iowa City, IA). Anti-mouse IgG (1 : 10 000; Chemicon) and anti-rabbit IgG horseradish-peroxidase-conjugate secondary antibody (1 : 5000–1 : 10 000; Upstate, Lake Placid, NY, USA) were used for detection. Visualization was obtained with an enhanced chemiluminescence (ECL) system. Quantification was performed with TINA software (Raytest, Straubenhardt, Germany). The results of each trial were normalized to the trial mean. Four to five independent repeats of each sample were averaged (each repeat included a duplicate of each sample). All immunoblot results represent the crude cytoplasmic fraction (S2), unless otherwise stated.
Immunohistochemistry
Immunohistochemistry was performed as previously described (Gerstein et al, 2005). Briefly, paraffin-embedded 4-μm-thick sagittal sections, taken 0.12–0.24 mm (for cingulate cortex analysis) and 0.84–1.08 mm (for hippocampus, primary sensory cortex, and thalamic reticular nucleus (TRN) analysis) from the midline, were mounted on saline-coated slides. Following deparaffinization and rehydration of the sections, nonspecific staining was blocked with a serum and albumin-containing solution. The following primary antisera were used: anti-GAD65/67 (1 : 1000; Chemicon International), anti-CB D28K (1 : 750; Chemicon International), and anti-PV (1 : 2000; Sigma-Aldrich). Biotinylated secondary antibodies, anti-rabbit and anti-goat, were applied for 1 h at room temperature (Vector Laboratories, Burlingame, CA, USA). Endogenous peroxidase was quenched and avidin–biotin conjugate was applied. Development was performed with 0.06% diaminobenzidine (DAB) with H2O2, with cobalt enhancement (1% CoCl2). For the negative control, normal serum replaced the primary antibodies.
Sections were examined on an Olympus IX-70 microscope at magnifications of × 10 and × 20, sampled with a SuperCam video camera (Applitec, Israel) under constant illumination, and analysis was performed masked to treatment by NIH Image software. Three regions of interest within each brain area examined were measured in 2–5 sections (4 μm thick), separated by at least 20 μm. Thus, the average represents a tissue 100 μm thick.
Cell density and size were analyzed in the hippocampus (cells per cross-section of the hippocampus), primary sensory cortex (S1) (cells per area), thalamic reticular nucleus (cells per area), and the cingulate cortex (cells per area). Cells were identified by NIH Image's ‘automatic outline' tool, followed by a masked observer who confirmed or rejected each cell selected by the software.
The examined subfields in these areas were CA1 stratum oriens (SO), CA1 stratum pyramidale (SP), CA1 stratum radiatum (SR), CA1 stratum lacunosum moleculare (SLM), dentate gyrus (DG), CA1–3 fields of the hippocampus, subiculum (S), layers of the primary sensory cortex (S1, L2–6), TRN, and layers of the cingulate cortex (L2–3, L4, and L5–6).
Statistical Analysis
Statistical analyses were performed using GraphPad Prism 4.0 (GraphPad Software, San Diego, CA, USA) and SPSS 14.0. Univariate analysis of variance (ANOVA) and repeated-measures ANOVA were used to compare treatment and control groups. Two-tailed Student's t-test was used for comparison of continuous variables when a comparison was performed for a single time point between treatment and control groups. Differences with a p-value <0.05 were regarded as significant. Results are presented as mean±SEM.
RESULTS
Influence of Neonatal GVG Exposure on GABA and Glutamate Levels
Vigabatrin is an irreversible GABA-transaminase inhibitor. As expected from its mechanism of action, exposure to GVG induced an elevation of GABA levels in the hippocampus and cerebral cortex.
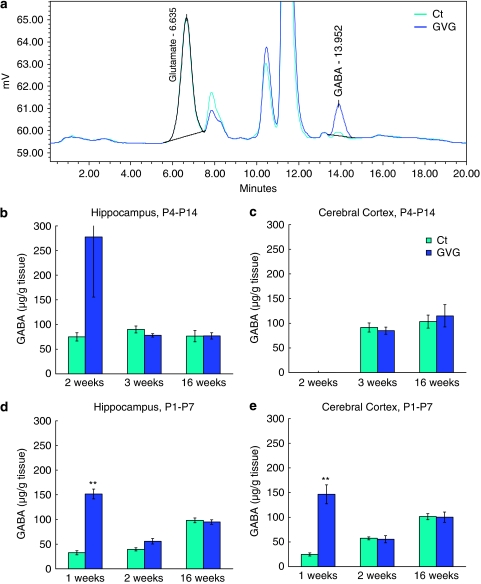
A representative chromatogram of GABA and glutamate levels in the cerebral cortex of 1-week-old mice from the Ct1–7 and GVG1–7 groups is depicted in Figure 1a.
Figure 1.
Transient elevation of GABA levels due to neonatal vigabatrin (GVG) treatment. A representative chromatogram of GABA and glutamate levels in cerebral cortex of 1-week-old mice of Ct1–7 and GVG1–7 groups (a). GABA levels (μg/g tissue) in the hippocampus and cerebral cortex of P4–14 treated mice at 2, 3, and 16 weeks (b, c) and of P1–7 treated mice at 1, 2, and 16 weeks (d, e). n=3–8 at each point for each group; **p<0.01; Student's t-test. Results are presented as mean±SEM.
On the last day of the treatment with GVG, GABA levels increased considerably (though not statistically significant) in GVG4–14 hippocampus of 2-week-old mice (370.1% of Ct4–14, p=0.2, t-test; Figure 1b) and GVG1–7 hippocampus and cerebral cortex of 1-week-old mice (461.1 and 593.7% of Ct1–7, respectively, p<0.001 and <0.01, t-test, Figure 1d and e). GVG effects on GABA levels were transient, as indicated by similar levels of GABA in P4–14 treated mice at 3 and 16 weeks (Figure 1b and c) and P1–7 treated mice at 2 and 16 weeks (Figure 1d and e). Glutamate levels were not influenced by GVG treatment, with the exception of a transient decrease in GVG1–7 cerebral cortex of 1-week-old mice (82.4% of Ct, p<0.05, t-test; Supplementary Table S1).
In summary, effects of GVG treatment on GABA levels were similar in the hippocampus and cerebral cortex. A previous study in adult rats showed a gradual increase of GABA to new steady-state levels after 2–4 days of GVG treatment (Rimvall and Martin, 1994) . Here the exact time course of GABA level decay was not addressed, however, the increased GABA levels returned to control levels a week after the last day of drug administration.
Effects of Neonatal GABA Potentiation on GAD65 and GAD67 Levels
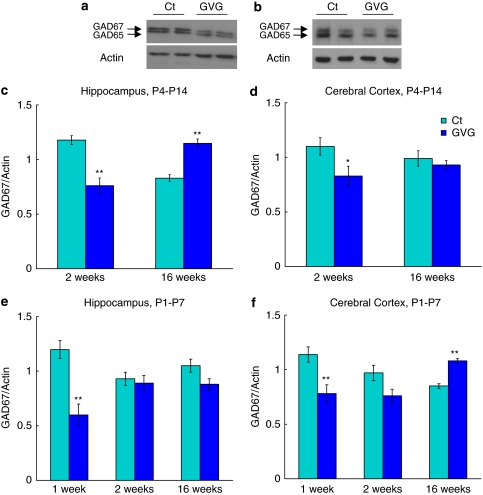
Immunoblot analysis demonstrated negative feedback to GABA enhancement, as represented by a short-term decrease of GABA-synthesizing enzyme GAD67 due to GVG treatment, independent of brain region and treatment period (64.3 and 75.7% of Ct4–14 in 2-week-old hippocampus and cortex, respectively, p<0.01 and <0.05, t-test, Figure 2a, c, and d, and 50.3 and 68.3% of Ct1–7 in 1-week-old hippocampus and cortex, respectively, p<0.01, t-test, Figure 2e and f). An interaction between the effects of treatment and age on GAD67 levels was detected in P4–P14 treated hippocampi and P1–P7 treated cerebral cortex, namely GAD67 levels decreased in young mice and increased in adult mice (p<0.001, F=55.36, and p<0.01 F=9.17, respectively, ANOVA, Figure 2c and f). However, GVG treatment reduced GAD67 expression in GVG4–14 cerebral cortices and GVG1–7 hippocampi (p<0.05, F=4.91, and p<0.01, F=15.34, respectively, ANOVA, Figure 2d and e). Similar alterations were detected in GAD65 levels (see Supplementary Figure S1).
Figure 2.
The effect of vigabatrin (GVG) on GAD67 levels in young and adult mice. Examples of GAD65/67 and actin in homogenates of 2-week-old mice hippocampi (a), and 16-week-old mice cerebral cortices (b) of Ct4–14 and GVG4–14 groups. GAD67 levels normalized to actin at 2 and 16 weeks in P4–14 hippocampus (c) and cerebral cortex (d). GAD67 levels normalized to actin at 1, 2, and 16 weeks in P1–7 hippocampus (e) and cerebral cortex (f). n=4–10 at each point for each group; **p<0.01; *p<0.05. Univariate analysis of variance (ANOVA) and Student's t-test were used for all analyses. Results are presented as mean±SEM. The results of each trial were normalized to the trial mean. Four to five independent repeats of each sample were averaged (each repeat includes a duplicate of each sample).
Taken together, GABA potentiation resulted in an immediate decrease of GAD67 and GAD65 protein levels. Long-term effects on GAD67 and GAD65 were observed in hippocampus of mice treated during P4–14 and cerebral cortex of mice treated during P1–7.
Effects of Neonatal GABA Potentiation on the Vesicular GABA Transporter
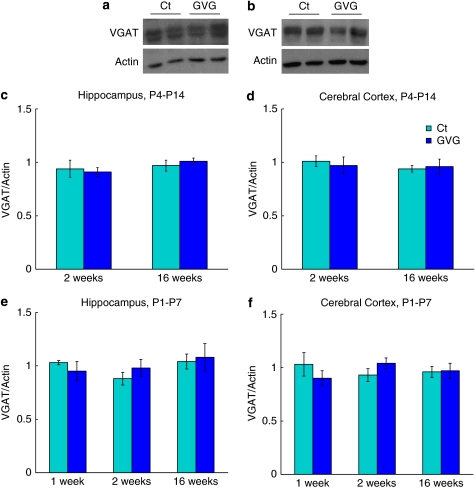
We have previously reported results of an immunohistochemical analysis demonstrating that GVG treatment does not alter VGAT expression in the hippocampus and cerebral cortex of P4–P14 treated mice (Levav et al, 2008). Here, we present a comprehensive immunoblot analysis in which GVG did not influence VGAT protein levels in the hippocampus and cerebral cortex of GVG4–14 treated mice, as well as the hippocampus and cerebral cortex of GVG1–7 treated mice (Figure 3a–f).
Figure 3.
Neonatal vigabatrin (GVG) exposure did not affect the expression of vesicular GABA transporter (VGAT). Examples of VGAT and actin in homogenates of 2-week-old mice hippocampi (a), and 16-week-old mice cerebral cortices (b) of Ct4–14 and GVG4–14 groups. VGAT levels normalized to actin at 2 and 16 weeks in P4–14 hippocampus (c) and cerebral cortex (d). VGAT levels normalized to actin at 1, 2, and 16 weeks in P1–7 hippocampus (e) and cerebral cortex (f). n=4–11 at each point for each group. Univariate analysis of variance (ANOVA) and Student's t-test were used for all analyses. Results are presented as mean±SEM. The results of each trial were normalized to the trial mean. Four to five independent repeats of each sample were averaged (each repeat includes a duplicate of each sample).
Effects of Neonatal GABA Potentiation on K+-Cl− Co-Transporter KCC2
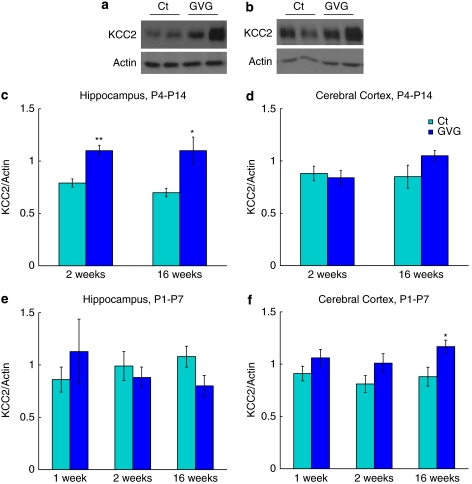
KCC2 expression has been shown to parallel the functional shift in GABA from a depolarizing to a hyperpolarizing neurotransmitter. In addition, KCC2 activation is regulated by a process of oligomerization, which occurs during development (Blaesse et al, 2006). We examined the effect of GVG on the expression and oligomerization pattern of KCC2 by immunoblot analysis as an additional factor influencing the efficacy of the GABAergic inhibition. In the crude cytoplasmic fraction (S2) short- and long-term elevations in KCC2 in the hippocampus occurred due to GVG P4–14 treatment (p<0.001, F=14.29, ANOVA; Figure 4c). Moreover, KCC2 expression at 16 weeks was increased in GVG1–7 cerebral cortices (133.8% of Ct1–7, p<0.05, t-test; Figure 4f). GABA potentiation did not affect KCC2 levels in the cerebral cortex of P4–14 treated mice and in the hippocampus of P1–7 treated mice (Figure 4d and e).
Figure 4.
Modulation of the K+-Cl− co-transporter KCC2. Examples of KCC2 and actin in homogenates of 2-week-old mice hippocampi (a), and 16-week-old mice cerebral cortices (b) of Ct4–14 and GVG4–14 groups. KCC2 levels normalized to actin at 2 and 16-weeks in P4–14 hippocampus (c) and cerebral cortex (d). KCC2 levels normalized to actin at 1, 2, and 16 weeks in P1–7 hippocampus (e) and cerebral cortex (f). n=4–10 at each point for each group; **p<0.01; *p<0.05. Univariate analysis of variance (ANOVA) and Student's t-test were used for all analyses. Results are presented as mean±SEM. The results of each trial were normalized to the trial mean. Four to five independent repeats of each sample were averaged (each repeat includes a duplicate of each sample).
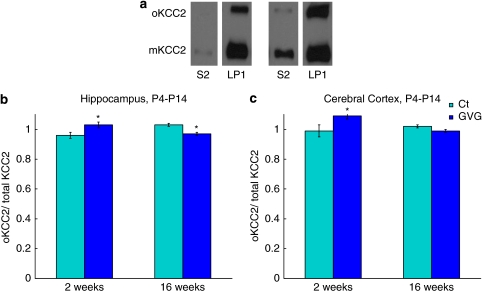
In all P4–14 hippocampal and cerebral cortex tissues tested, the levels of both KCC2 monomer (mKCC2) and oligomer (oKCC2) were significantly greater in the plasma-membrane-enriched fraction, LP1, compared with S2, as depicted in Figure 5a. For example, in the hippocampus, the level of mKCC2 was about eightfold greater in LP1 compared to S2, whereas the levels of oKCC2 were in the range of 20- to 30-fold greater in LP1 compared with S2 (data not shown).
Figure 5.
Effect of neonatal vigabatrin (GVG) treatment on oligomerization of the K+-Cl− co-transporter KCC2. Examples of KCC2 monomer (mKCC2) and KCC2 oligomer (oKCC2) in the crude cytoplasmic fraction, S2, and plasma-membrane-enriched fraction, LP1, in Ct mice (a). Oligomer portion of total KCC2 in LP1 fraction at 2 and 16 weeks in P4–14 hippocampus (b) and cerebral cortex (c). n=7–9; *p<0.05. Univariate analysis of variance (ANOVA) and Student's t-test were used for all analyses. Results are presented as mean±SEM. The results of each trial were normalized to the trial mean. Two to three independent repeats of each sample were averaged (each repeat includes a duplicate of each sample).
Examination of GVG effects on KCC2 oligomerization in fraction LP1 of hippocampi and cerebral cortices of P4–14 treated mice showed an interaction between treatment and age (p<0.01, F=13.48 and p<0.05, F=7.299, respectively, ANOVA; Figure 5b and c). Specifically, at 2 weeks oKCC2/total-KCC2 of GVG4–14 hippocampi had increased, compared with Ct4–14 (1.03±0.02 vs 0.96±0.02, p<0.05, t-test; Figure 5b), favoring higher oligomerization in the plasma membrane of the GVG-treated offspring. However, at 16 weeks, lower levels of oKCC2/total-KCC2 were observed in GVG4–14 hippocampi compared with Ct4–14 (0.97±0.01 vs 1.03±0.01, p<0.05, t-test; Figure 5b). In the cerebral cortex of P4–14 treated mice aged 2 weeks, an increase in oKCC2/total-KCC2 was observed as well, compared with Ct4–14 (1.09±0.02 vs 0.99±0.04, p<0.05, t-test; Figure 5c).
In summary, GVG enhanced the synthesis of KCC2 in a treatment-period and brain-region-dependent manner. In addition, GVG treatment increased oligomerization in the plasma-membrane-enriched fraction in young P4–14 hippocampi and cerebral cortices, and reduced oligomerization in adult P4–14 hippocampi and cerebral cortices.
Effects of Neonatal GABA Potentiation on the Na+-K+-2Cl− Co-Transporter NKCC1
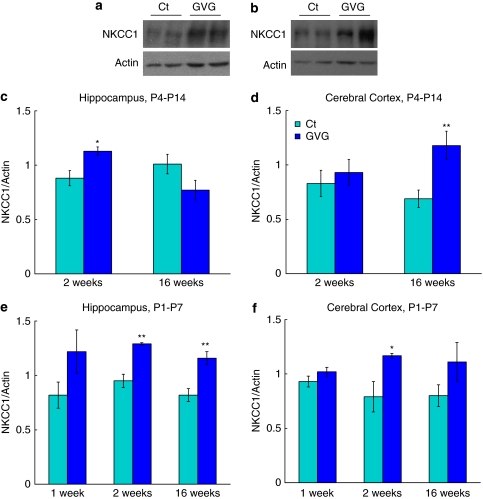
The general influence of neonatal GABA potentiation was an upregulation of NKCC1. In GVG4–14 hippocampi of 2-week-old mice a short-term increase in NKCC1 expression was observed (128.3% of Ct4–14, p<0.05, t-test; Figure 6a and c). Furthermore, an interaction between treatment and age was observed in GVG4–14 hippocampi (p<0.01, F=12.46, ANOVA; Figure 6c). Univariate ANOVA indicated significant enhancement of NKCC1 in GVG4–14 cerebral cortex compared with Ct4–14 (p<0.05, F=7.21, ANOVA; Figure 6d) and in GVG1–7 hippocampi and cerebral cortices, compared to Ct1–7 (p<0.01, F=8.36 and p<0.01, F=9.18, respectively, ANOVA; Figure 6e and f).
Figure 6.
Effect of vigabatrin (GVG) on the Na+-K+-2Cl– co-transporter. Examples of NKCC1 and actin in homogenates of 2-week-old mice hippocampi (a), and 16-week-old mice cerebral cortices (b) of Ct4–14 and GVG4–14 groups. NKCC1 levels normalized to actin at 2 and 16 weeks in P4–14 hippocampus (c) and cerebral cortex (d). NKCC1 levels normalized to actin at 1, 2, and 16 weeks in P1–7 hippocampus (e) and cerebral cortex (f). n=3–9 at each point for each group; **p<0.01; *p<0.05. Univariate analysis of variance (ANOVA) and Student's t-test were used for all analyses. Results are presented as mean±SEM. The results of each trial were normalized to the trial mean. Four to five independent repeats of each sample were averaged (each repeat includes a duplicate of each sample).
Ratio Between KCC2 and NKCC1 in Cytosolic and Plasma Membrane Subcellular Fractions
Because Cl− homeostasis is regulated mainly by two transporters, NKCC1 and KCC2, we examined the ratio of KCC2/NKCC1 in the crude cytoplasmic fraction (S2), and in the plasma-membrane-enriched fraction (LP1).
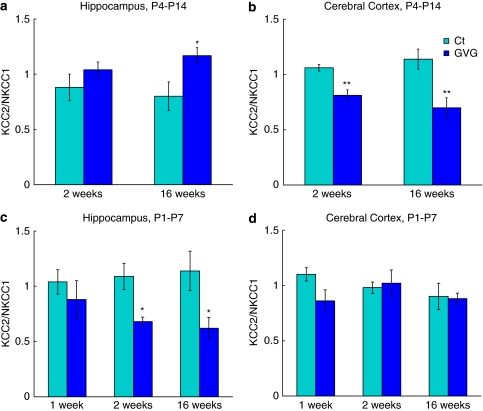
In GVG4–14 hippocampi the KCC2/NKCC1 ratio in fraction S2 had increased (p<0.05, F=6.97, ANOVA; Figure 7a). In contrast, GVG treatment reduced the KCC2/NKCC1 ratio in fraction S2 in GVG4–14 cerebral cortex and GVG1–7 hippocampus (p<0.001, F=21.53 and p<0.05, F=5.31, respectively, ANOVA; Figure 7b and c). GVG treatment during P1–7 did not affect the KCC2/NKCC1 ratio in the cerebral cortex, compared to Ct1–7 (Figure 7d). In the plasma-membrane-enriched fraction (LP1) the KCC2/NKCC1 ratio did not differ between GVG and Ct groups (with the exception of GVG4–14 cerebral cortex at 16 weeks; in which the ratio decreased to 70.2% of Ct4–14, p<0.01, t-test; Supplementary Figure S2).
Figure 7.
The ratio between KCC2 and NKCC1 in the crude cytoplasmic fraction. KCC2/NKCC1 ratio at 2 and 16 weeks in P4–14 hippocampus (a) and cerebral cortex (b), and at 1, 2, and 16 weeks in P1–7 hippocampus (c) and cerebral cortex (d). n=4–9 at each point for each group; **p<0.01; *p<0.05. Univariate analysis of variance (ANOVA) and Student's t-test were used for all analyses. Results are presented as mean±SEM. The results of each trial were normalized to the trial mean. Four to five independent repeats of each sample were averaged (each repeat includes a duplicate of each sample).
To summarize, GVG affected the ratio between KCC2 and NKCC1 in a treatment-period and brain-region-dependent manner, in the crude cytoplasmic fraction, but not in the plasma-membrane-enriched fraction.
A Sensitive Period of the Inhibitory System to Neonatal GABA Enhancement
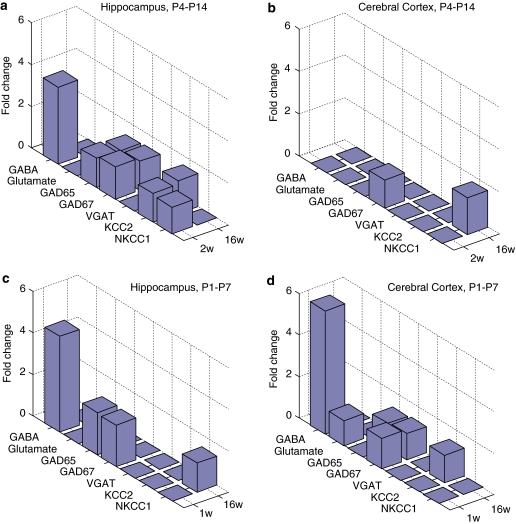
A summary of GVG short- and long-term effects on components of the GABAergic system is depicted as fold-change (absolute value) in Figure 8 for P4–14 hippocampi and cerebral cortices (a, b), and P1–7 hippocampi and cerebral cortices (c, d). Hippocampi of P4–14 treated mice were the most susceptible to GABA enhancement, with eight components that were significantly altered due to neonatal GVG exposure (Figure 8a). The cerebral cortex of P1–7 treated mice was highly influenced as well; though to a lower degree (six components were modified; Figure 8d). Thus, neonatal GABA potentiation has a spatiotemporal effect on the inhibitory system in the brain, in which the cerebral cortex was sensitive in an early period and the hippocampus was sensitive during a later developmental period.
Figure 8.
Summary of vigabatrin (GVG) effects on components of the GABAergic system. Short- and long-term influence of neonatal GVG exposure on components of the inhibitory system represented in fold-change, at 2 and 16weeks in P4–14 hippocampus (a) and cerebral cortex (b), and 1 and 16 weeks in P1–7 hippocampus (c) and cerebral cortex (d).
Influence of Neonatal GABA Potentiation During P4–14 on GABAergic Neuron Population in the Hippocampus
A careful examination of the results presented so far reveals a particular susceptibility of the hippocampus to GVG when exposed during days P4–14 (Figure 8a–d). Therefore, we further focused our study on this group, and on additional brain regions that have common neuronal pathways with the hippocampus. Specifically we examined the effect of GVG treatment during days P4–14 on the number and size of GABAergic neurons.
Effect of GABA Potentiation on GAD65/67 Immunoreactive Cells
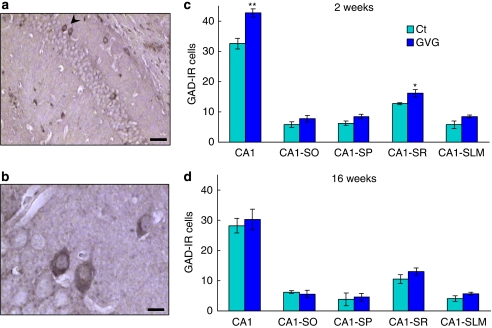
The influence of neonatal GVG exposure on the number of GABAergic cells in young and adult mice hippocampi was studied by analyzing neurons IR to the GABA-synthesizing enzymes GAD65 and 67. An example of GAD-IR cells in the hippocampus is shown in Figure 9a and b. Hippocampal CA1 subfields (SO, SP, SR, and SLM) showed an increase in the number of GAD65/67-IR neurons in GVG-treated mice aged 2 weeks, compared with Ct (p<0.01, F=23.11, repeated-measures ANOVA; Figure 9c). An area-specific statistical analysis showed an increase in GAD65/67-IR cells in the CA1 field of GVG4–14 hippocampi of mice aged 2 weeks, compared with Ct4–14 (42.7±1.4 and 32.5±1.8 cells, respectively; p<0.01, t-test), specifically in the SP and SR cell layers (8.4±0.7 vs 6.2±0.7 cells, p=0.07 and 16.1±1.2 vs 12.7±0.3 cells, p<0.05, respectively, t-test; Figure 9c). The enhancement of GAD65/67-IR cell number was abolished by 16 weeks, ie, in adult mice (p>0.05, repeated-measures ANOVA; Figure 9d). Similar values of GAD65/67-IR cells in GVG and Ct groups were observed in the DG at 2 and 16 weeks (data not shown).
Figure 9.
The effect of vigabatrin (GVG) on GAD65/67-immunoreactive (IR) cell density in the hippocampus. An example of GAD65/67-IR cells (arrowhead) in the CA1 field of adult mice hippocampi (a, b). The number of GAD65/67-IR cells was evaluated in the CA1 field of the hippocampus and in sublayers of CA1 in mice at 2 weeks (c) and at 16 weeks (d). CA1-SO, stratum oriens; CA1-SP, stratum pyramidale; CA1-SR, stratum radiatum; CA1-SLM, stratum lacunosum moleculare. n=3–6 mice, 2–5 sections, at each point for each group; **p<0.01; *p<0.05. Repeated-measures analysis of variance (ANOVA) and Student's t-test were used for all analyses. Results are presented as mean±SEM. Calibration bar represents 50 μm (a) and 10 μm (b).
Effect of GVG on Subpopulations of Inhibitory Neurons
To obtain a detailed understanding of possible modifications in the population of GABAergic cells, we performed further analysis of the expression of Ca2+ binding proteins expressed in subpopulations of GABAergic interneurons.
Region-Specific Alterations in Parvalbumin-IR Cells
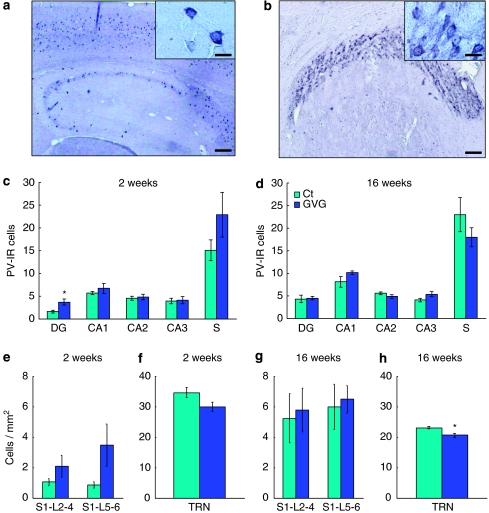
An example of PV-IR cells in the hippocampus, cortex, and the TRN is shown in Figure 10a and b. The number of PV-IR neurons was increased in the DG of GVG4–14 mice at 2 weeks compared to Ct4–14 (3.7±0.62 vs 1.9±0.28 cells, p<0.05, t-test; Figure 10c), but not in other fields of the hippocampus at 2 and 16 weeks (p>0.05, repeated-measures ANOVA; Figure 10c and d). No differences were observed between GVG4–14 and Ct4–14 at 16 weeks in cell size in CA1 and CA3 hippocampal regions and in all layers of the cingulate cortex (data not shown). A trend of increase in the number of PV-IR neurons was observed in the primary sensory cortex at 2 weeks (p=0.085, F=4.03, repeated-measures ANOVA; Figure 10e), but not at 16 weeks (Figure 10g). In contrast, PV-IR neuron density was decreased in the TRN; a trend for reduced PV-IR neuron density was observed at 2 weeks in GVG4–14 mice compared with Ct4–14 (29.9±1.51 vs 34.6±1.64 cells per mm2, p=0.06, t-test; Figure 10f), and a significant reduction was seen at 16 weeks (20.6±0.68 vs 23.0±0.43 cells per mm2, p<0.05, t-test; Figure 10h).
Figure 10.
Region-specific alterations in parvalbumin-immunoreactive (IR) cells due to P4–14 vigabatrin (GVG) treatment. Examples of PV-IR cells in adult hippocampus and cortex (a), CA1 field (a, inset), and thalamic reticular nucleus (TRN, b). The number of PV-IR cells was evaluated in the dentate gyrus (DG), CA1–3 fields of the hippocampus and the subiculum (S) in 2- and 16-week-old mice (c, d). Cell density of PV-IR cells was examined in layers of the primary sensory cortex (S1, L2–6) and the TRN at 2 and 16 weeks (e–h). n=4–6 mice; 2–5 sections, at each point for each group; *p<0.05. Repeated-measures analysis of variance (ANOVA) and Student's t-test were used for all analyses. Results are presented as mean±SEM. Calibration bar represents 150 μm (a, b), 20 μm (a, inset), and 30 μm (b, inset).
Thus, GVG treatment had a transient effect on PV-IR cells in the DG and the primary sensory cortex, and significantly influenced the development of inhibitory neurons in the TRN, suggesting possible consequences on sensory input processing.
Short- and Long-Term Increase in Calbindin Levels
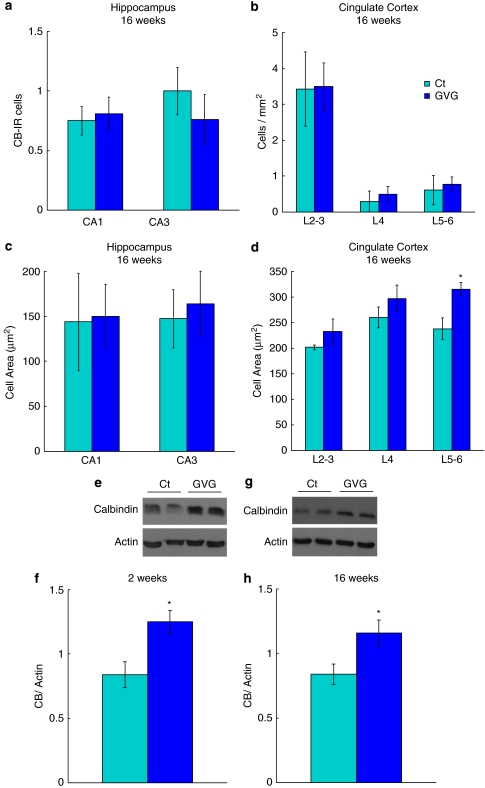
The number and size of CB-IR neurons in the hippocampus at 16 weeks were not altered in response to GVG4–14 treatment (Figure 11a, c). Lack of GVG influence was also observed in CB-IR neuron density in the cingulate cortex (Figure 11b). However, neonatal GVG4–14 treatment increased CB-IR cell area in the cingulate cortex at 16 weeks, compared with Ct4–14 (p<0.05, F=8.402, repeated-measures ANOVA; Figure 11d). A particular difference in cell size was found in layers 5–6 where cell area was 238.2 μm2 in Ct4–14, compared with 316.03 μm2 in GVG4–14 (p<0.05, t-test; Figure 11d). Immunoblot analysis of hippocampal lysate showed that the expression of CB was increased in hippocampi of GVG4–14 treated mice at 2 and 16 weeks, compared with Ct4–14 (148.6 and 138.2% of Ct4–14, p<0.05, t-test; Figure 11e–h). Overall, GVG4–14 had an effect on the amount of CB within hippocampal neurons, but did not influence the number or size of CB-expressing neurons in the hippocampus.
Figure 11.
Short- and long-term increase in calbindin, and lack of P4–14 vigabatrin (GVG) effect on the number and size of CB-IR cells. The number and cell area of CB-IR cells were evaluated in CA1 and CA3 fields of the hippocampus and in layers of the cingulate cortex (L2–3, L4, and L5–6) at 16 weeks (a–d). Examples of CB and actin in homogenates of 2- and 16-week-old mice hippocampi (e, g) of Ct4–14 and GVG4–14 groups. CB expression normalized to actin at 2 and 16 weeks (f, h). For immunohistochemistry (IHC): n=3–6 mice; 2–5 sections, at each point for each group. For immunoblot: n=4–9, at each point for each group. The results of each trial were normalized to the trial mean. Four to five independent repeats of each sample were averaged (each repeat includes a duplicate of each sample). *p<0.05; repeated-measures analysis of variance (ANOVA) and Student's t-test were used for all analyses. Results are presented as mean±SEM.
DISCUSSION
Neonatal GABA enhancement produces a significant change in the ontogeny of key components involved in GABAergic transmission in the hippocampus and cerebral cortex of both young and adult mice. A spatiotemporal susceptibility to neonatal GABA potentiation was observed with the hippocampus being particularly affected when exposed to GVG during P4–14.
Vigabatrin exposure resulted in elevated GABA levels and a consequent reduction in GAD65 and GAD67. These results are in accordance with previous reports showing that elevated GABA levels induced either by GABA or GVG administration caused post-translational regulation of GAD67, in vitro and in vivo (Rimvall and Martin, 1992, 1994; Rimvall et al, 1993). However, in contrast to these studies in which GAD65 protein levels were insensitive to GABA levels, our results show a similar effect on GAD65 and GAD67 expression. Differences between study designs could account for this discordance in GAD65 levels. In contrast to previous studies, in the present study GVG application was performed during the stage of developmental upregulation of GAD65 and 67. Treatment during a more sensitive period may result in susceptibility of both genes to GABA levels. In addition, brains were sampled at different times after the last injection (18 or 36 vs 5 h). Finally, short-term effects on GAD65 expression were statistically significant in the hippocampus but not the cerebral cortex in which a trend for a decrease in GAD65 was observed (see Supplementary Figure S1). This shows a primary effect on GAD67 and a secondary effect on GAD65 that might be a consequence of a heteromeric association between the two forms of GAD, as previously suggested (Sheikh and Martin, 1998) for changes in the cerebellum.
An increase in GAD65/67-IR neuron density was observed in the CA1 region of P4–14 hippocampi on the last day of GVG treatment, whereas a decrease in protein levels was apparent. This suggests that GAD levels have been extremely reduced in each GABAergic cell, enabling to observe a significant reduction in protein despite the enhancement of cell number. Moreover, specific alterations in the number of GABAergic cells in the CA1 region of the hippocampus, but not in the DG area, could lead to modified intrahippocampal connections.
The source of the increased population of GAD-IR and PV-IR neurons observed in subfields of the neonatal hippocampus following P4–14 GVG treatment is unclear. It might reflect an increased migration into the hippocampus or a delay of developmental cell death. The latter may be the case, because similar GAD-IR, PV-IR, and CB-IR neuron densities were detected in the adult hippocampus. An effect on cell death is supported by other studies showing that pre- and postnatal application of GVG or other GABA mimetic drugs caused neurodegeneration attributable to programmed cell death, in various brain regions (Bittigau et al, 2002; Manent et al, 2007) or in a region-specific manner (Nuñez et al, 2003). In contrast to the hippocampus, reduced PV-IR cell density in the TRN was observed in both young and adult treated mice. The TRN consists of GABAergic neurons and has a role in regulating thalamic pathways in the brain, of which the most extensively studied are interactions between the thalamus and the cerebral cortex (Briggs and Usrey, 2008; Guillery and Harting, 2003). Pathways between the thalamus and the hippocampus have also been reported, and projections from the hippocampal formation to the TRN have been recently shown (Cavdar et al, 2008). PV-IR cells are apparent in the TRN from birth (Frassoni et al, 1991), in contrast to the delayed postnatal developmental pattern of PV-IR neurons in the hippocampus (Danglot et al, 2006). This suggests that the influence of GVG exposure on PV-IR neuron expression might be the result of alternative mechanisms in the TRN and the hippocampus.
A long-term increase in GAD protein expression after GVG treatment was ascribed to specific brain areas and treatment periods, suggesting a particular sensitivity of a brain region to manipulations of GABA levels at different developmental stages. Region-specific differences in the short-term effects of GVG on GABA and GAD levels and activity have been previously shown (Sheikh and Martin, 1998). Lack of changes in GABA levels in adult mice suggests that long-term effects on GAD might constitute a slowly evolving compensatory reaction to the short-term suppression of GAD synthesis. Long-lasting changes in GAD were also observed in different cases of developmental damage caused by hypoxia (Gerstein et al, 2005; Louzoun-Kaplan et al, 2008), maternal deprivation (Dent et al, 2007), or prenatal stress (Stone et al, 2001).
Glutamate decarboxylase isoform distribution in neurons varies between brain regions; in hippocampal and cerebral cortex neurons GAD67 is found mainly in the neurons' soma whereas GAD65 is highly abundant in presynaptic terminals (Esclapez et al, 1994; Houser and Esclapez, 1994). Moreover, GAD65 interacts with VGAT on the membrane of synaptic vesicles in GABAergic presynaptic terminals (Jin et al, 2003). This interaction is essential for GABA upload to, and proper function of, the synaptic vesicles. Thus, although GVG treatment did not influence VGAT levels, the ratio between GAD65 and VGAT is expected to change due to alterations in GAD levels in the crude cytoplasmic fraction. However, in the synaptosomal fraction, where the action of GAD and VGAT takes place, GAD65/VGAT ratio was similar in both GVG4–14 and Ct4–14 hippocampi (data not shown). This suggests that GVG does not alter GABA transport into synaptic vesicles. Future studies of this protein complex, which in addition to GAD and VGAT includes heat shock protein 70, cysteine string protein, and CaMKII (Hsu et al, 2000; Jin et al, 2003), might elucidate the relationship between GABA synthesis and transport into synaptic vesicles.
In addition to the aforementioned proteins involved in GABAergic synaptic function, GABAA-receptor mediated transmission is considerably influenced by Cl− homeostasis, which is maintained mainly by the Cl− co-transporters NKCC1 and KCC2. Despite the opposing functions of KCC2 and NKCC1 in the regulation of intracellular Cl− concentration, the general effect of GABA potentiation was similar on both co-transporters in the crude cytoplasmic fraction; an upregulation of NKCC1 was observed in most examined groups, whereas enhancement of KCC2 was shown in a brain-region and treatment-period-specific manner. An upregulating effect of GABA on KCC2 expression has been previously suggested, based on in vitro experiments in culture systems (Fiumelli and Woodin, 2007; Ganguly et al, 2001), however this study shows this effect for the first time in a mouse model. NKCC1 upregulation has been implicated in several pathological conditions, accompanied by KCC2 downregulation (Kahle et al, 2008; Palma et al, 2006). Adoption of an immature molecular phenotype has been suggested to be advantageous for neuronal repair. Expression of immature features in the mature tissue might enhance neuron susceptibility to seizure activity. This is supported by a previous study (Rivera et al, 2004) showing an activity-dependent decrease in membrane expression of KCC2 protein. Therefore, susceptibility is expressed in the transcriptional downregulation of KCC2 as well as its functionality, determined by association to the membrane. We examined KCC2 regulation by the state of its oligomerization, which has been previously suggested to regulate KCC2 activity (Blaesse et al, 2006). Although KCC2 protein expression has been upregulated in hippocampi and was not influenced in the cerebral cortices of GVG4–14 treated mice, examination of KCC2 oligomerization has revealed a short-term enhancement and a long-term reduction of oKCC2 due to GVG exposure in both GVG4–14 hippocampi and cerebral cortices compared with Ct4–14. Thus, the ability of Cl− co-transporters to influence the inhibitory function of GABAA potentials is determined by additional regulatory mechanisms of KCC2, which should be taken into consideration when determining the GABAergic molecular phenotype. Such post-translational modifications include oligomerization, membrane integration, and phosphorylation (Balakrishnan et al, 2003; Blaesse et al, 2006; Kelsch et al, 2001; Lee et al, 2007; Zhang et al, 2006).
Because Cl− homeostasis is determined by both NKCC1 and KCC2, we examined the interaction between these transporters as expressed by the ratio of KCC2/NKCC1 in crude cytoplasmic fraction (S2) and in the plasma-membrane-enriched fraction (LP1). Alterations in KCC2/NKCC1 ratio in S2, but not LP1, suggest a modulation of additional functions of these transporters, other than their electrophysiological role. Recently, KCC2 was shown to have a critical role in spinogenesis (Li et al, 2007). Furthermore, this study suggests that KCC2 influences synchronization in the functional development of glutamatergic and GABAergic synapses in neurons. Moreover, KCC2 expression was shown to be correlated with synaptogenesis (Gulyás et al, 2001; Zhang et al, 2006), and fast kinetics of KCC2 activity regulation was shown (Kelsch et al, 2001; Rivera et al, 2004). Based on this, alterations in KCC2 may influence hippocampal and cortical plasticity and network activity, thereby affecting the trophic role of GABA in development (Ben-Ari, 2002; Owens and Kriegstein, 2002; Represa and Ben-Ari, 2005). This is supported by analysis of CB, which is a Ca2+ binding protein expressed in a population of GABAergic neurons beginning at embryonic stages. The increase in CB levels in the hippocampi of GVG-treated newborn and adult mice, without any corresponding alteration in the density or size of CB-IR neurons, might indicate an increase in cellular levels of this protein. The CB protein serves as an endogenous fast Ca2+ buffer (Nägerl et al, 2000) and thus it regulates activity-dependent processes in synapses (Blatow et al, 2003; Schmidt et al, 2005) and protein activation (Berggard et al, 2002). Therefore, modified cellular CB levels in GVG-treated mice may result in a change in synaptic strength, excitability, and modulation of signaling pathways involving Ca2+.
Abundant literature shows critical and sensitive periods during brain development, in which brain regions are particularly vulnerable to environmental influences depending on their maturational state (Andersen, 2003; Hensch, 2005; Kalia, 2008; Rice and Barone, 2000). This study is the first to show susceptibility of key components of the inhibitory system in the hippocampus to GABA enhancement during P4–14 in mice, thus emphasizing the significance of the period of exposure in treatment regimes. The different regional and temporal effects could be attributed to modified GABAA receptor subunit composition. The physiological properties and pharmacological sensitivity of GABAA receptor are determined by its subunit composition. Previous studies in rat brain showed different temporal and spatial expression patterns of GABAA receptor subunit transcripts (Laurie et al, 1992; Poulter et al, 1992) and proteins (Yu et al, 2006). For example, in the neonatal cortex the α1 and α5 subunits are highly expressed and thereafter decrease to adult levels. Conversely, the mRNA levels of these subunits are constant in young and adult hippocampi, and the protein levels increase in adults. In addition, GABA itself has been shown to increase the mRNA levels of α1 and β2 subunits in cultured cerebellar granule cells (Kim et al, 1993). It would be particularly interesting to examine the influence of neonatal GABA enhancement on the ontogeny of GABAA receptor subunit composition, and a possible indirect effect of altered expression of Cl− co-transporters.
Further studies are now warranted to elucidate possible involvement of additional mechanisms, such as expression of neurotrophic factors and glial GABA regulation in the effects of GVG treatment.
The changes in the GABAergic tone in the hippocampus and the cerebral cortex may explain part of the deleterious consequences observed in children after prenatal and neonatal exposure to GABA-potentiating drugs and should be considered in future treatment strategies.
Acknowledgments
This work was supported by Israel Ministry of Health (_4030). We thank Israeli Ministry of Science, Culture and Sport for the Eshkol fellowship to Tamar Levav-Rabkin. The Alimentary Pharmabiotic Centre is supported in part by the Science Foundation Ireland in the form of a center grant and is also in receipt of funds from GSK.
The authors declare that, except for income from the primary employer, no financial support or compensation has been received from any individual or corporate entity over the past 3 years for research or professional service and there are no personal financial holdings that could be perceived as constituting a potential conflict of interest.
Footnotes
Supplementary Information accompanies the paper on the Neuropsychopharmacology website (http://www.nature.com/npp)
Supplementary Material
References
- Aguado F, Carmona MA, Pozas E, Aguiló A, Martínez-Guijarro FJ, Alcantara S, et al. BDNF regulates spontaneous correlated activity at early developmental stages by increasing synaptogenesis, expression of the K+/Cl− co-transporter KCC2. Development. 2003;130:1267–1280. doi: 10.1242/dev.00351. [DOI] [PubMed] [Google Scholar]
- Andersen SL. Trajectories of brain development: point of vulnerability or window of opportunity. Neurosci Biobehav Rev. 2003;27:3–18. doi: 10.1016/s0149-7634(03)00005-8. [DOI] [PubMed] [Google Scholar]
- Balakrishnan V, Becker M, Löhrke S, Nothwang HG, Güresir E, Friauf E. Expression, function of chloride transporters during development of inhibitory neurotransmission in the auditory brainstem. J Neurosci. 2003;23:4134–4145. doi: 10.1523/JNEUROSCI.23-10-04134.2003. [DOI] [PMC free article] [PubMed] [Google Scholar]
- Ben-Ari Y. Excitatory actions of gaba during development: the nature of the nurture. Nat Rev Neurosci. 2002;3:728–739. doi: 10.1038/nrn920. [DOI] [PubMed] [Google Scholar]
- Ben-Ari Y, Cherubini E, Corradetti R, Gaiarsa JL. Giant synaptic potentials in immature rat CA3 hippocampal neurons. J Physiol. 1989;416:303–325. doi: 10.1113/jphysiol.1989.sp017762. [DOI] [PMC free article] [PubMed] [Google Scholar]
- Berggard T, Szczepankiewicz O, Thulin E, Linse S. Myo-inositol monophosphatase is an activated target of calbindin D28k. J Biol Chem. 2002;277:41954–41959. doi: 10.1074/jbc.M203492200. [DOI] [PubMed] [Google Scholar]
- Berton F, Cornet V, Iborra C, Garrido J, Dargent B, Fukuda M, et al. Synaptotagmin I, IV define distinct populations of neuronal transport vesicles. Eur J Neurosci. 2000;12:1294–1302. doi: 10.1046/j.1460-9568.2000.00013.x. [DOI] [PubMed] [Google Scholar]
- Bittigau P, Sifringer M, Genz K, Reith E, Pospischil D, Govindarajalu S, et al. Antiepileptic drugs, apoptotic neurodegeneration in the developing brain. Proc Natl Acad Sci USA. 2002;99:15089–15094. doi: 10.1073/pnas.222550499. [DOI] [PMC free article] [PubMed] [Google Scholar]
- Blaesse P, Airaksinen MS, Rivera C, Kaila K. Cation-chloride cotransporters, neuronal function. Neuron. 2009;61:820–838. doi: 10.1016/j.neuron.2009.03.003. [DOI] [PubMed] [Google Scholar]
- Blaesse P, Guillemin I, Schindler J, Schweizer M, Delpire E, Khiroug L, et al. Oligomerization of KCC2 correlates with development of inhibitory neurotransmission. J Neurosci. 2006;26:10407–10419. doi: 10.1523/JNEUROSCI.3257-06.2006. [DOI] [PMC free article] [PubMed] [Google Scholar]
- Blatow M, Caputi A, Burnashev N, Monyer H, Rozov A. Ca2+ buffer saturation underlies paired pulse facilitation in calbindin-D28k-containing terminals. Neuron. 2003;38:79–88. doi: 10.1016/s0896-6273(03)00196-x. [DOI] [PubMed] [Google Scholar]
- Briggs F, Usrey WM. Emerging views of corticothalamic function. Curr Opin Neurobiol. 2008;18:403–407. doi: 10.1016/j.conb.2008.09.002. [DOI] [PMC free article] [PubMed] [Google Scholar]
- Cavdar S, Onat FY, Cakmak YO, Yananli HR, Gülçebi M, Aker R. The pathways connecting the hippocampal formation, the thalamic reuniens nucleus, the thalamic reticular nucleus in the rat. J Anat. 2008;212:249–256. doi: 10.1111/j.1469-7580.2008.00858.x. [DOI] [PMC free article] [PubMed] [Google Scholar]
- Clarke G, O'Mahony S, Malone G, Dinan TG. An isocratic high performance liquid chromatography method for the determination of GABA, glutamate in discrete regions of the rodent brain. J Neurosci Methods. 2007;160:223–230. doi: 10.1016/j.jneumeth.2006.09.006. [DOI] [PubMed] [Google Scholar]
- Cohen I, Navarro V, Clemenceau S, Baulac M, Miles R. On the origin of interictal activity in human temporal lobe epilepsy in vitro. Science. 2002;298:1418–1421. doi: 10.1126/science.1076510. [DOI] [PubMed] [Google Scholar]
- Conti F, Minelli A, Melone M. GABA transporters in the mammalian cerebral cortex: localization, development, pathological implications. Brain Res Brain Res Rev. 2004;45:196–212. doi: 10.1016/j.brainresrev.2004.03.003. [DOI] [PubMed] [Google Scholar]
- Danglot L, Triller A, Marty S. The development of hippocampal interneurons in rodents. Hippocampus. 2006;16:1032–1060. doi: 10.1002/hipo.20225. [DOI] [PubMed] [Google Scholar]
- Dent G, Choi DC, Herman JP, Levine S. GABAergic circuits, the stress hyporesponsive period in the rat: ontogeny of glutamic acid decarboxylase (GAD) 67 mRNA expression in limbic–hypothalamic stress pathways. Brain Res. 2007;1138:1–9. doi: 10.1016/j.brainres.2006.04.082. [DOI] [PubMed] [Google Scholar]
- Di Cristo G. Development of cortical GABAergic circuits and its implications for neurodevelopmental disorders. Clin Genet. 2007;72:1–8. doi: 10.1111/j.1399-0004.2007.00822.x. [DOI] [PubMed] [Google Scholar]
- Dzhala VI, Talos DM, Sdrulla DA, Brumback AC, Mathews GC, Benke TA, et al. NKCC1 transporter facilitates seizures in the developing brain. Nat Med. 2005;11:1205–1213. doi: 10.1038/nm1301. [DOI] [PubMed] [Google Scholar]
- Esclapez M, Tillakaratne NJ, Kaufman DL, Tobin AJ, Houser CR. Comparative localization of two forms of glutamic acid decarboxylase their mRNAs in rat brain supports the concept of functional differences between the forms. J Neurosci. 1994;14:1834–1855. doi: 10.1523/JNEUROSCI.14-03-01834.1994. [DOI] [PMC free article] [PubMed] [Google Scholar]
- Fiumelli H, Woodin MA. Role of activity-dependent regulation of neuronal chloride homeostasis in development. Curr Opin Neurobiol. 2007;17:81–86. doi: 10.1016/j.conb.2007.01.002. [DOI] [PubMed] [Google Scholar]
- Frassoni C, Bentivoglio M, Spreafico R, Sánchez MP, Puelles L, Fairen A. Postnatal development of calbindin parvalbumin immunoreactivity in the thalamus of the rat. Brain Res Dev Brain Res. 1991;58:243–249. doi: 10.1016/0165-3806(91)90011-7. [DOI] [PubMed] [Google Scholar]
- Ganguly K, Schinder AF, Wong ST, Poo M. GABA itself promotes the developmental switch of neuronal GABAergic responses from excitation to inhibition. Cell. 2001;105:521–532. doi: 10.1016/s0092-8674(01)00341-5. [DOI] [PubMed] [Google Scholar]
- Gerstein M, Huleihel M, Mane R, Stilman M, Kashtuzki I, Hallak M, et al. Remodeling of hippocampal GABAergic system in adult offspring after maternal hypoxia and magnesium sulfate load: immunohistochemical study. Exp Neurol. 2005;196:18–29. doi: 10.1016/j.expneurol.2005.06.019. [DOI] [PubMed] [Google Scholar]
- Gozlan H, Ben-Ari Y. Interneurons are the source and the targets of the first synapses formed in the rat developing hippocampal circuit. Cereb Cortex. 2003;13:684–692. doi: 10.1093/cercor/13.6.684. [DOI] [PubMed] [Google Scholar]
- Guillery RW, Harting JK. Structure and connections of the thalamic reticular nucleus: advancing views over half a century. J Comp Neurol. 2003;463:360–371. doi: 10.1002/cne.10738. [DOI] [PubMed] [Google Scholar]
- Gulyás AI, Sík A, Payne JA, Kaila K, Freund TF. The KCl cotransporter, KCC2, is highly expressed in the vicinity of excitatory synapses in the rat hippocampus. Eur J Neurosci. 2001;13:2205–2217. doi: 10.1046/j.0953-816x.2001.01600.x. [DOI] [PubMed] [Google Scholar]
- Hensch TK. Critical period plasticity in local cortical circuits. Nat Rev Neurosci. 2005;6:877–888. doi: 10.1038/nrn1787. [DOI] [PubMed] [Google Scholar]
- Herlenius E, Lagercrantz H. Development of neurotransmitter systems during critical periods. Exp Neurol. 2004;190 (Suppl 1:S8–S21. doi: 10.1016/j.expneurol.2004.03.027. [DOI] [PubMed] [Google Scholar]
- Hof PR, Glezer II, Condé F, Flagg RA, Rubin MB, Nimchinsky EA, et al. Cellular distribution of the calcium-binding proteins parvalbumin calbindin, calretinin in the neocortex of mammals: phylogenetic developmental patterns. J Chem Neuroanat. 1999;16:77–116. doi: 10.1016/s0891-0618(98)00065-9. [DOI] [PubMed] [Google Scholar]
- Houser CR, Esclapez M. Localization of mRNAs encoding two forms of glutamic acid decarboxylase in the rat hippocampal formation. Hippocampus. 1994;4:530–545. doi: 10.1002/hipo.450040503. [DOI] [PubMed] [Google Scholar]
- Hsu CC, Davis KM, Jin H, Foos T, Floor E, Chen W, et al. Association of -glutamic acid decarboxylase to the 70-kDa heat shock protein as a potential anchoring mechanism to synaptic vesicles. J Biol Chem. 2000;275:20822–20828. doi: 10.1074/jbc.M001403200. [DOI] [PubMed] [Google Scholar]
- Hübner C, Stein V, Hermans-Borgmeyer I, Meyer T, Ballanyi K, Jentsch T. Disruption of KCC2 reveals an essential role of K-Cl cotransport already in early synaptic inhibition. Neuron. 2001;30:515–524. doi: 10.1016/s0896-6273(01)00297-5. [DOI] [PubMed] [Google Scholar]
- Huttner WB, Schiebler W, Greengard P, De Camilli P. Synapsin I (protein I), a nerve terminal-specific phosphoprotein. III. Its association with synaptic vesicles studied in a highly purified synaptic vesicle preparation. J Cell Biol. 1983;96:1374–1388. doi: 10.1083/jcb.96.5.1374. [DOI] [PMC free article] [PubMed] [Google Scholar]
- Jin H, Wu H, Osterhaus G, Wei J, Davis K, Sha D, et al. Demonstration of functional coupling between gamma-aminobutyric acid (GABA) synthesis and vesicular GABA transport into synaptic vesicles. Proc Natl Acad Sci USA. 2003;100:4293–4298. doi: 10.1073/pnas.0730698100. [DOI] [PMC free article] [PubMed] [Google Scholar]
- Kahle KT, Staley KJ, Nahed BV, Gamba G, Hebert SC, Lifton RP, et al. Roles of the cation-chloride cotransporters in neurological disease. Nat Clin Pract Neurol. 2008;4:490–503. doi: 10.1038/ncpneuro0883. [DOI] [PubMed] [Google Scholar]
- Kalia M. Brain development: anatomy, connectivity, adaptive plasticity, and toxicity. Metabolism. 2008;57 (Suppl 2:S2–S5. doi: 10.1016/j.metabol.2008.07.009. [DOI] [PubMed] [Google Scholar]
- Kelsch W, Hormuzdi S, Straube E, Lewen A, Monyer H, Misgeld U. Insulin-like growth factor 1 and a cytosolic tyrosine kinase activate chloride outward transport during maturation of hippocampal neurons. J Neurosci. 2001;21:8339–8347. doi: 10.1523/JNEUROSCI.21-21-08339.2001. [DOI] [PMC free article] [PubMed] [Google Scholar]
- Khazipov R, Esclapez M, Caillard O, Bernard C, Khalilov I, Tyzio R, et al. Early development of neuronal activity in the primate hippocampus in utero. J Neurosci. 2001;21:9770–9781. doi: 10.1523/JNEUROSCI.21-24-09770.2001. [DOI] [PMC free article] [PubMed] [Google Scholar]
- Kim HY, Sapp DW, Olsen RW, Tobin AJ. GABA alters GABAA receptor mRNAs and increases ligand binding. J Neurochem. 1993;61:2334–2337. doi: 10.1111/j.1471-4159.1993.tb07481.x. [DOI] [PubMed] [Google Scholar]
- Laurie DJ, Wisden W, Seeburg PH. The distribution of thirteen GABAA receptor subunit mRNAs in the rat brain. III. Embryonic and postnatal development. J Neurosci. 1992;12:4151–4172. doi: 10.1523/JNEUROSCI.12-11-04151.1992. [DOI] [PMC free article] [PubMed] [Google Scholar]
- Lee HH, Walker JA, Williams JR, Goodier RJ, Payne JA, Moss SJ. Direct protein kinase C-dependent phosphorylation regulates the cell surface stability and activity of the potassium chloride cotransporter KCC2. J Biol Chem. 2007;282:29777–29784. doi: 10.1074/jbc.M705053200. [DOI] [PubMed] [Google Scholar]
- Levav T, Saar T, Berkovich L, Golan H. Perinatal exposure to GABA-transaminase inhibitor impaired psychomotor function in the developing and adult mouse. Int J Dev Neurosci. 2004;22:137–147. doi: 10.1016/j.ijdevneu.2004.03.004. [DOI] [PubMed] [Google Scholar]
- Levav T, Wirthaim O, Weiss R, Grossman Y, Golan H. Impaired synaptogenesis and long-term modulation of behavior following postnatal elevation of GABA levels in mice. Neuropharmacology. 2008;54:387–398. doi: 10.1016/j.neuropharm.2007.10.012. [DOI] [PubMed] [Google Scholar]
- Levitt P, Eagleson K, Powell E. Regulation of neocortical interneuron development and the implications for neurodevelopmental disorders. Trends Neurosci. 2004;27:400–406. doi: 10.1016/j.tins.2004.05.008. [DOI] [PubMed] [Google Scholar]
- Lewis DA, Hashimoto T, Volk DW. Cortical inhibitory neurons and schizophrenia. Nat Rev Neurosci. 2005;6:312–324. doi: 10.1038/nrn1648. [DOI] [PubMed] [Google Scholar]
- Li H, Khirug S, Cai C, Ludwig A, Blaesse P, Kolikova J, et al. KCC2 interacts with the dendritic cytoskeleton to promote spine development. Neuron. 2007;56:1019–1033. doi: 10.1016/j.neuron.2007.10.039. [DOI] [PubMed] [Google Scholar]
- Louzoun-Kaplan V, Zuckerman M, Perez-Polo JR, Golan HM. Prenatal hypoxia down regulates the GABA pathway in newborn mice cerebral cortex; partial protection by MgSO4. Int J Dev Neurosci. 2008;26:77–85. doi: 10.1016/j.ijdevneu.2007.09.002. [DOI] [PubMed] [Google Scholar]
- Ma W, Barker J. GABA, GAD, and GABA(A) receptor alpha4, beta1, and gamma1 subunits are expressed in the late embryonic and early postnatal neocortical germinal matrix and coincide with gliogenesis. Microsc Res Tech. 1998;40:398–407. doi: 10.1002/(SICI)1097-0029(19980301)40:5<398::AID-JEMT6>3.0.CO;2-N. [DOI] [PubMed] [Google Scholar]
- Manent JB, Jorquera I, Mazzucchelli I, Depaulis A, Perucca E, Ben-Ari Y, et al. Fetal exposure to GABA-acting antiepileptic drugs generates hippocampal and cortical dysplasias. Epilepsia. 2007;48:684–693. doi: 10.1111/j.1528-1167.2007.01056.x. [DOI] [PubMed] [Google Scholar]
- Nägerl UV, Novo D, Mody I, Vergara JL. Binding kinetics of calbindin-D(28k) determined by flash photolysis of caged Ca(2+) Biophys J. 2000;79:3009–3018. doi: 10.1016/S0006-3495(00)76537-4. [DOI] [PMC free article] [PubMed] [Google Scholar]
- Nuñez JL, Alt JJ, McCarthy MM. A new model for prenatal brain damage. I. GABAA receptor activation induces cell death in developing rat hippocampus. Exp Neurol. 2003;181:258–269. doi: 10.3201/eid0906.030118. [DOI] [PMC free article] [PubMed] [Google Scholar]
- Owens DF, Boyce LH, Davis MB, Kriegstein AR. Excitatory GABA responses in embryonic and neonatal cortical slices demonstrated by gramicidin perforated-patch recordings and calcium imaging. J Neurosci. 1996;16:6414–6423. doi: 10.1523/JNEUROSCI.16-20-06414.1996. [DOI] [PMC free article] [PubMed] [Google Scholar]
- Owens DF, Kriegstein AR. Is there more to GABA than synaptic inhibition. Nat Rev Neurosci. 2002;3:715–727. doi: 10.1038/nrn919. [DOI] [PubMed] [Google Scholar]
- Palma E, Amici M, Sobrero F, Spinelli G, Di Angelantonio S, Ragozzino D, et al. Anomalous levels of Cl− transporters in the hippocampal subiculum from temporal lobe epilepsy patients make GABA excitatory. Proc Natl Acad Sci USA. 2006;103:8465–8468. doi: 10.1073/pnas.0602979103. [DOI] [PMC free article] [PubMed] [Google Scholar]
- Payne JA, Rivera C, Voipio J, Kaila K. Cation-chloride co-transporters in neuronal communication, development and trauma. Trends Neurosci. 2003;26:199–206. doi: 10.1016/S0166-2236(03)00068-7. [DOI] [PubMed] [Google Scholar]
- Poulter MO, Barker JL, O'Carroll AM, Lolait SJ, Mahan LC. Differential and transient expression of GABAA receptor alpha-subunit mRNAs in the developing rat CNS. J Neurosci. 1992;12:2888–2900. doi: 10.1523/JNEUROSCI.12-08-02888.1992. [DOI] [PMC free article] [PubMed] [Google Scholar]
- Represa A, Ben-Ari Y. Trophic actions of GABA on neuronal development. Trends Neurosci. 2005;28:278–283. doi: 10.1016/j.tins.2005.03.010. [DOI] [PubMed] [Google Scholar]
- Rice D, Barone S., Jr Critical periods of vulnerability for the developing nervous system: evidence from humans and animal models. Environ Health Perspect. 2000;108 (Suppl 3:511–533. doi: 10.1289/ehp.00108s3511. [DOI] [PMC free article] [PubMed] [Google Scholar]
- Rimvall K, Martin DL. Increased intracellular gamma-aminobutyric acid selectively lowers the level of the larger of two glutamate decarboxylase proteins in cultured GABAergic neurons from rat cerebral cortex. J Neurochem. 1992;58:158–166. doi: 10.1111/j.1471-4159.1992.tb09291.x. [DOI] [PubMed] [Google Scholar]
- Rimvall K, Martin DL. The level of GAD67 protein is highly sensitive to small increases in intraneuronal gamma-aminobutyric acid levels. J Neurochem. 1994;62:1375–1381. doi: 10.1046/j.1471-4159.1994.62041375.x. [DOI] [PubMed] [Google Scholar]
- Rimvall K, Sheikh SN, Martin DL. Effects of increased gamma-aminobutyric acid levels on GAD67 protein and mRNA levels in rat cerebral cortex. J Neurochem. 1993;60:714–720. doi: 10.1111/j.1471-4159.1993.tb03206.x. [DOI] [PubMed] [Google Scholar]
- Rivera C, Voipio J, Payne JA, Ruusuvuori E, Lahtinen H, Lamsa K, et al. The K+/Cl− co-transporter KCC2 renders GABA hyperpolarizing during neuronal maturation. Nature. 1999;397:251–255. doi: 10.1038/16697. [DOI] [PubMed] [Google Scholar]
- Rivera C, Voipio J, Thomas-Crusells J, Li H, Emri Z, Sipilä S, et al. Mechanism of activity-dependent downregulation of the neuron-specific K-Cl cotransporter KCC2. J Neurosci. 2004;24:4683–4691. doi: 10.1523/JNEUROSCI.5265-03.2004. [DOI] [PMC free article] [PubMed] [Google Scholar]
- Schmidt H, Schwaller B, Eilers J. Calbindin D28k targets myo-inositol monophosphatase in spines and dendrites of cerebellar Purkinje neurons. Proc Natl Acad Sci USA. 2005;102:5850–5855. doi: 10.1073/pnas.0407855102. [DOI] [PMC free article] [PubMed] [Google Scholar]
- Sheikh SN, Martin DL. Elevation of brain GABA levels with vigabatrin (gamma-vinylGABA) differentially affects GAD65 and GAD67 expression in various regions of rat brain. J Neurosci Res. 1998;52:736–741. doi: 10.1002/(SICI)1097-4547(19980615)52:6<736::AID-JNR12>3.0.CO;2-X. [DOI] [PubMed] [Google Scholar]
- Sipilä ST, Schuchmann S, Voipio J, Yamada J, Kaila K. The cation-chloride cotransporter NKCC1 promotes sharp waves in the neonatal rat hippocampus. J Physiol. 2006;573:765–773. doi: 10.1113/jphysiol.2006.107086. [DOI] [PMC free article] [PubMed] [Google Scholar]
- Soghomonian JJ, Martin DL. Two isoforms of glutamate decarboxylase: why. Trends Pharmacol Sci. 1998;19:500–505. doi: 10.1016/s0165-6147(98)01270-x. [DOI] [PubMed] [Google Scholar]
- Stone DJ, Walsh JP, Sebro R, Stevens R, Pantazopolous H, Benes FM. Effects of pre- and postnatal corticosterone exposure on the rat hippocampal GABA system. Hippocampus. 2001;11:492–507. doi: 10.1002/hipo.1066. [DOI] [PubMed] [Google Scholar]
- van den Pol AN, Obrietan K, Chen G. Excitatory actions of GABA after neuronal trauma. J Neurosci. 1996;16:4283–4292. doi: 10.1523/JNEUROSCI.16-13-04283.1996. [DOI] [PMC free article] [PubMed] [Google Scholar]
- Yamada J, Okabe A, Toyoda H, Kilb W, Luhmann HJ, Fukuda A. Cl− uptake promoting depolarizing GABA actions in immature rat neocortical neurones is mediated by NKCC1. J Physiol. 2004;557:829–841. doi: 10.1113/jphysiol.2004.062471. [DOI] [PMC free article] [PubMed] [Google Scholar]
- Yu ZY, Wang W, Fritschy JM, Witte OW, Redecker C. Changes in neocortical and hippocampal GABAA receptor subunit distribution during brain maturation and aging. Brain Res. 2006;1099:73–81. doi: 10.1016/j.brainres.2006.04.118. [DOI] [PubMed] [Google Scholar]
- Zhang LL, Fina ME, Vardi N. Regulation of KCC2 and NKCC during development: membrane insertion and differences between cell types. J Comp Neurol. 2006;499:132–143. doi: 10.1002/cne.21100. [DOI] [PubMed] [Google Scholar]
Associated Data
This section collects any data citations, data availability statements, or supplementary materials included in this article.


