

Abstract
Combining voltage and Ca2+ imaging allows the correlation of electrical and chemical activity at sub-cellular level. Here we describe a novel apparatus designed to obtain simultaneous voltage and Ca2+ measurements with single-trial resolution from sites as small as a few microns. These measurements can be obtained with negligible optical cross-talk between the two signals and negligible photo-damage of the preparation. The capability of the technique was assessed recording either from individual neurons in brain slices or from networks of cultured neurons. The present achievements open the gate to many novel physiological investigations requiring simultaneous measurement of voltage and Ca2+ signals.
Introduction
The spatial and temporal correlation of membrane potential changes (ΔVm) and Ca2+ signals is critical to understanding many physiological processes. Simultaneous ΔVm and Ca2+ optical measurements were initially achieved using a combination of an absorbance voltage-sensitive dye and a fluorescent Ca2+ indicator (Sabatini & Regehr, 1996), or of fluorescent voltage and Ca2+-sensitive dyes excited by the same wavelength (Sinha et al. 1995; Bullen & Saggau, 1998). Whereas absorbance measurements lack single-cell resolution, several limitations affect fluorescence measurements of ΔVm and Ca2+ signals excited at the same wavelength. In particular, the optical cross-talk of the two dyes contaminates both signals while using the same excitation intensity and exposure time for both measurements is not ideal. These limitations can be minimised by combining a styryl voltage-sensitive dye such as di-2-ANEPEQ (JPW1114) with Fura Ca2+ indicators, separating both excitation and emission (Canepari et al. 2008). Such a combination was used to investigate ΔVm and Ca2+ signals in different preparations (Canepari et al. 2007; Milojkovic et al. 2007; Canepari & Vogt, 2008). This approach, however, utilised sequential repetitive recordings of ΔVm and Ca2+ signals. Sequential measurements (see also Berger et al. 2007) give valid results if identical responses are evoked in repetitive measurements. Many physiological processes, however, are stochastic, showing large trial-to-trial variability. In these cases, the study of the time variability contains important biological information and simultaneous measurement of ΔVm and Ca2+ signals with single-trial resolution is required.
For simultaneous voltage and Ca2+ imaging using commercially available styryl voltage-sensitive dyes and Fura Ca2+ indicators, a system must be designed to illuminate the preparation at two wavelengths and record ΔVm and Ca2+ signals separately. Here we describe a system developed for this application. We used different protocols to characterise the signal-to-noise ratio (S/N) and the spatial and temporal resolution. We demonstrate that ΔVm and Ca2+ signals associated with excitation can be resolved in a single trial from sites of a few microns.
Methods
Preparations, solutions, electrophysiology and analysis
Experiments, approved by Basel cantonal authorities, were performed in 250-μm-thick cerebellar sagittal slices or hippocampal transversal slices from 27- to 35-day-old mice (C57BL/6) prepared as previously described (Canepari & Vogt, 2008; Canepari et al. 2010). Embryonic (E18) hippocampal cultures were prepared by Dr Alexander Kriz as described in Reiterer et al. (2008) and used after 10–14 days in vitro. The extracellular solution contained (mm): 125 NaCl, 26 NaHCO3, 20 glucose, 3 KCl, 1 NaH2PO4, 2 CaCl2 and 1 MgCl2, bubbled with 95% O2 and 5% CO2. The intracellullar solution contained (mm): 125 KMeSO4, 5 KCl, 8 MgSO4, 5 Na2-ATP, 0.3 Tris-GTP, 12 Tris-phosphocreatine and 20 Hepes, adjusted to pH 7.35 with KOH. Patch-clamp recordings were made using a Multiclamp amplifier 700A (Molecular Devices, Sunnyvale, CA, USA) and stimulation was carried out with pipettes filled with extracellular solution. Individual neurons in slices were loaded with JPW1114 (0.2–0.5 mg ml−1) and with either 1 mm Fura-FF (Purkinje neurons) or with 0.5 mm BisFura-2 (pyramidal neurons). Intracellular staining was accomplished as previously described (Canepari et al. 2008). Cultures were stained with di-8-ANEPPS (0.01 mg ml−1) and Fura-2 AM (5 μm) for 30 mins and recordings were carried out after reperfusion with control solution. Temperature was 32–34°C in slice experiments and 22–24°C in culture experiments. Recordings were analysed using Matlab (The MathWorks Inc., Natick, MA, USA). Non-calibrated optical signals were reported as fractional changes in fluorescence (ΔF/F). Anatomical reconstruction of neurons was made from two-photon images as described in Canepari et al. (2010).
Apparatus design and data collection
The system in Fig. 1A, used and described in Canepari et al. (2008), was based on a single light source (xenon lamp) and a single camera (NeuroCCD-SM, RedShirtImaging LLC, Decatur, GA, USA). Voltage and Ca2+ imaging was carried out by manually switching between two filter cubes in the microscope. To achieve simultaneous voltage and Ca2+ imaging we modified the system as shown in Fig. 1B. The epifluorescence port of an Olympus BX51 microscope was used for Ca2+ fluorescence excitation with a 385 nm OptoLED (CAIRN Research Ltd, Faversham, UK), filtered at 387 ± 6 nm and directed to a Nikon 60×/1.0 NA objective using a dichroic mirror FF506 (Semrock, Rochester, NY, USA; spectrum shown in Fig. 1B). To excite voltage fluorescence, a custom-made unit was designed permitting whole-field illumination of the preparation from above the objective using a 100 mW 543 nm solid state laser (model MLL543; CNI, Changchun, China). To reflect 543 nm and transmit voltage and Ca2+ fluorescence we used a dual-band dichroic mirror FF493_574 (Semrock; spectrum shown in Fig. 1B). The image of the preparation was demagnified by a 0.5× projection lens in both voltage and Ca2+ channels and separated using another custom-made unit and a 565 nm long-pass dichroic mirror (565DCXR, Chroma, Bellows Falls, VT, USA). Voltage fluorescence was long-pass filtered at 610 nm (em1 in Fig. 1B), the image was demagnified by 0.38× and acquired by a NeuroCCD-SM camera. Ca2+ fluorescence was filtered at 510 ± 21 nm (em2 in Fig. 1B), the image was demagnified by 0.38× and acquired by a back-illuminated Ixon+ model 860 EMCCD camera (Andor, Belfast, UK), controlled by the Redshirt system A/D board. The image on the 80 × 80 pixel chip of the NeuroCCD camera could be matched and aligned with the image projected to a sub-region of 78 × 78 pixels of the Ixon+ camera, corresponding to ∼160 × 160 μm area in the object plane as shown in Fig. 1B. Measurements reported in this article were taken at 2000 Hz with the NeuroCCD (voltage indicator fluorescence) and 751.88 Hz (slices) or 200 Hz (cultures) with the Ixon+ (Ca2+ indicator fluorescence). The time information of simultaneous voltage and Ca2+ imaging measurements is limited by the sampling theorem as discussed in the supplementary information.
Figure 1. Imaging apparatus and sensitivity.
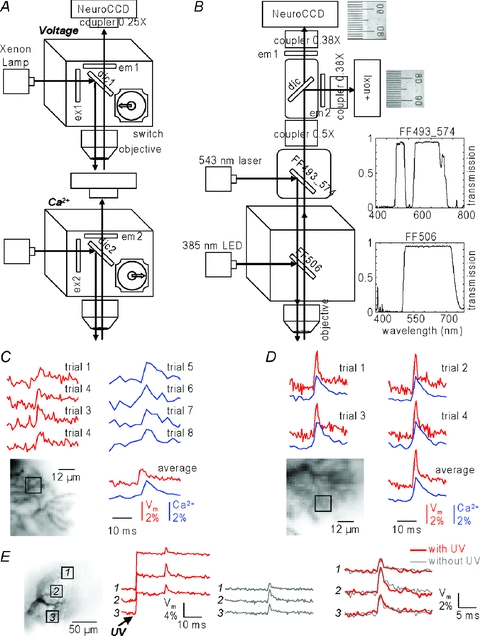
A, schematic drawing of the imaging apparatus used in Canepari & Vogt (2008); combined voltage and Ca2+ imaging obtained sequentially by switching between two filter cubes. B, schematic drawing of the apparatus for simultaneous voltage and Ca2+ imaging; 385 nm OptoLED (CAIRN) illumination via the epifluorescence port of the microscope reflected by a dichroic mirror FF506 (Semrock, transmission curve shown on the right); 543 nm laser illumination via the top of the microscope is reflected by a dual-band dichroic mirror FF493_574 (Semrock, transmission curve shown on the right); the image in the Vm and Ca2+ channels are demagnified by a 0.5× projection lens, separated by a 565 nm dichroic mirror (dic, 565DCXR, Chroma) and filtered by a 610 nm long-pass filter (em1, RG610, Schott) and a 510 ± 21 nm band-pass filter (em2, FF01-510/42, Semrock); the two images were further demagnified by a 0.38× projection lens before being acquired by a NeuroCCD camera (Redshirt) and an Ixon+ EMCCD camera (Andor); two aligned images of a micrometer scale are shown. C, Vm (red traces) and Ca2+ (blue traces) signals associated with a CF-EPSP from the region (∼12.5 × 12.5 μm) indicated below obtained with the apparatus in A: single trials (top) and averages (bottom). D, simultaneous Vm and Ca2+ signals associated with a CF-EPSP from the region (∼12 × 12 μm) indicated below obtained with the apparatus in B: single trials (top) and averages (bottom). Notice the signal-to-noise ratio (S/N) improvement permitting single-trial resolution. E, Vm signals associated with a CF-EPSP from the 3 regions indicated on the left with (red traces) and without (gray traces) concomitant UV illumination; superimposed traces (right) show no signal change with UV illumination.
S/N and optical cross-talk
Figure 1C shows single-trial sequential recordings from a region of ∼12.5 × 12.5 μm obtained with the system in Fig. 1A. The signals are associated with a climbing fibre (CF) excitatory postsynaptic potential (EPSP) from a cerebellar Purkinje neuron (PN). In Canepari & Vogt (2008) CF-EPSP signals could be resolved from regions of that size by averaging four trials (bottom traces in Fig. 1C). Figure 1D shows single-trial simultaneous recordings from a region of ∼12 × 12 μm obtained with the system in Fig. 1B. The improvement in voltage sensitivity using a laser at the edge of the absorption spectrum (see also Holthoff et al. 2010 and Canepari et al. 2010) and the higher UV intensity of the OptoLED resulted in the S/N increase necessary for single-trial resolution. Whereas negligible cross-talk is observed by the Ixon+ camera, the simultaneous UV illumination generated an increase in the recorded light by the NeuroCCD camera. This spurious fluorescence, originating both from the tail UV excitation of the voltage-sensitive dye and from the tail red emission of the Fura indicator, could vary between 3% and 10% at different sites of the preparation (Fig. 1E, left traces) using the optimal intensities of UV and green excitation. Nevertheless, the ΔVm signal was the same whether or not measured with concomitant UV illumination (Fig. 1E, right traces), indicating that optical cross-talk was negligible in these measurements.
Results
We assessed the spatial resolution of ΔVm and Ca2+ signals in individual PNs (Canepari & Vogt, 2008). In this preparation, ΔVm signals can be calibrated and, using 1 mm of the low-affinity indicator Fura-FF, Ca2+ signals can be related to intracellular free Ca2+ concentration changes (Δ[Ca2+]i) (Canepari et al. 2008). Thus, a CF-EPSP producing a depolarization of similar size over the whole dendrite was used to assess and compare the sensitivity from different sites. In contrast, a parallel fibre (PF) EPSP train, exciting only a small area, was used to assess to what extent correlated and localized ΔVm and Ca2+ signals could be resolved. Figure 2A–C shows an example of CF-EPSP single-trial recording. The S/N of both signals was variable. Figure 2B shows the ΔVm and Δ[Ca2+]i signals from three regions of 16 × 16 pixels (∼32 × 32 μm) in different parts of the dendrite. Signals could be resolved with excellent S/N from all the three regions and from regions of the same size in all the cells tested (N= 12). Signals with higher spatial resolution could also be obtained from several areas of each neuron. Figure 2C shows three sub-regions, from region 3 in panel B, covered by 1 pixel (∼2 × 2 μm), 3 × 3 pixels (∼6 × 6 μm) and 5 × 5 pixels (∼10 × 10 μm). Both ΔVm and Δ[Ca2+]i signals could be detected from the single pixel and the S/N increased in the two larger regions. In summary, in all cells tested, ΔVm and Δ[Ca2+]i signals could be resolved from regions <20 μm2.
Figure 2. Simultaneous Vm and Ca2+ measurements from cerebellar Purkinje neurons.
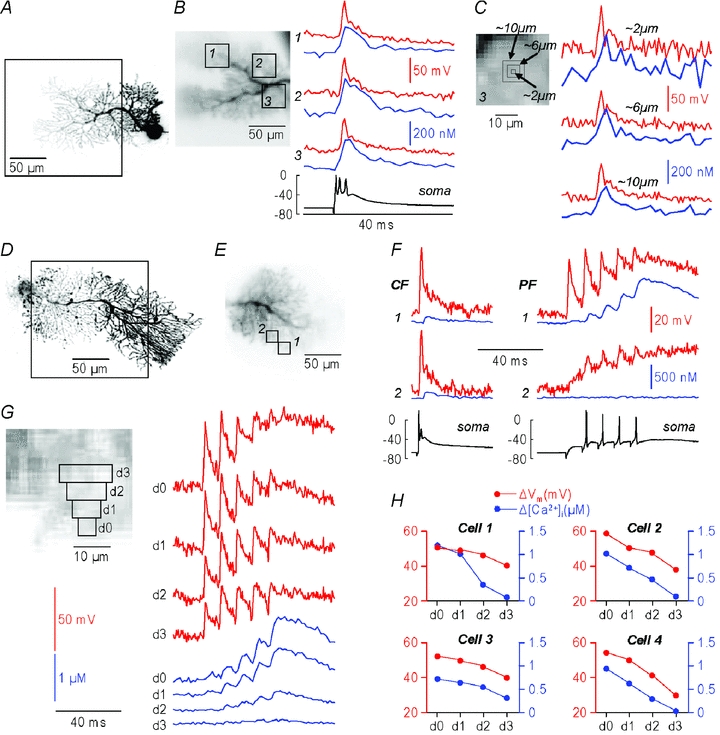
A, reconstruction of a PN; the dendritic area in recording position is outlined. B, left, fluorescence image with 3 selected regions of interest (16 × 16 pixels; ∼32 × 32 μm) outlined; right: ΔVm (red traces) and Δ[Ca2+]i (blue traces) signals associated with a CF-EPSP (single trial) from the 3 regions of interest; somatic electrical recording shown below. C, left, region of interest 3 from panel B, 3 subregions of 1 (2 μm), 3 × 3 (6 μm) and 5 × 5 pixels (10 μm); right, ΔVm and Δ[Ca2+]i signals from the three subregions. D, reconstruction of another PN with the dendritic area in recording position outlined. E, fluorescence image with 2 selected regions of interest (8 × 8 pixels; ∼16 × 16 μm) outlined. F, ΔVm (red traces) and Δ[Ca2+]i (blue traces) signals associated with a CF-EPSP (left) or with a train of 5 PF-EPSPs at 100 Hz (right) from the 2 regions of interest; somatic electrical recordings shown below. G, left, same cell as in D–F, the 3 × 3 pixels region of maximal ΔVm and Δ[Ca2+]i (d0) and the progressively more distal regions of 5 × 3 pixels (d1), 7 × 3 pixels (d2) and 9 × 3 pixels (d3); right, ΔVm and Δ[Ca2+]i signals associated with the PF-EPSPs from regions d0–d3. H, ΔVm and Δ[Ca2+]i peak amplitudes as a function of location associated with a train of 5 PF-EPSPs from 4 cells: d0 is the 3 × 3 pixels region of maximum ΔVm and Δ[Ca2+]i amplitudes. In all cells both signals decay with distance.
We next performed a series of experiments (N= 4 cells) in which dendritic signals were elicited by trains of PF-EPSPs. In the example of Fig. 2D–F, the ΔVm and Δ[Ca2+]i signals associated with one CF-EPSP and a train of five PF-EPSPs at 100 Hz were compared in two 8 × 8 pixels regions. ΔVm and Δ[Ca2+]i signals associated with large depolarization could be observed in both regions for the CF-EPSP but only in region 1, near the PF stimulating electrode, for the PF-EPSP train. As the Δ[Ca2+]i originates from Ca2+ influx during the spikes (Canepari & Vogt, 2008), it is expected to observe a qualitative spatial correlation between the peak ΔVm and Δ[Ca2+]i signals. Thus, in Fig. 2G, we compared the ΔVm and Δ[Ca2+]i signals in the 3 × 3 pixels maximal region and in the progressively more distal 5 × 3 pixels, 7 × 3 pixels and 9 × 3 pixels regions. Both ΔVm and Δ[Ca2+]i decreased with distance from the 3 × 3 pixels maximal region, a result confirmed in the four cells tested (Fig. 2H). This result indicates that single-trial measurements were able to identify sites with correlated ΔVm and Δ[Ca2+]i signals with a spatial resolution of ∼6 μm.
Figure 3A–C illustrates the more common scenario in which ΔVm and Δ[Ca2+]i signals vary in time, as recorded from individual CA1 hippocampal pyramidal neurons in brain slices. The signals were evoked by applying tetanic stimulation (10 pulses at 100 Hz) to the CA3 region (Fig. 3A). Under control conditions, shown in Fig. 3A and B, stimulation elicited three action potentials that back-propagated in the apical dendrite with random timing. We then applied 50 μm of the GABAA receptor antagonist picrotoxin to block synaptic inhibition and monitored the evoked activity every 3 min. The number and frequency of action potentials increased with time (see also Supplemental movie 1). The capability of the technique to resolve ΔVm and Δ[Ca2+]i signals in single trials was critical in this experiment.
Figure 3. Simultaneous Vm and Ca2+ measurements from hippocampal neurons.
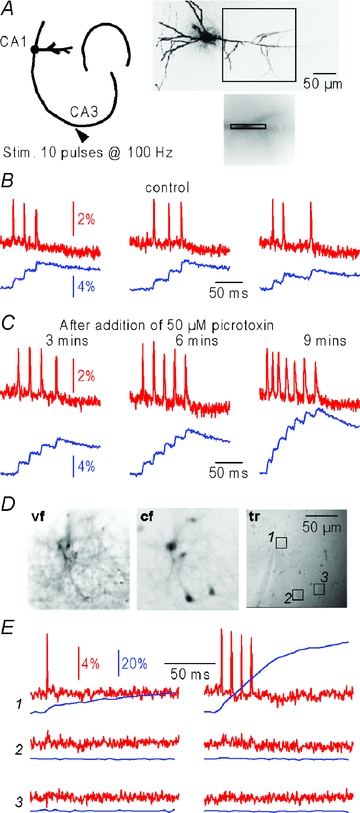
A, left, schematic drawing of the hippocampus with stimulating electrode in the CA3 region and the recording site in the CA1 region of a pyramidal neuron; right, reconstruction of a neuron (top) and the recording area outlines (bottom); B, ΔVm (red traces) and Δ[Ca2+]i (blue traces) single-trial signals from the region of interest in A associated with randomly occurring action potentials evoked by CA3 tetanic stimulation (10 pulses at 100 Hz) in control conditions; recordings were taken every minute. C, same as B after addition of 50 μm picrotoxin; recordings were taken every 3 minutes; animation in Supplemental movie 1. D, images taken from hippocampal cultured cells stained with di-8-ANEPPS and Fura-2 AM; from left to right: voltage-sensitive dye fluorescence image (vf), Ca2+ indicator fluorescence image (cf) and image under transmitted light (tr); regions of interest (1–3) from three identified cells are indicated. E, ΔVm (red traces) and Δ[Ca2+]i (blue traces) single-trial recordings from the regions of interest in D associated with 1 (left) or 4 (right) action potentials evoked in cell 1. Signals were localised; animation in Supplemental movie 2.
We finally tested whether our system can be used in experiments from cell cultures labelled by bulk application of the dyes. Figure 3D shows three images from a culture dish obtained by di-8-ANEPPS fluorescence (vf), Fura-2 fluorescence (cf) and transmitted light (tr). Individual cells were clearly visible. Single-trial recordings shown in Fig. 3E show that ΔVm and Δ[Ca2+]i signals associated with one or four evoked action potentials could be measured exclusively from the stimulated cell 1 (see also Supplemental movie 2).
Discussion
In this report we describe how to achieve simultaneous voltage and Ca2+ imaging with S/N permitting single-trial resolution. Signals of ∼1% change of fluorescence could be discriminated from regions of a few microns. In voltage imaging, 1% signal typically corresponds to ΔVm≈ 10–20 mV in individually stained cells or in cultured cells after bulk staining. Thus, activity could be monitored from small sub-cellular compartments. For Ca2+ imaging, the size of the optical signal corresponding to a given Ca2+ signal depends on the affinity and concentration of the dye. However, we showed that Ca2+ signals associated with individual action potentials could be resolved both with low- and high-affinity dyes. Two concerns that limit the applicability of the technique are photo-toxicity of the voltage-sensitive dye and optical cross-talk. Full illumination with a 100 mW 543 nm laser is equivalent, in terms of dye absorption, to ∼25% illumination with a 300 mW 532 nm laser. In this study, using full-light illumination at 543 nm, we did not detect any photo-damage for at least 20 sequential measurements of 100 ms duration, separated by 30 s. This result is consistent with our previous tests at 532 nm (Canepari et al. 2010). In voltage fluorescence measurement, UV illumination generates a fluorescence increase that depends on the concentrations of the two dyes (Fig. 1E). This spurious fluorescence, however, did not affect the ΔVm signal.
The present results open the gate to novel investigations requiring simultaneous measurement of ΔVm and Ca2+ signals, particularly in neuro- and cardiophysiology. The apparatus is based on commercially available equipment that can be adapted to conventional microscopes.
Acknowledgments
We thank Dr Alexander Kriz for preparing the cultures. We thank Dr Dejan Zecevic for helping us in setting up laser illumination at the early stage of the project and for comments on the manuscript. This work was supported by the Swiss National Science Foundation (SNSF) grant 3100A0_122000 (M.C.).
Glossary
Abbreviations
- CF
climbing fibre
- EPSP
excitatory synaptic potential
- PF
parallel fibre
- PN
cerebellar Purkinje neuron
- S/N
signal-to-noise ratio
- ΔVm
membrane potential changes
Author contributions
Design of the system: K.E.V., J.G. and M.C. Design of the experiments: K.E.V. and M.C. Performing the experiments: S.G. and M.C. Writing and revising the article: M.C. All authors approved the final version.
References
- Berger T, Borgdorff A, Crochet S, Neubauer FB, Lefort S, Fauvet B, Ferezou I, Carleton A, Lüscher HR, Petersen CC. Combined voltage and calcium epifluorescence imaging in vitro and in vivo reveals subthreshold and suprathreshold dynamics of mouse barrel cortex. J Neurophysiol. 2007;97:3751–3762. doi: 10.1152/jn.01178.2006. [DOI] [PubMed] [Google Scholar]
- Bullen A, Saggau P. Indicators and optical configuration for simultaneous high-resolution recording of membrane potential and intracellular calcium using laser scanning microscopy. Pflügers Arch. 1998;436:788–796. doi: 10.1007/s004240050703. [DOI] [PubMed] [Google Scholar]
- Canepari M, Djurisic M, Zecevic D. Dendritic signals from rat hippocampal CA1 pyramidal neurons during coincident pre- and post-synaptic activity: a combined voltage- and calcium-imaging study. J Physiol. 2007;580:463–484. doi: 10.1113/jphysiol.2006.125005. [DOI] [PMC free article] [PubMed] [Google Scholar]
- Canepari M, Vogt KE. Dendritic spike saturation of endogenous calcium buffer and induction of postsynaptic cerebellar LTP. PLoS ONE. 2008;3:e4011. doi: 10.1371/journal.pone.0004011. [DOI] [PMC free article] [PubMed] [Google Scholar]
- Canepari M, Vogt K, Zecevic D. Combining voltage and calcium imaging from neuronal dendrites. Cell Mol Neurobiol. 2008;58:1079–1093. doi: 10.1007/s10571-008-9285-y. [DOI] [PMC free article] [PubMed] [Google Scholar]
- Canepari M, Willadt S, Zecevic D, Vogt KE. Imaging inhibitory synaptic potentials using voltage sensitive dyes. Biophys J. 2010;98:2032–2040. doi: 10.1016/j.bpj.2010.01.024. [DOI] [PMC free article] [PubMed] [Google Scholar]
- Holthoff H, Zecevic D, Konnerth A. Rapid time-course of action potentials in spines and remote dendrites of mouse visual cortex neurons. J Physiol. 2010;588:1085–1096. doi: 10.1113/jphysiol.2009.184960. [DOI] [PMC free article] [PubMed] [Google Scholar]
- Milojkovic BA, Zhou WL, Antic SD. Voltage and calcium transients in basal dendrites of the rat prefrontal cortex. J Physiol. 2007;585:447–468. doi: 10.1113/jphysiol.2007.142315. [DOI] [PMC free article] [PubMed] [Google Scholar]
- Reiterer V, Maier S, Sitte HH, Kriz A, Rüegg MA, Hauri HP, Freissmuth M, Farhan H. Sec24- and ARFGAP1-dependent trafficking of GABA transporter-1 is a prerequisite for correct axonal targeting. J Neurosci. 2008;28:12453–12464. doi: 10.1523/JNEUROSCI.3451-08.2008. [DOI] [PMC free article] [PubMed] [Google Scholar]
- Sabatini BL, Regehr WG. Timing of neurotransmission at fast synapses in the mammalian brain. Nature. 1996;384:170–172. doi: 10.1038/384170a0. [DOI] [PubMed] [Google Scholar]
- Sinha SR, Patel SS, Saggau P. Simultaneous optical recording of evoked and spontaneous transients of membrane potential and intracellular calcium concentration with high spatio-temporal resolution. J Neurosci Methods. 1995;60:49–60. doi: 10.1016/0165-0270(94)00219-7. [DOI] [PubMed] [Google Scholar]