Abstract
The effects of mutations in the charge pair residues Arg282 and Asp341 of the rabbit oligopeptide transporter PepT1 have been studied using electrophysiology in mRNA-injected Xenopus oocytes. Substitution of Arg282 with neutral or negatively charged residues produced a shift towards more positive potentials in the characteristics of charge movement with respect to the wild-type form. Conversely replacement of Asp341 with Arg reduced both pre-steady-state and transport currents and produced a negative shift of the charge movement properties. Both kinds of currents remained pH-sensitive in the mutants. All functional mutants were correctly localized on the cell membrane. Removal of the positive charge of Arg282 produced transporters able to generate conspicuous outward currents whose reversal potential was affected by external pH and by substrate concentration. This suggests that the mutants still translocate protons and substrate as a complex. Charged substrates were accepted by the mutants with the same potency order as the wild-type. The results support the idea that Arg282 and Asp341 play the role of electrostatic gates in the PepT1 transport cycle.
Non-technical summary
The oligopeptide transporter PepT1 is a protein found in the membrane of the cells of the intestinal walls, and represents the main route through which proteic nutrients are absorbed by the organism. Along the polypeptidic chain of this protein, two oppositely charged amino acids, an arginine in position 282 and an aspartate in position 341 of the sequence, have been hypothesised to form a barrier in the absorption pathway. In this paper we show that appropriate mutations of these amino acids change the properties of PepT1 in a way that confirms that these parts of the protein indeed act as an electrostatic gate in the transport process. The identification of the structural basis of the functional mechanism of this transporter is important because, in addition to its role in nutrient uptake, PepT1 represents a major pathway for the absorption of several therapeutic drugs.
Introduction
The proton-dependent di- and tripeptide transporter PepT1 represents the major route of dietary amino acid intake in the intestine of many species (Daniel et al. 2006). This transporter belongs to the solute carrier family SLC15 and because of its electrogenic properties it may be studied through electrophysiological and radiotracer uptake experiments. In addition to the physiological relevance, understanding of the details of its mechanisms of operation is important since it appears to be involved in the absorption of many important, orally administered, drugs (Daniel & Kottra, 2004).
PepT1 has been cloned from various mammalian and non mammalian species, showing rather high degrees of amino acidic similarity (Fei et al. 1994; Saito et al. 1995; Chen et al. 2002; Sangaletti et al. 2009). From the functional point of view, all the studied PepT1 isoforms are able to transport di- and tripeptides with varying degrees of efficiency, and share the substantial inability to transport tetra- (or larger) peptides, as well as single amino acids (Fei et al. 1994).
The pH dependence, initially reported for the human form as an increased peptide absorption at acidic pH (Fei et al. 1994), reveals different aspects in other species: kinetic analysis of transport currents in rabbit and fish PepT1 indicates that acidic pH may affect more the substrate affinity (increase) rather than the maximal velocity of transport (Steel et al. 1997; Kottra & Daniel, 2001; Verri et al. 2003; Sangaletti et al. 2009).
We have recently analysed the effects of external pH on the pre-steady-state currents of PepT1 from different species, concluding that external protonation acts by slowing down a charge-moving partial reaction step of the transporter (Renna et al. 2010). Our results also supported the hypothesis that the intramembrane charge movement generating the pre-steady-state currents is due to the rearrangement of intrinsic charges of the protein (Mackenzie et al. 1996; Nussberger et al. 1997).
Significant evidences of the interaction of protons with the transporter protein arise from mutational studies: histidine 57 in the second transmembrane domain of PepT1 is required in order, for the transporter, to be functional (Fei et al. 1997; Chen et al. 2000; Uchiyama et al. 2003), and this observation suggests that protonation of this residue is a necessary step in the transport cycle. Tyrosine residues around His57 have also been shown to stabilize proton binding (Uchiyama et al. 2003; Pieri et al. 2009) in rabbit PepT1. Other residues have been found to affect PepT1 activity in interesting ways: particularly Arg282 and Asp341 have been reported to form a charge pair that may break and reform during the transport cycle (Kulkarni et al. 2007; Pieri et al. 2008; Meredith, 2009). Interestingly mutation Arg282Glu appeared to convert the cotransporter in a substrate-gated, rather unspecific cation channel (Meredith, 2004; Pieri et al. 2008). In addition, this mutation caused loss of sensitivity to pH.
Most of the above functional observations were derived from uptake data, in the absence of control of the membrane voltage, or from electrophysiological measurement of steady transport currents, in the presence of a dipeptide substrate. Important additional information regarding the transport mechanism may arise from measurement of pre-steady-state currents, the electrophysiological signals that can be observed in the absence of organic substrate, and that represent the first steps in the transport cycle (Fesce et al. 2002; Peres et al. 2004).
The pre-steady-state currents generated by PepT1 have been recorded in rabbit, human, seabass and zebrafish isoforms (Mackenzie et al. 1996; Nussberger et al. 1997; Sala-Rabanal et al. 2006; Sangaletti et al. 2009; Renna et al. 2010). As expected, in PepT1 these currents are pH-dependent, and analysis of their possible alteration in mutant forms of the transporter may be useful to obtain more information on the interactions of particular residues with ions, even when the organic substrate is absent. In the present work we have therefore investigated the properties of the pre-steady-state currents in the wild-type and in mutants of the charge-pair residues R282 and D341. The properties of the transport-associated current in these mutants were studied in parallel, in the attempt to form a more complete picture of the roles of these residues.
Methods
Construction of point mutations
Mutations in rabbit PepT1 were obtained by site-directed mutagenesis. Briefly, 20 ng of the plasmid containing the FLAG-wild-type PepT1 cDNA (Mertl et al. 2008) were amplified with 2.5 units of Pfu DNA polymerase in the presence of overlapping primers containing in their sequence the mutated codons:
rbPepT1 D341R: 5′-CCTGGTCCCCATCATGCGCGCCGTGGTGTATCC-3′
rbPepT1H57R: 5′-GGACGACAACCTGTCCACGGTCGTCTACCACACGTTCGTC-3′
rbPepT1 R282X: 5′-CGCGCAGATCAAGATGGTTACGXXXGTGCTGTTCCTGTACATCCC-3′
where the original sequence AGG was transformed in XXX that correspond to the following triplets: for R282D GAT, for R282A GCG, for R282E GAG, for R282K AAG and for R282Q GAC. PCR amplification was performed with 25 thermal cycles of 95°C for 30 s, 55°C for 1 min, and 68°C for 14 min. Then, 10 units of DpnI were added directly to the amplification reaction, and the sample was incubated for 1 h at 37°C to digest the parental, methylated DNA. JM109 supercompetent cells were finally transformed with 1 μl of the reaction mixture and plated onto LB-ampicillin plates. After plasmid purification, plasmid cDNAs were fully sequenced (Eurofin MWG Operon, Ebersberg, Germany).
Oocyte expression
Oocytes and RNAs were prepared as detailed described previously (Bossi et al. 2007). In summary, to prepare the mRNA, the cDNA encoding PepT1-FLAG transporters, cloned into the pSPORT-1 vector (Mertl et al. 2008), was linearized with NotI; subsequently cRNA was synthesized in vitro in the presence of Cap Analogue and 200 units of T7 RNA polymerase. All enzymes were supplied by Promega Italia (Milan, Italy). Oocytes were obtained from adult female Xenopus laevis, the frogs were anaesthetised in MS222 (tricaine methansulfonate; 0.10% w/v solution in tap water) and portions of the ovary were removed through an incision on the abdomen. The oocytes were treated with collagenase (Sigma Type IA; 1 mg ml−1 in ND96 Ca2+ free) for at least 1 h at 18°C. After 24 h at 18°C in modified Barth's saline solution (MBS), the healthy looking oocytes, were injected with 12.5 ng of cRNA in 50 nl of water, using a manual microinjection system (Drummond). The oocytes were then incubated at 18°C for 3–4 days in MBS before electrophysiological studies. The experiments were carried out according to the institutional and national ethical guidelines (permit no. 12/09) and complied with the ethical guidelines of The Journal of Physiology.
Single-oocyte chemiluminescence
To evaluate the expression at the oocyte plasma membrane, we used the single oocyte chemiluminescence (SOC) technique pioneered by Zerangue et al. (1999) and used by others (McAlear et al. 2006; Rauh et al. 2010) to quantify a tagged protein expressed at the cell surface. This technique employs enzyme amplification with a chemiluminescent substrate and sensitive linear detection with a luminometer. Oocytes expressing different FLAG-PepT1 isoforms, as well as non-transfected oocytes, were washed twice for 5 min in ice-cold ND96 (pH 7.6) and then fixed with 4% paraformaldehyde in ND96 for 15 min at 4°C, rinsed 3 × 5 min with equal volumes of ND96, and then incubated for 1 h in a 1% BSA-ND96 blocking solution (used in subsequent antibody incubation steps). Fixed and blocked oocytes were incubated for 1 h in primary mouse anti-FLAG M2 (Sigma, Milan, Italy) monoclonal antibody (1 μg ml−1 in 1% BSA-ND96), washed 6 × 3 min in 1% BSA-ND96, incubated for 1 h in secondary peroxidase-conjugated goat anti-mouse IgG (1 μg ml−1, IgG-HRP; Jackson ImmunoResearch Laboratories, Europe Ltd, Stuffolk, UK), and washed 6 × 3 min in 1% BSA-ND96 and then 6 × 3 min in ND96 alone. For chemiluminescence readings, each oocyte was transferred into a well of a 96-well plate (Assay Plate White not treated, flat bottom, Corning Costar) filled with 50 μl SuperSignal Femto (Pierce/Thermo Scientific, Rockford, IL, USA); the washing solution was eliminated as much as possible. Chemiluminescence was quantified with a Tecan Infinity 200 microplate reader. The plates were read not later than 5 min after the transfer of the first oocyte. The data were then acquired at least three times in 10 min and for each oocyte the mean of three readings was calculated. Results were normalized to the mean value of wild-type FLAG-PepT1 for each batch and are given in relative light units (RLU).
Immunohistochemistry
Oocytes in which transport activity had been confirmed electrophysiologically were fixed in 100% methanol at −20°C for 2 h, then rehydrated at room temperature (RT) for 15 min in 50:50 (v/v) methanol/phosphate-buffered saline (PBS), followed by 2 × 15 min washes in PBS. The fixed oocytes were then embedded in Polyfreeze tissue freezing medium (Polysciences, Eppelheim, Germany) and immediately frozen in liquid nitrogen. Cryosections (7 μm) were obtained with a Leica CM 1850 cryostat. The sections were incubated in the blocking buffer (2% bovine serum albumin, BSA (w/v), 0.1% Tween in PBS) at RT for 30 min, then the primary antibody, mouse anti-FLAG M2 (Sigma, 3.8 mg ml−1) 1:1000 in blocking buffer was added and incubated at RT for 1 h. Samples were washed 3 × 5 min in blocking buffer at RT. The oocytes sections were then incubated in the secondary antibody (Cy™3-conjugated AffiniPure Donkey Anti-Mouse (Jackson ImmunoResearch), 1.4 mg ml−1, diluted 1:1000 in Blocking Buffer) at RT for 45 min and again washed 3 × 5 min with blocking buffer. Images were observed with a fluorescence microscope (Olympus BH2) through a rhodamine filter set (excitation/emission filters 550/580 nm). Images were acquired with a DS-5M-L1 Nikon digital camera system.
Electrophysiology and data analysis
Measurement of the currents generated by the transporters in controlled voltage conditions was performed using the classical two-electrode voltage clamp (TEVC) technique (GeneClamp, Molecular Devices, Sunnyvale, CA, USA or Oocyte Clamp OC-725B, Warner Instruments, Hamden, CT, USA). Glass microelectrodes, filled with KCl (3 m) and with tip resistances between 0.5–2 MΩ were used. Bath electrodes were connected to the experimental chamber via agar bridges (3% agar in 3 m KCl). Voltage pulses to test potentials from −140 to +20 mV in 20 mV increments were applied from a –60 mV holding potential (Vh). The current signal was filtered at 1 kHz before sampling at 2 kHz.
Two methods were used to isolate the pre-steady-state currents elicited by voltage jumps (Mertl et al. 2008; Sangaletti et al. 2009): in the first, the slow component of a double-exponential fitting of the transient was taken to represent the pre-steady-state currents, while in the second, the currents remaining after subtraction of the traces in presence from those in absence of substrate were assumed to represent the intramembrane charge movement. The isolated traces were fitted with single exponentials to obtain the time constant of decline, and integrated to calculate the amount of displaced charge, after zeroing any residual steady-state transport current. The presence of gently decaying currents during the voltage pulse was sometimes observed in some mutants at alkaline pH. In these cases a sloping baseline was subtracted before fitting and integration. The two methods gave generally equivalent results; the subtraction method was preferred when the pre-steady-state currents were fast, with time constants approaching that of the endogenous capacitive transients.
Data were analysed using Clampfit 8.2 (Molecular Devices), and figures were prepared with Origin 5.0 (OriginLab Corp., Northampton, MA, USA).
Solutions
The oocyte culture and washing solutions had the following composition (in mm), ND96: NaCl 96, KCl 2, MgCl2 1, CaCl2 1.8, Hepes 5, pH 7.6; MBS: NaCl 88, KCl 1, NaHCO3 2.4, Hepes 15, Ca(NO3)2 0.30, CaCl2 0.41, MgSO4 0.82, sodium penicillin 10 μg ml−1, streptomycin sulphate 10 μg ml−1, gentamycin sulphate 100 μg ml−1, nystatin 10 U ml−1, pH 7.6; PBS: NaCl 138, KCl 2.7 Na2HPO4, 10, KH2PO4, 2, pH 7.6. The external control solution had the following composition (mm): NaCl 98, MgCl2 1, CaCl2 1.8.
Different pH buffers were used for the various pH values: for pH 6.0 and 6.5, Mes 5 mm was used; Hepes 5 mm was employed for pH 7.0 and 7.5, while for pH 8.0 the buffer was Taps 5 mm. The final pH values were adjusted with HCl and NaOH. Dipeptide substrates were added at the indicated concentrations to the appropriate solutions.
Experiments were conducted at room temperature (20–25°C).
Results
Pre-steady-state currents in charge-pair mutants
Previous reports from rabbit PepT1 (Meredith, 2004; Kulkarni et al. 2007; Pieri et al. 2008; Meredith, 2009) have suggested that two well-conserved residues, arginine 282 and aspartate 341, may form a charge pair playing an important role in the transport function. The position of these two residues is shown in Fig. 1.
Figure 1. Cartoon of PepT1 topology and helical distribution.
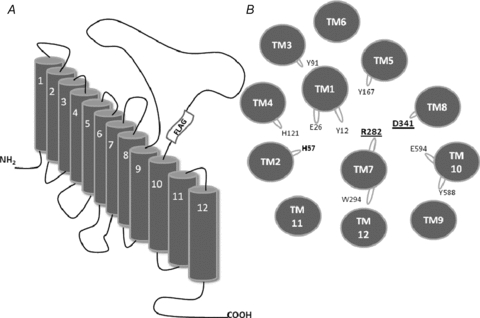
A, representation of the 12 TMDs topology of PepT1 and indication of the position of the FLAG-tag; B, helical wheel plan (derived from Meredith & Price, 2006) of the TMDs in PepT1 showing the putative relative proximity of R282 and D341 in TMDs 7 and 8, respectively, in the homology model of rabbit PepT1. Shown also are the histidine residues, H57 and H121, that have been proposed to play a functional role in PepT1. The residues that were predicted to face into the putative central channel (Bolger et al. 1998) are also drawn, as protrusions from the main helix body.
Considering that the pre-steady-state currents of PepT1 are believed to be mostly due to the rearrangement of charges intrinsic to the transporter (Mackenzie et al. 1996; Nussberger et al. 1997), we examined the behaviour of charge-reverting mutants in these positions of rbPepT1 (R282D, R282E and D341R), as well as the conservative mutation R282K, and the substitution of arginine 282 with the non-charged non-polar alanine (R282A), or the non-charged polar glutamine (R282Q). Furthermore, we tested the essential histidine 57 (H57R) and the double mutant R282D–D341R.
Figure 2 shows representative traces from the various isoforms. All R282 mutants were able to generate pre-steady-state currents in the absence of substrate, as well as transport-associated currents with amplitudes comparable to the wild-type, while the currents observed in the D341R form were smaller, and neither transporter-related nor pre-steady-state currents could be observed in the double mutant R282D–D341R and in H57R.
Figure 2. Current responses to voltage pulses from −140 to +20 mV (from Vh=−60 mV) in the absence and presence of substrate at pH 7.5 in the wild-type and indicated mutants of the rabbit PepT1.
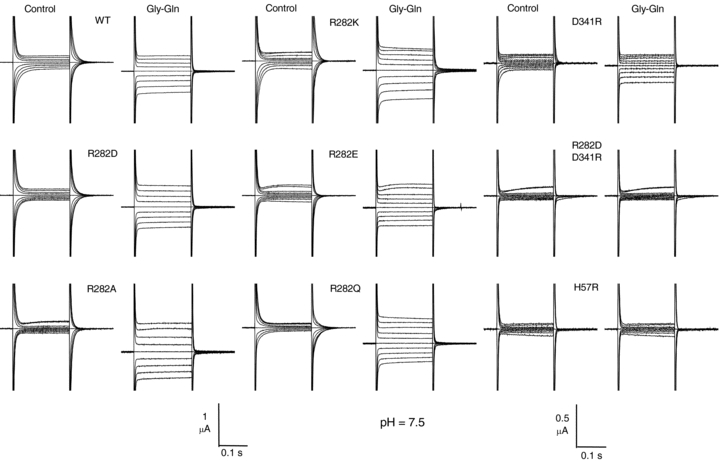
Mutants showing normal or increased functionality are listed in the left and central columns, while those with no (R282D–D341R and H57R) or reduced (D341R) functionality are listed in the right column (note the amplified vertical scale bar). The slowly developing outward currents visible in some of the records at the most positive pulses arise from oocyte endogenous channels and do not affect the analysis.
Localization and membrane expression of the FLAG protein
Immunolocalization experiments were performed to understand whether the various mutants were correctly inserted in the oocyte membrane. Representative images are shown in Fig. 3A. The negative controls (non-injected oocytes and oocytes expressing a wild-type transporter with no FLAG), gave no visible signal in the membrane of the oocytes. All the other isoforms were correctly localized in the membrane to a variable extent. These observations were confirmed by the single-oocyte chemiluminescence (SOC) experiments that were performed on larger numbers of oocytes from different batches (Fig. 3B). All functional mutants were present in the membrane at levels similar to or greater than the wild-type, in agreement with previous results (Kulkarni et al. 2007). Our data also confirm the correct membrane localization of the non-functional mutant H57R (Uchiyama et al. 2003). However, the double mutant R282D–D341R gave only very weak signals in both the immunolocalization and in the chemiluminescence experiments, in agreement with the lack of transport-related currents (Fig. 2).
Figure 3. rbPepT1wt and mutants surface expression.
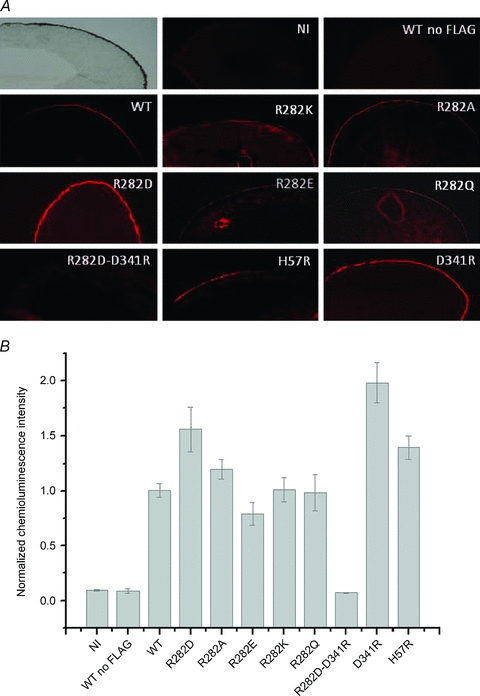
A, immunohistochemistry of Xenopus laevis oocytes expressing FLAG-rbPepT1 wild-type (WT) and the indicated mutants shown as fluorescence microscopy images of the outer membrane of oocytes stained with Cy™3-conjugated donkey anti-mouse antibody. Oocytes non-injected and injected with wild-type non-tagged PepT1 are also included as controls (top row). B, results of the chemiluminescence experiments from oocytes expressing the wild-type and the indicated mutants of rbPepT1-FLAG. The chemiluminescence detected from 20–40 oocytes from 3 different batches secondarily labelled with peroxidase-conjugated goat anti-mouse (IgG-HRP) are shown. The data were normalized to the mean value of the wild-type FLAG-PepT1 of each batch.
These results are generally well correlated to the electrophysiological observations: the lack of transporter-associated currents seen in the R282D–D341R double mutant is paralleled by the weak luminescence signal in Fig. 3 for this isoform, while the large currents displayed by the R282 mutants are in agreement with the strong signals of the localization and luminescence experiments. On the contrary the small pre-steady-state and transport currents recorded in the H57R and D341R forms are in contrast with the large membrane expression seen in the results reported in Fig. 3. Based on these observations, the reduced functionality of this last mutant appears to be attributable to a defect in the molecular mechanism rather than to insufficient targeting to the membrane.
The pre-steady-state currents generated by the functional mutants maintained the sensitivity to external pH by showing a shift towards more negative potentials at more alkaline pH, as illustrated in Fig. 4 for the R282D mutant. The isolated currents were analysed as explained in Methods, and the results of this analysis are plotted in the bottom row of Fig. 4, showing the accelerating action of alkaline pH on the time constant and the shift towards more negative potentials induced by this pH on both τ–V and Q–V curves. Fitting a Boltzmann equation (eqn (1)) to the R282D data of Fig. 4 gives V0.5=−45 ± 0.9 mV at pH 7.5, and 7.8 ± 6 mV at pH 6.5 in this group of oocytes. The estimated maximal moveable charge appears to remain substantially constant (41.4 ± 0.8 nC at pH 7.5 vs. 37.6 ± 3.1 nC at pH 6.5), although these data are subject to significant errors especially at pH 6.5 because of lack of saturation at positive potentials. The comparison with the wild-type data (filled symbols in Fig. 4) shows that at the same pH the decay time constants of the R282D mutant are shorter and that both τ–V and Q–V curves of the mutant are shifted towards more positive potentials (V0.5=−59.2 ± 1.3 mV at pH 6.5 in this group). These effects were also seen, to a various degree, in all other arginine mutants.
Figure 4. Mutants in the charge-pair residues were pH-sensitive.
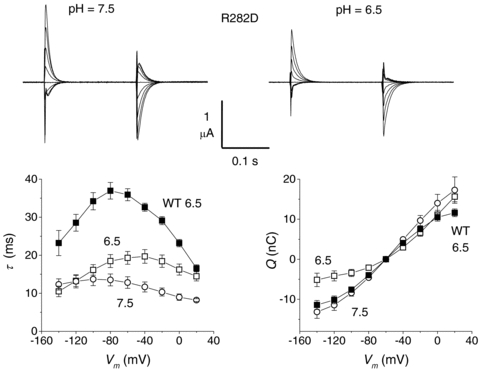
The top row shows traces of pre-steady-state currents isolated using the subtraction method as described in Methods, in a representative oocyte expressing the rabbit R282D mutant at the two indicated pH values. Values of the time constant of decay and of the amount of displaced charge in the two pH are shown in the lower graphs (open symbols, as mean values ±s.e.m. from six oocytes (two batches). For comparison the filled symbols show the averaged data for the wild-type isoform (n= 14 from four batches).
Unidirectional rates
A more complete analysis of the charge movement properties of the different isoforms at pH 6.5 is shown in Fig. 5. Here the Q–V curves are plotted as the amount of charge displaced in an inner position in the membrane electrical field, relative to the maximal displaceable charge (Qmax), obtained from fitting Boltzmann equations to the sigmoidal curves (Fesce et al. 2002).
Figure 5. Charge movement analysis.
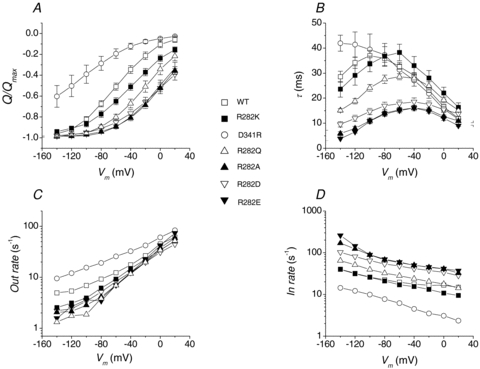
A and B, relative amount of moved charge and decay time constant, respectively for the indicated isoforms at pH 6.5. Average values ±s.e.m. from 5–11 oocytes for each form (two to four batches). C and D, outward and inward rate constants. See text for details of derivation.
 |
(1) |
In eqn (1)V0.5 is the voltage at which half of the charge is moved (that is, the midpoint of the sigmoidal); and σ=kT/qδ represents a slope factor, in which q is the elementary electronic charge, k is the Boltzmann constant, T is the absolute temperature, and δ is the fraction of electrical field over which the charge movement occurs. Fitting the Q–V curves in Fig. 5A to this equation gives, for the various isoforms, the parameters summarized in Table 1.
Table 1.
Boltzman equation parameter
| WT (11) | D341R (5) | R282K (7) | R282D (7) | R282E (7) | R282A (7) | R282Q (7) | |
|---|---|---|---|---|---|---|---|
| V0.5 (mV) | −60.0 ± 1.1 | −113.4 ± 2.2 | −38.3 ± 4.8 | −1.2 ± 1.8 | +1.5 ± 7.1 | +2.9 ± 4.3 | −18.1 ± 6.2 |
| σ (mV) | 29.7 ± 1.4 | 39.3 ± 1.2 | 33.6 ± 2.4 | 34.4 ± 0.8 | 27.5 ± 1.1 | 29.2 ± 2.3 | 28.2 ± 1.8 |
It may be seen that in all arginine 282 mutants the Q–V curves are shifted towards more positive potentials compared to the wild-type, and the time constants are shorter. Conversely, replacement of the negative aspartate 341 with arginine causes a negative shift of both τ–V and Q–V curves together with an increase in the maximal time constant value (Fig. 5A and B).
With the partial exception of the D341R mutant, no strong changes in the slope factor σ can be seen in Table 1, implying that the mutated residues are only marginally (if at all) involved in the charge movement underlying the pre-steady-state currents.
From the τ–V and Q–V curves it is possible to derive (Fesce et al. 2002) the unidirectional rate constants of the charge movement and their voltage dependency, according to the relations:
 |
(2) |
From the data in Fig. 5A and B, the plots of inward rate and outward rate constants for the wild-type and the six functional mutants can be obtained (Fig. 5C and D). These graphs show that, compared to the wild-type, the mutants of R282 exhibit faster inward and slower outward rate, while the opposite occurs in the D341R mutant.
Transport currents
To complete the description of the electrophysiological properties of the charge-pair mutants, we performed experiments to compare the characteristics of the transport-associated current, and their possible correlations to the pre-steady-state currents.
The top row of Fig. 6 shows the records of the isolated transport currents (obtained by subtracting the currents in the absence of substrate from those in the presence of 1 mm Gly–Gln) in four representative oocytes expressing the WT PepT1, the R282D, the R282A, or the D341R mutant, each tested with the usual pulse protocol at external pH 7.5. In the bottom row of Fig. 6 the average I–V curves at four pH values (6.5, 7, 7.5 and 8) are plotted. The graphs are normalized to the current value at −140 mV (pH 7.5) to facilitate the comparison; however, it must be remembered that the currents generated by the D341R mutant were significantly smaller in absolute value (see Fig. 2). In all isoforms, changes in external pH caused shifts in the I–V curves that were in the same directions as for the pre-steady-state current parameters. This observation indicates that the substrate transport activity is still pH-dependent in these three mutants. At potentials more positive than −40 mV, the shape of the relationships shows inward rectification in the wild-type and particularly in the D341R mutant, while it is much more linear in the R282D and R282A forms, which show a very clear reversal and strong outward currents. Indeed reversal of the transport current is seen also in the wild-type transporter at pH 8 (squares in Fig. 6B).
Figure 6. Transport currents in the different isoforms.
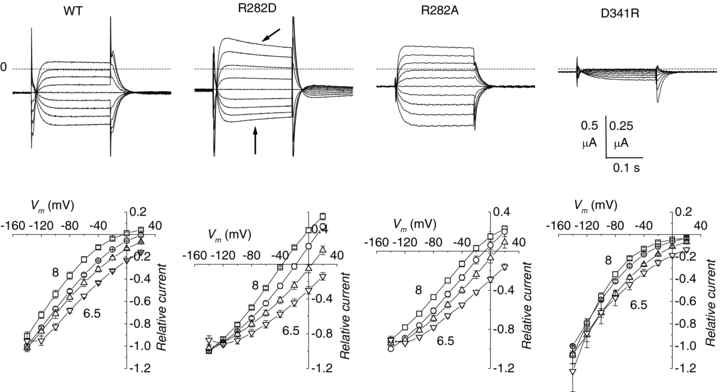
Top row: subtracted traces (1 mm Gly–Gln minus no substrate) at pH 7.5 from four representative oocytes expressing the indicated transporters. The dashed lines indicate the zero current level. Note the slow decay in the current traces exhibited by the R282D and R282A mutants (arrows). Bottom row: I–V curves elicited by 1 mm Gly–Gln in the four isoforms at different external pH values. The data were averaged after normalization for each oocyte to the current value at −140 mV and pH 7.5. Data points are means ±s.e.m. (n= 3–5 oocytes from three batches).
The transport current generated by the R282K mutant was qualitatively similar to that of the wild-type, while the behaviour of the R282E and R282Q mutants was comparable to R282D and R282A, respectively, with evident outward currents and clear shifts in Erev induced by changes in pH and substrate concentration. For the non-conservative arginine mutants, semilog plots of Erevvs. pH were linear (R > 0.98) with slopes between −38.2 (R282D) and −49.6 (R282A) mV per pH unit (Fig. 7A), indicating a substantial contribution of protons to the current. It may be relevant to note that the amplitude of the outward current and the position of the reversal potential are also dependent on the voltage protocol and on the level of expression of the transporters (Kottra et al. 2002; and our unpublished observations).
Figure 7. Reversal potential and affinity.
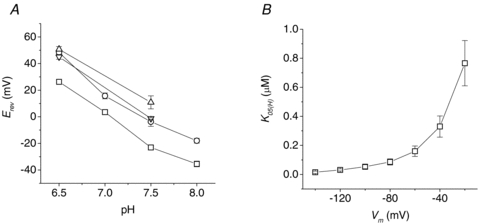
A, pH dependence of reversal potential in the non-conservative arginine mutants (mean values ±s.e.m. from four oocytes for each isoform); the values at pH 6.5 were extrapolated for the R282A, R282Q and R282D forms. B, apparent affinity for protons for the wild-type PepT1, from Michaelis–Menten analysis on the data of Fig. 6.
The estimation of the apparent affinity for external protons is made difficult by the presence of the outward currents (see below). However, limiting the analysis to the wild-type, the proton concentrations eliciting half the maximal current increase with voltage from 15 nm at −120 mV to about 770 nm at −120 mV (Fig. 7B), in qualitative and quantitative agreement with previous determinations (Amasheh et al. 1997; Kottra et al. 2002).
Changing the dipeptide concentration at constant pH produces on the transport currents the effects illustrated in Fig. 8 for the wild-type and the R282D mutant (very similar results were seen in the R282E, R282Q and R282A forms). Higher substrate concentrations applied at pH 7.5 produce an increase in current amplitude that reaches saturation at 1 mm in the wild-type, and shifts the reversal potential towards more positive values in all isoforms. Indeed, at this pH and using lower substrate concentrations, a clear reversal of the current is visible also in the wild-type, confirming previous observations (Verri et al. 2003; Kottra et al. 2009).
Figure 8. Substrate affinity.
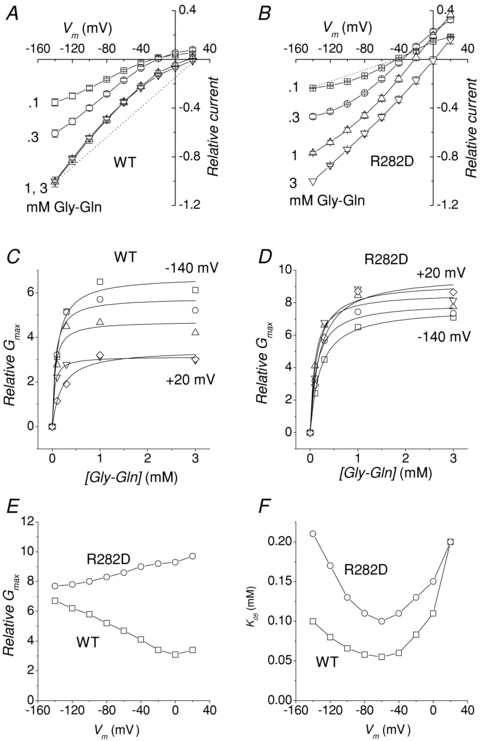
Effects of changing the external Gly–Gln concentration at fixed pH (7.5) in the wild-type (A) and R282D (B) PepT1. Increasing [Gly–Gln] shifts Erev towards more positive values. The data were averaged after normalization for each oocyte to the current value at −140 mV and pH 7.5. Data points are means ±s.e.m. (n= 5 from two batches). The dotted lines joining Erev to the current values at −140 mV in 3 mm Gly–Gln (WT) or 0.1 mm Gly–Gln (R282D) are examples of how the chord conductance is calculated (see text). C and D, dose–conductance curves for the two isoforms. E and F, voltage dependence of the maximal conductance (Gmax) and substrate concentration producing half Gmax (K05) obtained by fitting Michaelis–Menten equations (continuous curves) to the data in C and D (for clarity only the data at −140, −100, −60, −20 and + 20 mV are shown).
The fact that changes in the concentration of a neutral substrate, such as Gly–Gln, are able to affect Erev suggests that the organic substrate is translocated as a complex with the electric charge, confirming that these mutants behave as true cotransporters.
The reversal of the current direction complicates the evaluation of the apparent affinity for the substrate from the usual current–dose plots. An alternative possibility to gain information on the ability of the transporter to interact with the substrate is the use of the chord conductance (G) as an indicator of the level of activity. The chord conductance is defined as (Aidley, 1989):
| (3) |
This quantity is directly proportional to the transport current, but it remains always positive, being divided by the electrochemical gradient. Figure 8C and D plots this quantity against the substrate concentration. Fitting these plots with a Michaelis–Menten equation gives the values of the maximal conductance (Gmax) and of the substrate concentration producing half Gmax (K05G). These graphs are shown in Fig. 7E and F. It may be noted that the different voltage-dependence of Gmax in the two isoforms reflects the opposite curvature of the I–V plots in Fig. 8A and B. Clearly K05G cannot be directly compared to the apparent affinity classically obtained as the substrate concentration producing the half-maximal current (Mackenzie et al. 1996; Kottra & Daniel, 2001). However in the present context the aim of this analysis was to compare the properties of the mutants with those of the wild-type. Figure 8F shows that K05G for the R282D mutant is greater than for the wild-type over most of the voltage range, indicating a lower affinity for the organic substrate.
Charged substrates
PepT1 transporters are known to accept as substrates several di- and tri-peptides possessing different electrical charge, provided the charged amino acid is in the amino-terminus position (Kottra et al. 2002). We therefore tested the behaviour of the charge-pair mutants in the presence of the dipeptides Lys–Gly and Asp–Gly, in addition to Gly–Gln. The results are shown in Fig. 9 for the wild-type and the mutants D341R, R282Q, R282D and R282K. As in the other experiments illustrated above, R282E and R282A behaved quite similarly to R282D and to R282Q, respectively.
Figure 9. Voltage dependence of the transport currents elicited by differently charged dipeptides (all at 1 mm) in the indicated mutants at pH 7.5.
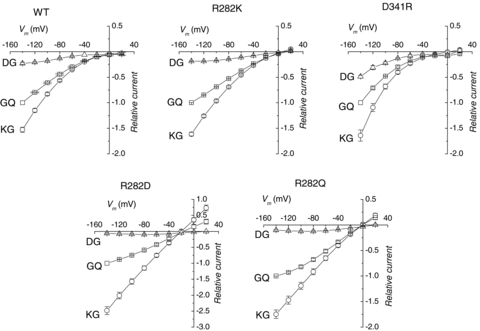
Data are means (after normalization to the current elicited by Gly–Gln at −140 for each oocyte) ±s.e.m. from 5–8 oocytes from at least two batches for each group.
The inward rectifying characteristic of the wild-type, D341R and R282K transporters appears to be independent on the charge carried by the substrate. In all isoforms, Asp–Gly elicits smaller transport currents at this pH (7.5) compared to Gly–Gln. On the contrary the currents produced by Lys–Gly are larger in all cases, reaching amplitudes of about twice or more that of the neutral Gly–Gln in the non-conservative arginine mutants. These results confirm previous observations on the wild-type (Amasheh et al. 1997; Kottra et al. 2002).
The potency order of the substrates remains unchanged in all functional mutants, compared to the wild-type. However, a closer look at the graphs reveals more subtle differences: the degree of reduction (compared to Gly–Gln) of the negatively charged dipeptide is greater in the non-conservative arginine mutants and smaller in the D341R form. Conversely, in these mutants Lys–Gly produces a substantially linear I–V relationship and significant outward currents.
Discussion
In the rabbit transporter PepT1, residues R282 and D341, belonging to transmembrane segments 7 and 8 of the protein, have been suggested to form a charge pair that can break and reform during the transport cycle (Meredith, 2004; Kulkarni et al. 2007; Pieri et al. 2008; Meredith, 2009). These researchers studied a number of mutants in these residues reporting various effects on the transport characteristics. No information, however, has been published to date on the properties of the pre-steady-state currents generated by mutants in these residues. Pre-steady-state currents, measured in the absence of organic substrate, represent signals from the initial steps of the transport cycle, arising from transporter–ion interactions. We have therefore investigated this aspect, trying also to correlate the observations regarding these initial steps with those on the complete transport cycle.
Effects of mutations on the pre-steady-state currents
Single-residue mutations of arginine 282 in lysine, alanine, glutamine, glutamate or aspartate produce functional transporters displaying conspicuous pre-steady-state and transport currents. In contrast, both types of current are strongly reduced in the D341R mutant. Localization experiments show that all these isoforms are present in the oocyte membrane, with the mutants having in many cases significantly larger surface expression than the wild-type. While the correspondence between localization and function is very good for the wild-type, and all the arginine mutants, the lack of correlation for the D341R form suggests that its reduced activity is not due to insufficient targeting but to defects in the molecular mechanism. The other two mutations tested in this work, the double mutant R282D–D341R, aimed to re-establish the charge pair by swapping the sign of the residues, and H57R, did not generate pre-steady or steady transport currents. However, while the latter gave a strong signal in the immunolocalization and SOC experiments, confirming the functional nature of the defect, we were not able to detect the double mutant R282D–D341R in the membrane (Fig. 3), and consequently no transporter-related currents were observed (Fig. 2).
Changes in external pH affected the characteristics of the pre-steady-state currents in all functional mutants (Fig. 4). This observation indicates that mutations deep in the structure of the transporter do not alter the ability to interact with protons even in the absence of organic substrate.
The characteristics of the pre-steady-state currents are changed in opposite ways by the non-conservative mutations on the two different residues: both Q–V and τ–V curves are shifted to the right along the voltage axis in the R282D, R282E, R282Q and R282A forms, and to the left in the D341R form (Fig. 5). Boltzmann analysis of the charge vs. voltage curves reveals only small changes in the slope of the sigmoidal for the arginine mutants. This observation implies the constancy of the equivalent electrical distance δ, and therefore makes it unlikely that the mutated residues could be directly involved in the charge-moving conformational rearrangement. The decrease in δ resulting from the greater slope factor for D341R (Table 1) may reflect a distortion in the protein structure in this mutant, or it may simply represent an overestimate due to the lack of saturation of the Q–V curve in this mutant. However, forcing the slope parameter for D341R to the wild-type value (29.7 mV) in the Boltzmann analysis produced only negligible changes in the unidirectional rate constants.
Derivation of the unidirectional rate constants of the charge movement produces more detailed information: the inward rate (that is the inward rate of movement of a positive charge, or the outward rate of movement of a negative charge) is enhanced when the positive arginine 282 is neutralized to alanine or glutamine, or is replaced by a negative aspartate or glutamate; correspondingly the outward rate is diminished in these mutants with respect to the wild-type. The opposite effect occurs when the negative aspartate 341 is replaced by a positive arginine: in this case the outward rate is enhanced, while the inward rate is depressed.
This behaviour appears consistent with the idea that residues R282 and D341 participate in the generation of a local electrical field over which the voltage-dependent charge movement in the absence of substrate occurs (Fig. 10). Although only the knowledge of the atomic structure will allow making accurate calculations, it is reasonable to think that neutralization of positive arginine or reversal of its charge will generate a negative local potential that will distort the intramembrane potential profile. Conversely, the replacement of a negative aspartate with a positive arginine will alter the potential profile in the opposite (positive) way (Fig. 10Ba). It may be speculated that in this last case the positive electrical field generated by the arginine residue might be so strong that very little charge movement can occur in the experimentally useful voltage range, as observed experimentally.
Figure 10. Schematic representation of the electrostatic fields generated by the pair R282–D341 and their mutations.
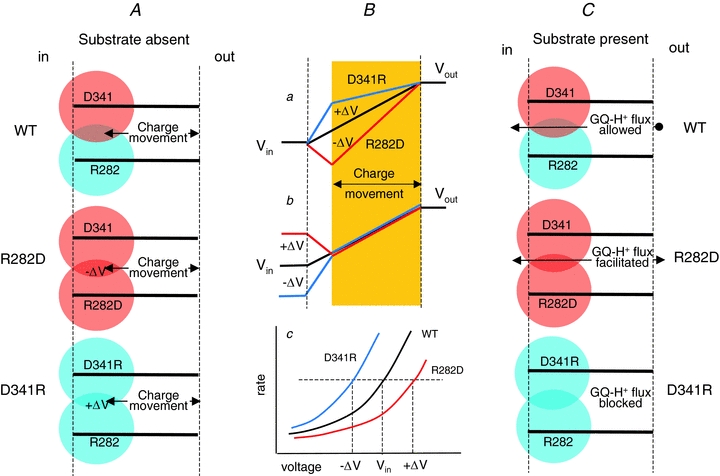
Light red and blue areas represent negative and positive electrical fields, respectively. Left column (A): in the absence of substrate reversal of the positive field generated by R282 (R282D, representative of non-conservative mutations), causes a negative distortion to the membrane potential profile, producing an increase in the field effectively acting on the charge movement (red line in Ba). The opposite mutation D341R adds a positive component to the membrane potential profile causing a decrease in the field effectively acting on the charge movement (blue line in Ba). To reach the same level of electrical field acting on the charge movement (yellow band) the intracellular voltage (Vin) must compensate for these alterations and be set to +ΔV or −ΔV, respectively, for the two mutants (Bb). Consequently the same value of the unidirectional rate constant is obtained at Vin+ΔV, Vin and Vin–ΔV, respectively, for the R282D, WT and D341R isoforms (Bc). Note that the potential profiles are shown as linear only for illustrative purposes. When the substrate is present (right column, C), the replacement of the positive arginine 282 with an aspartate facilitates the movement of the positively charged complex Gly–Gln–H+, to the point that a large current can flow in the outward direction (Figs 6, 7 and 8). On the contrary, replacement of the negative aspartate with an arginine impairs the flow of positive charges, explaining the strong reduction of transport current experimentally observed.
This explanation is analogous to that used to account for the shifting effects of divalent cations or ionic strength on voltage-dependent channels (Hille et al. 1975; Hille, 2001, chapter 20). Referring to the potential profiles shown in Fig. 10Ba, the local potential increase caused by the extra arginine will reduce the electrical field acting on the charge movement by +ΔV (blue line); therefore to obtain the same rate of charge movement as in the wild-type (black profile line), the intracellular potential will have to be moved more negative by ΔV (Fig. 10Bb, blue line). Consequently the voltage dependence of the unidirectional rates will be shifted towards more negative potentials (Fig. 10Bc). The same arguments in the opposite direction can be used to explain the positive shift observed in the non-conservative R282 mutants (Fig. 10B). Considering the exponential nature of the curves, the voltage shift will appear as a change in amplitude at a fixed potential.
The gradation of effects observed experimentally does not exactly correspond to what may be simplistically expected, i.e. that neutral substitutions (R282Q and R282A) should have less effect than charge reverting mutations (R282D and R282E). Indeed R282A appears to have effects lying midway between those of R282D and R282E, while those of R282Q are located between the wild-type and R282D. These observations suggest that the polar vs. non-polar nature of the residues and steric factors may also be important in determining the rates of charge movement.
Transport currents
The amplitudes of the transport-associated currents generated by the addition of organic substrate are in good correlation with the amount of intramembrane charge movement in each isoform: while the non-conservative R282 mutants are able to generate transport currents comparable or even larger than the wild-type, D341R shows much reduced currents.
As shown in Figs 6, 7 and 8, in all isoforms the transport-related currents are affected by changes in external pH and in the concentration of organic substrate. An increase in either one of these two factors cause larger currents and also shifts the curves toward more positive potentials. This effect is particularly evident in the R282 mutants that exhibit a clear reversal of the current direction. In these mutants Erev shifts with the concentration of external protons with a slope between −38 and −49 mV per pH decade (depending on the isoform), which, although less than the value predicted by the Nernst equation, indicates anyway an important role of protons as charge carriers. The change in Erev induced by a different Gly–Gln concentration at constant pH, also observed in these mutants, can only be explained if the translocation of this neutral dipeptide occurs as a complex with an electrical charge, supporting the idea that protons bind to the carboxylic group of the substrate in the translocation process (Kulkarni et al. 2007; Pieri et al. 2008).
The experiments on the transport currents confirm, therefore, that the mutants maintain the essential characteristics of a pH-dependent cotransport system, coupling the translocation of protons and organic substrate, as in the wild-type.
The change in direction of the transport current and shift in Erev with substrate concentration observed in the non-conservative arginine mutants make it difficult to estimate the apparent substrate affinity in the usual way, i.e. by fitting Michaelis–Menten equations to current vs. concentration plots. To obtain an estimate of possible alterations in the substrate affinity in these mutants, we used the chord conductance of the I–V plots (Fig. 8) (Aidley, 1989). According to eqn (3), this quantity is proportional to the current amplitude and is always positive, being divided by the electrochemical gradient (V – Erev). As shown in Fig. 8, the estimate of the substrate concentration producing half the maximal conductance is, in the wild-type, similar to that calculated with the usual methods (our unpublished observations; Mackenzie et al. 1996; Kottra & Daniel, 2001). The values of K05G for the R282D mutants, calculated in the same way, show a reduction of about 50% of the apparent affinity compared to the wild-type.
All functional mutants are able to transport charged dipeptides as well. The results shown in Fig. 9 confirm previous observations (Kottra et al. 2002; Amasheh et al. 1997) concerning the wild-type that showed variable charge/molar ratios depending on the charge of the dipeptide and on the external pH. Therefore the small currents elicited by Asp–Gly (in contrast to the larger ones produced by Lys–Gly) can be attributed to the high percentage of the side chains bearing a negative charge at this pH (7.5). The different shape of the I–V curves (rectifying vs. linear) appears to be isoform dependent (and substrate independent), suggesting that the translocation mechanism is determined by the structure of the transporter, and not by the nature of the substrate. The relatively stronger increase (compared to the wild-type) observed in the current generated by Lys–Gly in the non-conservative arginine mutants indicates that in addition to the greater charge/mole ratio an increase in turnover rate may have occurred, possibly due to a faster release rate of a more strongly charged substrate complex towards the cytoplasm.
R282 and D341 represent the gates of the transport cycle
The idea that the transport cycle of PepT1 could be gated by these two residues was put forward by Kulkarni et al. (2007) who proposed a cyclic breaking and reconstitution of the ionic interaction. The electrophysiological characterization of the six functional mutants, described above, gives support to this hypothesis. The shifts along the voltage axis of the charge movement parameters shown in Fig. 5 may be explained as due to alterations in the intramembrane electrical field caused by the differently charged mutants with a likely contribution of steric effects, as mentioned above (see for example the difference between the R282A and R282Q mutants).
The different amplitude and voltage dependence of the transport current in the mutants are also relevant in this respect. With the exception of the conservative R282K mutation, all other functional mutations disrupt the charge pair; however, they do so in different ways. In the non-conservative arginine mutations an excess negative charge is produced: although the details of the local conformational rearrangement of the mutated protein are unknown, it is conceivable that the passage of positively charged substrates, such as the Gly–Gln–H+ complex might be favoured in these cases (see Fig. 10).
As shown in Results, the symmetrical mutation on the other residue of the pair, that is D341R, showed much reduced pre-steady-state and transport currents. In contrast its expression on the plasma membrane of the oocytes was comparable with the other fully functional isoforms (Fig. 3). The schematic representation of Fig. 10 suggests that in this case the presence of the positive charge of the arginine may produce an additional positive electrical field preventing protons from reaching the appropriate site to form a complex with the substrate.
The experiments using charged dipeptides confirmed the efficiency order observed for the wild-type transporter at pH 7.5 (Asp–Gly < Gly–Gln < Lys–Gly) with only small relative variations in all tested mutants. This observation suggests that the mutations in the charge-pair residues affect mainly the proton interaction rather than substrate binding and translocation.
Acknowledgments
Many thanks are due to Dr Ayodele Oyadeyi for participating in some of the experiments and to Dr Stefano Giovannardi for skilled technical assistance. The immunohistochemistry was done with the precious help of Dr Annalisa Grimaldi. This work was supported by the University of Insubria Research Fund.
Glossary
Abbreviations
- SLC15
solute carrier family 15
- SOC
single oocyte chemiluminescence
- TEVC
two-electrode voltage-clamp
Authors contributions
E.B.: conception and design, analysis and interpretation of data, critical revision of the manuscript. M.D.R.: execution, analysis and interpretation of data, critical revision of the manuscript. R.S.: execution, analysis and interpretation of data, critical revision of the manuscript. F.D.: execution, analysis and interpretation of data, critical revision of the manuscript. F.C.: execution, analysis and interpretation of data, critical revision of the manuscript. G.K.: conception and design, critical revision of the manuscript. A.P.: conception and design, analysis and interpretation of data, drafting and critical revision of the manuscript. All authors approved the final version of the manuscript for publication. The experiments were done in The Laboratory of Cellular and Molecular Physiology-DBSM-University of Insubria Varese.
References
- Aidley DJ. The Physiology of Excitable Cells. 3rd edn. Cambridge: Cambridge University Press; 1989. [Google Scholar]
- Amasheh S, Wenzel U, Boll M, Dorn D, Weber W-M, Clauss W, Daniel H. Transport of charged dipeptides by the intestinal H+/peptide symporter PepT1 expressed in Xenopus laevis oocytes. J Membr Biol. 1997;155:247–256. doi: 10.1007/s002329900177. [DOI] [PubMed] [Google Scholar]
- Bolger MB, Haworth IS, Yeung AK, Ann D, Von Grafenstein H, Hamm-Alvarez S, Okamoto CT, Kim K-J, Basu SK, Wu S, Lee VHL. Structure, function and molecular modeling approaches to the study of the intestinal dipeptide transporter PepT1. J Pharmacol Sci. 1998;87:1286–1291. doi: 10.1021/js980090u. [DOI] [PubMed] [Google Scholar]
- Bossi E, Fabbrini MS, Ceriotti A. Exogenous protein expression in Xenopus laevis oocyte, basic procedure. In: Grandi G, editor. In Vitro Transcription and Translation Protocols. Totowa, NJ: Humana Press; 2007. pp. 107–131. [Google Scholar]
- Chen H, Pan Y, Wong EA, Bloomquist JR, Webb KE., Jr Molecular cloning and functional expression of a chicken intestinal peptide transporter (cPepT1) in Xenopus oocytes and chinese hamster ovary cells. J Nutr. 2002;132:387–393. doi: 10.1093/jn/132.3.387. [DOI] [PubMed] [Google Scholar]
- Chen X-Z, Steel A, Hediger MA. Functional roles of histidine and tyrosine residues in the H+-peptide transporter PepT1. Biochem Biophys Res Commun. 2000;272:726–730. doi: 10.1006/bbrc.2000.2851. [DOI] [PubMed] [Google Scholar]
- Daniel H, Kottra G. The proton oligopeptide cotransporter family SLC15 in physiology and pharmacology. Pflugers Arch. 2004;447:610–618. doi: 10.1007/s00424-003-1101-4. [DOI] [PubMed] [Google Scholar]
- Daniel H, Spanier B, Kottra G, Weitz D. From bacteria to man: Archaic proton-dependent peptide transporters at work. Physiology. 2006;21:93–102. doi: 10.1152/physiol.00054.2005. [DOI] [PubMed] [Google Scholar]
- Fei Y-J, Kanai Y, Nussberger S, Ganapathy V, Leibach FH, Romero MF, Singh SK, Boron WF, Hediger MA. Expression cloning of a mammalian proton-coupled oligopeptide transporter. Nature. 1994;368:563–566. doi: 10.1038/368563a0. [DOI] [PubMed] [Google Scholar]
- Fei Y-J, Liu W, Prasad PD, Kekuda R, Oblak TG, Ganapathy V, Leibach FH. Identification of the histidyl residue obligatory for the catalytic activity of the human H+/peptide cotransporters PEPT1 and PEPT2. Biochemistry. 1997;36:452–460. doi: 10.1021/bi962058p. [DOI] [PubMed] [Google Scholar]
- Fesce R, Giovannardi S, Binda F, Bossi E, Peres A. The relation between charge movement and transport-associated currents in the GABA cotransporter rGAT1. J Physiol. 2002;545:739–750. doi: 10.1113/jphysiol.2002.026823. [DOI] [PMC free article] [PubMed] [Google Scholar]
- Hille B. Ionic Channels of Excitable Membranes. 3rd edn. Sunderland, MA, USA: Sinauer Associates; 2001. [Google Scholar]
- Hille B, Woodhull AM, Shapiro BI. Negative surface charge near sodium channels of nerve: divalent ions, monovalent ions and pH. Philos Trans R Soc B Biol Sci. 1975;270:301–318. doi: 10.1098/rstb.1975.0011. [DOI] [PubMed] [Google Scholar]
- Kottra G, Daniel H. Bidirectional electrogenic transport of peptides by the proton-coupled carrier PEPT1 in Xenopus laevis oocytes: its asymmetry and symmetry. J Physiol. 2001;536:495–503. doi: 10.1111/j.1469-7793.2001.0495c.xd. [DOI] [PMC free article] [PubMed] [Google Scholar]
- Kottra G, Frey I, Daniel H. Inhibition of intracellular dipeptide hydrolysis uncovers large outward transport currents of the peptide transporter PEPT1 in Xenopus oocytes. Pflugers Arch. 2009;457:809–820. doi: 10.1007/s00424-008-0562-x. [DOI] [PubMed] [Google Scholar]
- Kottra G, Stamfort A, Daniel H. PEPT1 as a paradigm for membrane carriers that mediate electrogenic bidirectional transport of anionic, cationic, and neutral substrates. J Biol Chem. 2002;277:32683–32691. doi: 10.1074/jbc.M204192200. [DOI] [PubMed] [Google Scholar]
- Kulkarni AA, Davies DL, Links JS, Patel LN, Lee VHL, Haworth IS. A charge pair interaction between Arg282 in transmembrane segment 7 and Asp341 in transmembrane segment 8 of hPepT1. Pharmaceut Res. 2007;24:66–72. doi: 10.1007/s11095-006-9119-x. [DOI] [PubMed] [Google Scholar]
- Mackenzie B, Loo DDF, Fei Y-J, Liu W, Ganapathy V, Leibach FH, Wright EM. Mechanisms of the human intestinal H1-coupled oligopeptide transporter hPEPT1. J Biol Chem. 1996;271:5430–5437. doi: 10.1074/jbc.271.10.5430. [DOI] [PubMed] [Google Scholar]
- McAlear SD, Liu X, Williams JB, McNicholas-Bevensee CM, Bevensee MO. Electrogenic Na/HCO3 cotransporter (NBCe1) variants expressed in Xenopus oocytes: functional comparison and roles of the amino and carboxy termini. J Gen Physiol. 2006;127:639–658. doi: 10.1085/jgp.200609520. [DOI] [PMC free article] [PubMed] [Google Scholar]
- Meredith D. Site-directed mutation of arginine 282 to glutamate uncouples the movement of peptides and protons by the rabbit proton-peptide cotransporter PepT1. J Biol Chem. 2004;279:15795–15798. doi: 10.1074/jbc.M313922200. [DOI] [PubMed] [Google Scholar]
- Meredith D. The mammalian proton-coupled peptide cotransporter PepT1: sitting on the transporter-channel fence? Philos Trans R Soc B Biol Sci. 2009;364:203–207. doi: 10.1098/rstb.2008.0139. [DOI] [PMC free article] [PubMed] [Google Scholar]
- Meredith D, Price RA. Molecular modeling of PepT1: Towards a structure. J Membr Biol. 2006;213:79–88. doi: 10.1007/s00232-006-0876-6. [DOI] [PubMed] [Google Scholar]
- Mertl M, Daniel H, Kottra G. Substrate-induced changes in the density of peptide transporter PEPT1 expressed in Xenopus oocytes. Am J Physiol Cell Physiol. 2008;295:1332–1343. doi: 10.1152/ajpcell.00241.2008. [DOI] [PubMed] [Google Scholar]
- Nussberger S, Steel A, Trotti D, Romero MF, Boron WF, Hediger MA. Symmetry of H+ binding to the intra- and extracellular side of the H+-coupled oligopeptide cotransporter PepT1. J Biol Chem. 1997;272:7777–7785. doi: 10.1074/jbc.272.12.7777. [DOI] [PubMed] [Google Scholar]
- Peres A, Giovannardi S, Bossi E, Fesce R. Electrophysiological insights on the mechanism of ion-coupled cotransporters. News Physiol Sci. 2004;19:80–84. doi: 10.1152/nips.01504.2003. [DOI] [PubMed] [Google Scholar]
- Pieri M, Gan C, Bailey P, Meredith D. The transmembrane tyrosines Y56, Y91 and Y167 play important roles in determining the affinity and transport rate of the rabbit proton-coupled peptide transporter PepT1. Int J Biochem Cell Biol. 2009;41:2204–2213. doi: 10.1016/j.biocel.2009.04.014. [DOI] [PMC free article] [PubMed] [Google Scholar]
- Pieri M, Hall D, Price R, Bailey P, Meredith D. Site-directed mutagenesis of Arginine282 suggests how protons and peptides are co-transported by rabbit PepT1. Int J Biochem Cell Biol. 2008;40:721–730. doi: 10.1016/j.biocel.2007.10.010. [DOI] [PMC free article] [PubMed] [Google Scholar]
- Rauh R, Diakov A, Tzschoppe A, Korbmacher J, Azad AK, Cuppens H, Cassiman J-J, Dötsch J, Sticht H, Korbmacher C. A mutation of the epithelial sodium channel associated with atypical cystic fibrosis increases channel open probability and reduces Na+ self inhibition. J Physiol. 2010;588:1211–1225. doi: 10.1113/jphysiol.2009.180224. [DOI] [PMC free article] [PubMed] [Google Scholar]
- Renna MD, Sangaletti R, Bossi E, Cherubino F, Kottra G, Peres A. Unified modeling of the mammalian and fish proton-dependent oligopeptide transporter PepT1. Channels. 2010 doi: 10.4161/chan.5.1.13505. in press. [DOI] [PubMed] [Google Scholar]
- Saito H, Okuda M, Terada T, Sasaki S, Inui K. Cloning and characterization of a rat H+/peptide cotransporter mediating absorption of β-lactam antibiotics in the intestine and kidney. J Pharmacol Exp Ther. 1995;275:1631–1637. [PubMed] [Google Scholar]
- Sala-Rabanal M, Loo DDF, Hirayama BA, Turk E, Wright EM. Molecular interactions between dipeptides, drugs and the human intestinal H+/oligopeptide cotransporter, hPEPT1. J Physiol. 2006;574:149–166. doi: 10.1113/jphysiol.2006.107904. [DOI] [PMC free article] [PubMed] [Google Scholar]
- Sangaletti R, Terova G, Peres A, Bossi E, Corà S, Saroglia M. Functional expression of the oligopeptide transporter PepT1 from the sea bass Dicentrachus labrax. Pflugers Arch. 2009;459:47–54. doi: 10.1007/s00424-009-0700-0. [DOI] [PubMed] [Google Scholar]
- Steel A, Nussberger S, Romero MF, Boron WF, Boyd CA, Hediger MA. Stoichiometry and pH dependence of the rabbit proton-dependent oligopeptide transporter PepT1. J Physiol. 1997;498:563–569. doi: 10.1113/jphysiol.1997.sp021883. [DOI] [PMC free article] [PubMed] [Google Scholar]
- Uchiyama T, Kulkarni AA, Davies DL, Lee VHL. Biophysical evidence for His57 as a proton-binding site in the mammalian intestinal transporter hPepT1. Pharmaceut Res. 2003;20:1911–1916. doi: 10.1023/b:pham.0000008036.05892.e9. [DOI] [PubMed] [Google Scholar]
- Verri T, Kottra G, Romano A, Tiso N, Peric M, Maffia M, Boll M, Argenton F, Daniel H, Storelli C. Molecular and functional characterization of the zebrafish (Danio rerio) PEPT1-type peptide transporter. FEBS Lett. 2003;549:115–122. doi: 10.1016/s0014-5793(03)00759-2. [DOI] [PubMed] [Google Scholar]
- Zerangue N, Schwappach B, Jan YN, Jan LY. A new ER trafficking signal regulates the subunit stoichiometry of plasma membrane KATP channels. Neuron. 1999;22:537–548. doi: 10.1016/s0896-6273(00)80708-4. [DOI] [PubMed] [Google Scholar]


