

Abstract
The availability of knock-in mutant mouse models for channelopathies of skeletal muscle has generated the need for improved methods to record ionic currents under voltage clamp in fully differentiated adult muscle fibres. A two-electrode voltage clamp has been optimized for recording Na+ currents in small fibres dissociated from the footpad. Clamp speed and spatial homogeneity were achieved by using short fibres (<600 μm) that were detubulated with hyperosmolar glycerol. Series resistance errors were reduced by limiting current amplitude with low [Na+]. The quality of the voltage clamp was explored with computer simulations of a finite cable model with active conductances. Simulations quantitatively defined the range of conditions for which clamp control can be maintained, and provided estimates for the errors in the determination of gating parameters from standard pulse protocols. Sodium currents recorded from short fast-twitch muscles revealed a hyperpolarized shift in the voltage dependence of activation (V1/2−52 mV) and fast inactivation (V1/2−88 mV) compared to expression studies of NaV1.4 in mammalian cell lines. Slow inactivation occurred at depolarized potentials (V1/2−69 mV) relative to fast inactivation. These data reveal a marked divergence in the voltage dependence of fast and slow inactivation and provide normative values of Na+ channel behaviour for mouse skeletal muscle that will serve as a reference for the investigation of muscle ion channelopathies using genetically engineered mice or computer simulation.
Non-technical summary
Muscle contraction is triggered by the spread of an action potential along the fibre. The ionic current to generate the action potential is conducted through voltage-activated sodium channels, and mutations of these channels are known to cause several human muscle disorders. Mouse models have been created by introducing point mutations into the sodium channel gene. This achievement has created the need for a high-fidelity technique to record sodium currents from intact mouse muscle fibres. We have optimized a two-electrode voltage clamp, using sharp microelectrodes to preserve the myoplasmic contents. The voltage-dependent behaviour of sodium channel activation, inactivation and slow-inactivation were characterized. The voltage range for these gating behaviours was remarkably hyperpolarized, in comparison to studies in artificial expression systems. These results provide normative data for sodium channels natively expressed in mouse muscle and illustrate the need to modify model simulations of muscle excitability to account for the hyperpolarized shift.
Introduction
The characterization of voltage-gated conductances in excitable membranes began in the classical era with microelectrode studies in acutely dissociated preparations and then later shifted to expression systems wherein a relatively pure population of channels can be studied with excellent voltage-clamp control. A resurgence of the classical approach has emerged with the recognition of the importance of cellular context for the regulation and modulation of channel activity and to study the functional impact of disease-associated mutations in ion channel genes in a more biologically relevant environment. The present study to characterize Na+ currents in fully differentiated intact fibres of adult mouse skeletal muscle was motivated by the availability of knock-in mutant mouse models for periodic paralysis based on missense mutations in NaV1.4 (Hayward et al. 2008). The functional analysis of these disease models requires high-fidelity voltage-clamp studies, as the gating defects of mutant channels are known to be modest (Cannon, 2006) since more severe defects would probably be lethal.
Over the past 40 years, several voltage-clamp techniques have been developed to study voltage-gated conductances in isolated skeletal muscle fibres (Adrian et al. 1970; Hille & Campbell, 1976; Poindessault et al. 1976; Beam & Knudson, 1988). The technical challenges are the large surface area, elongated cylindrical geometry and transverse tubular network, which impede the clamp speed and space clamp, as well as the fast kinetics and high current density of the Na+ conductance, with the attendant ‘escape’ of voltage control from series resistance limitations. Gap techniques initially developed with isolated amphibian fibres were difficult to perform on the more friable mammalian fibres, and consequently studies on mammalian fibres were still commonly performed with the three-electrode clamp (Lehmann-Horn et al. 1981; Ruff, 1999), although Adrian and Marshall commented, ‘It is probably not adequate for detailed kinetic study of rapidly changing conductances’ (Adrian & Marshall, 1977). Tight-seal patch recordings have been made from enzyme-treated fibres (Chua & Betz, 1991) or mechanically disrupted membrane blebs (Stein & Palade, 1989). These methods did not become commonplace, however, as tight-seal formation with the patch electrode was difficult in differentiated muscle fibres due to the extensive extracellular matrix. As a result, most patch-clamp studies of skeletal muscle have been performed in cultured myotubes. The loose-patch recording technique is an alternative approach that does not require enzyme treatment and has a success rate high enough for studies in scarce material such as human biopsies (Almers et al. 1984). The recent focus on mouse skeletal muscle has led to a resurgence of whole-cell voltage-clamp techniques for recording currents in short fibres dissociated from small muscles of the foot or toe (Beam & Knudson, 1988; Wang et al. 1999; Lueck et al. 2007).
In this study, we have optimized a two-electrode voltage clamp that uses sharp microelectrodes to preserve myoplasmic contents for recording Na+ currents in dissociated fast twitch fibres from the footpad. The selection of short fibres (<600 μm) and detubulation by hyperosmolar shock limited the capacitance to ∼2 nF and enabled rapid clamp settling times <100 μs. Reduced external [Na+] was used to limit the peak ionic current amplitude to <150 nA so that voltage control was maintained during the rapid activation of the Na+ conductance. To explore the quality of voltage-clamp control, we performed computer simulations with a finite-length cable model that incorporated a non-linear voltage-gated Na+ conductance. Parameter sensitivity studies quantitatively define the range of clamp speed, fibre size and Na+ current amplitudes that can be accommodated and still maintain voltage control. Simulations with commonly used experimental pulse protocols demonstrate the effects of voltage-clamp errors on the estimates of Na+ channel gating parameters. We experimentally recorded the gating behaviour of Na+ currents in fast-twitch fibres from two mouse lines commonly used in transgenic studies: C57Bl/6 and 129-E. Unexpectedly, the voltage dependence of activation and fast inactivation were hyperpolarized by more than 20 mV in comparison to expression studies of NaV1.4 in HEK cells. Based on the extensive set of simulations for a model fibre, we are confident this left shift is not an artifact from poor clamp control. The gating behaviour in our two-electrode voltage clamp (TEV) recordings is similar to that observed from early studies with cut fibre preparations and emphasises the importance of the muscle environment in the regulation of channel activity. We also extended the classical studies by measuring slow inactivation properties, which revealed a 20 mV depolarized shift of slow compared to fast inactivation that was not previously appreciated in HEK cell studies.
Methods
Muscle fibre preparation
Individual muscle fibres were isolated by enzymatic digestion and mechanical disruption of intrinsic muscles from the hindfoot (flexor digitorum brevis, lumbricales which are 90% fast-twitch oxidative–glycolytic type IIa fibres; Carlsen et al. 1985) of adult mice, aged 2–6 months. Animals were killed by isoflurane inhalation and cervical dislocation, in accordance with our Institutional Animal Care and Use Committee, and The Journal of Physiology guidelines for the ethical treatment of animals. The muscles were rapidly dissected and placed in DMEM plus collagenase (Gibco, 1 g ml−1), supplemented with 1.8 mm Ca2+ and agitated on a shaker at 37°C for 90 min. Fibres were dissociated by trituration in a wide-bore pipette, pelleted by centrifugation, and resuspended in DMEM plus 10% fetal bovine serum, 1% glutamine, 100 U ml−1 penicillin–streptomycin and 10 mm Hepes. Approximately 100 fibres were plated in 35 mm plastic dishes coated with rat collagen and matrigel (BD Biosciences, San Jose, CA, USA). Cultures were maintained for 1 to 3 days in 5% CO2 at 37°C.
Sodium channel isoform expression
A competitive RT-PCR assay was used to estimate the relative expression level of NaV1.4 and NaV1.5 in dissociated muscle fibres. Approximately 50 fibres were collected at three time points: acutely, 24 h and 48 h after dissociation. The fibres were rinsed in PBS, and RNA was prepared with the TRIzol reagent (Life Technologies, Carlsbad, CA, USA). Reverse transcription was performed using a mix of poly-A-anchored oligonucleotides and Superscript III (Life Technologies). Primers were designed to allow for simultaneous amplification of both NaV1.4 and NaV1.5 cDNAs in a single reaction. The sense and antisense primers used for competitive RT-PCR were GCCTTCGAGGACATCTAC and AAGAAGGAGCCGAAGATG. An NaV1.5-specific restriction digest (KpnI) yields 561 bp and 152 bp fragments from the original amplicon (713 bp), whereas the NaV1.4 fragment remained undigested at 710 bp.
Voltage-clamp recording
Currents were recorded with a two-electrode voltage clamp, using an AxoClamp2B amplifier (Molecular Devices, Sunnyvale, CA, USA) with the HS-2A headstage. Fibres were visualized on an inverted microscope (IMT-2 Olympus, Center Valley, PA, USA) with Hoffman optics. Disruption of the T-tubule system from the sarcolemma was achieved by hyperosmolar shock in DMEM plus 400 mm glycerol for 1 h, and the fibres were then returned to isosmolar recording solution (Dulhunty & Gage, 1973). Isolated fibres adherent to the collagen–matrigel-coated dish and <600 μm in length were selected for recording by impalement near their midpoint with both stimulating and recording sharp microelectrodes. The standard bath was a Cl−-free low-Na+ solution containing: NaOH 10 mm, TEAOH 130 mm, Mg(OH)2 1 mm, Ca(OH)2 1 mm, Hepes 10 mm, glucose 10 mm, 4-aminopyridine (4-AP) 5 mm, anthracene-9-carboxylate (9-AC) 100 μm, nifedipine 5 μm, pH adjusted to 7.4 with methanesulfonic acid. Dantrolene (3 μg ml−1) and the skeletal muscle myosin II inhibitor BTS (20 μm) (Cheung et al. 2002) were added to suppress depolarization-induced contraction in studies on fibres with intact T-tubules. The current injection pipette was filled with 2 m caesium aspartate (resistance of 3–7 MΩ) and the voltage-sensing electrode contained 3 m CsCl (resistance 10–15 MΩ). All measurements were performed at room temperature.
Voltage-clamp control, current recording and analysis of traces were performed using pClamp 9.0. Sodium currents were elicited by step depolarizations from a holding potential of −100 mV. Linear leak subtraction was performed by using P/8 subtraction, except where noted in the Results.
Measured values are presented as the mean ± standard error of the mean (s.e.m.) unless otherwise noted. Gating properties of Na+ currents recorded from mouse fibres are compared graphically to behaviour typical for heterologous expression of NaV1.4 plus β1 subunits co-expressed in HEK cells by reproducing fitted responses from the parameters reported in prior studies from our laboratory (Hayward et al. 1997; Takahashi & Cannon, 1999; Wu et al. 2005; Webb et al. 2009) and others (Bouhours et al. 2004; Carle et al. 2006).
Model simulation
A finite-length cable model (Hodgkin & Rushton, 1946) was used to simulate the spatio-temporal voltage response, V(x, t) of a short muscle fibre of length l, voltage clamped at the midpoint (x= 0). The model does not include a radial component because fibres in this study were detubulated. The passive linear cable model was modified to replace the Ohmic term that represents the transmembrane ionic current per unit length, V(x, t)/rm, by the sum of the ionic currents, Iionicj, contributed by the sarcolemmal conductances (Moore et al. 1975).
 |
(1) |
where cm is the capacitance (μF cm−1) and ri is the internal resistance (Ω cm−1) per length. The fibre dimensions were modelled as l= 450 μm and radius of a= 28 μm, which represent the mean values for the population for fibres selected for study. With this fibre radius, and a specific capacitance of 1.0 μF cm−2 and specific internal resistance of 150 Ω cm, the parameters for the cylindrical representation per unit length in eqn (1) are cm= 18 nF cm−1 and ri= 6.1 MΩ cm−1. Under the recording conditions used herein to block K+, Ca2+ and Cl− currents, the ionic conductances were modelled as the sum of an Ohmic leak conductance plus a voltage-gated Na+ conductance simulated with the Hodgkin–Huxley model (Hodgkin & Huxley, 1952).
| (2) |
The equations to simulate m and h kinetics, and the parameter estimates based on recordings from mouse fibres are presented in the online Supplement 1. The muscle fibre was considered to be sealed at the ends, which sets the boundary condition ∂V(x,t)/∂x= 0 at x=± l/2. The voltage-clamp condition was applied at the centre of the fibre, x= 0, and step voltage commands, V(0,t), were simulated by one- or two-component exponentials. Numerical integration was performed over half the fibre length, 0 < x < l/2, since the fibre was symmetrical about the point at which the command voltage was applied (x= 0). The axial current at x= 0 that is flowing toward x > 0 represents half of the total current passed by the current electrode (ionic and capacitive currents in the membrane, Imem) was computed as:
 |
(3) |
The total sodium current conducted over the entire length of the fibre, INa(t), was computed as:
| (4) |
Solutions to the non-linear finite-cable equation were computed with Mathematica 7.0 (Wolfram Research, Champaign, IL, USA).
Results
Passive properties of fibres
Muscle fibres varied in length from 350 μm to more than 600 μm. We selected fibres <600 μm, as measured optically with a reticle, and the group in this study had a mean length of 455 ± 9 μm and a diameter of 56 ± 1 μm, n= 35 (Fig. 1A). Osmotic shock with 400 mm glycerol was effective in detubulating fibres, as demonstrated by an acceleration of the capacitance transient elicited by a 10 mV depolarization from a holding potential of −100 mV (Fig. 1B). The apparent specific capacitance, defined as Capp= (Q/ΔV)/(2πal) decreased from 4.3 ± 0.2 μF cm−2 in control fibres to 2.1 ± 0.1 μF cm−2 after detubulation. With our recording conditions to isolate Na+ currents (TEA, 4-AP to block K+ currents, nifedipine to block L-type Ca2+ current), the steady-state I–V relation measured by TEV clamp applied at the centre of the fibre was linear with a slope conductance of 350 ± 5 nS nF−1, n= 23 (1.5 mS cm−2), and decreased to 46 ± 0.9 nS nF−1, n= 30 (0.097 mS cm−2) with removal of Cl− (Fig. 1C). Alternatively stated, the average input resistance, Rin, was 11 MΩ for the detubulated, chloride-free condition.
Figure 1. Passive properties of mouse muscle fibres.
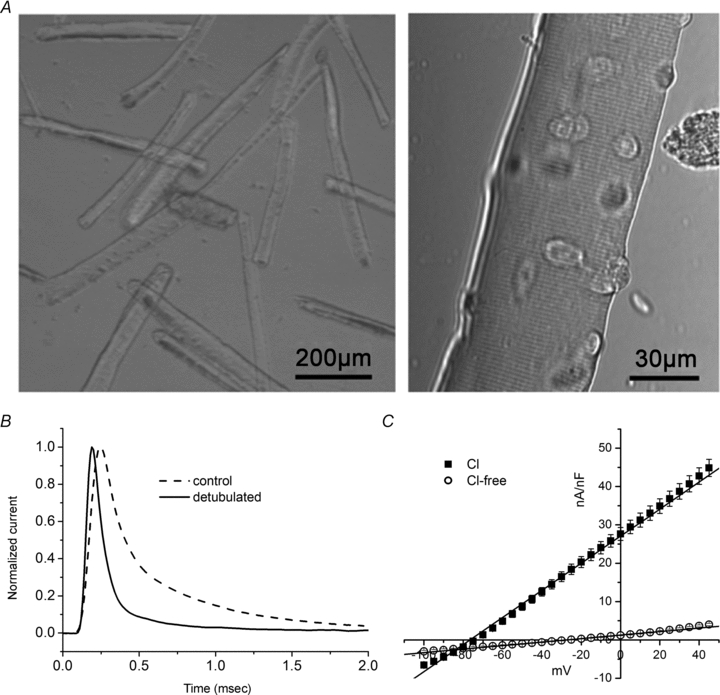
A, photomicrograph of dissociated fibres viewed at low magnification with phase contrast to show fibre length/width ratio (left) and at higher magnification with DIC optics (right) to show fibre integrity. B, membrane currents elicited by a depolarization of 10 mV from −100 mV are normalized to peak amplitude and superimposed to illustrate the reduction in apparent capacitance by detubulation. Peak currents were 83 nA and 81 nA for control and detubulated fibres, respectively, with associated capacitances of 3.5 nF and 1.6 nF. C, average steady-state current–voltage relation for detubulated fibres, normalized by fibre capacitance, was linear with a slope conductance of 350 ± 5 nS nF−1, n= 23, that decreased to 46 ± 0.9 nS nF−1, n= 30, in Cl−-free bath.
At voltages <−65 mV for which Na+ channels are not activated, the length constant, λ, can be computed from the measured Rin and fibre dimensions by application of the closed-form solution to the linear finite-length cable model:
| (5) |
Assuming a myoplasmic specific resistance of Ri= 150 Ω cm, and with a fibre length of 450 μm and radius of 28 μm, the computed length constant is λ= 0.28 cm. The corresponding specific conductance is Gleak=a/(2λ2Ri) = 120 ± 8 μS cm−2. Thus, in Cl−-free conditions with K+ and Ca2+ channels blocked, the muscle fibres are in the order of 0.16λ in length. When a Cl−-containing bath solution was used, Rin≈ 1.7 MΩ which equates to λ= 0.11 cm or a fibre length of 0.4λ and a specific conductance of 790 ± 51 μS cm−2. This relatively small change in λ implies the chloride conductance is not predicted to degrade the spatial control of the clamp potential in these short fibres. For example, even in a Cl− bath, the steady-state voltage change at the end of a 450 μm fibre will reach 96.8% of the value imposed at the midpoint.
Constraints on clamp speed
Rapid depolarization of the membrane in a near step-like fashion is essential to accurately characterize the gating properties of voltage-gated Na+ channels (Campbell & Hille, 1976; Ruben et al. 1997). The voltage response at x= 0, measured for a typical fibre under TEV clamp, is shown in Fig. 2A. A bi-exponential fit had time constants of 18 μs (76%) and 190 μs (24%). The computed delay and attenuation of the voltage transients at l/4 and l/2 (end) in response to a voltage clamp applied at x= 0 for a 450 μm fibre in a Cl−-free bath are shown in Fig. 2B, which demonstrates that very little distortion of the clamp potential is predicted over these fibres. As a worst case scenario, the computed response is also shown for a fibre of length 600 μm, the upper limit of our exclusion criteria (Fig. 2B, dashed lines).
Figure 2. Fibre effects on voltage-clamp speed.
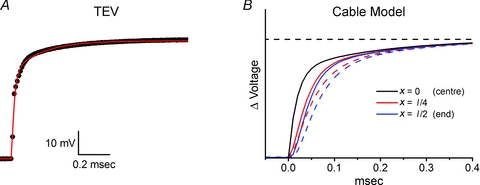
Attenuation and delay of voltage clamp due to the leak conductance is shown for a typical fibre in Cl−-free bath (Gleak= 120 μS cm−2; GNa= 0). A, voltage transient recorded at x= 0 for a 50 mV step voltage command. Red line shows a double exponential fit with τfast= 0.018 ms (76%) and τslow= 0.19 ms (24%). B, computed voltage-clamp transient (eqn (1)) midway out to the end of the fibre (red line, x=l/4) and at the end of the fibre (blue line, x=l/2) using the double-exponential fit for voltage clamp at x= 0 as the input for a 450 μm fibre. Dashed lines show the respective transients computed for a 600 μm fibre.
Another method to characterize the clamp speed of a muscle fibre is to consider the hypothetical scenario of a very fast clamp at x= 0, and then determine the effective clamp time constant by fitting the simulated voltage transient at different locations along the fibre. In simulations with a rapid single-exponential clamp (10 μs) applied at x= 0, the voltage transients at l/4 and l/2 were fitted well by a single exponential. As the fibre length was relatively short (<0.5λ), the time constants for the membrane voltage transients were nearly equal at l/4 and l/2 (∼4% difference). For a simulated fibre of 450 μm, the time constant was 25 μs. When the fibre length was increased to the maximum allowable size of 600 μm, the time constant increased to 40 μs. The implication of this simulation is that no matter how well a fibre is clamped for a step input command at x= 0, the passive cable properties impose a low-pass filter that results in voltage transients having time constants with a minimum of 25–40 μs for fibres of 450–600 μm in length. One caveat is that this analysis does not take into account the dramatic reduction of Rin (shorter λ) that occurs when Na+ channels are activated by larger depolarizations (see below).
Voltage-clamp control is not possible in physiological Na+
While the cable model predicts accurate voltage clamping of short fibres is possible for the background leakage conductance, TEV recordings showed pronounced series-resistance (Rs) errors when large Na+ currents were elicited by depolarization in physiological saline (145 mm). Figure 3A shows the characteristic features of an Rs error with a delayed acceleration of high-amplitude Na+ currents for moderate depolarization (−70 to −10 mV) plus the obvious loss of clamp control revealed by the voltage-sensing electrode. Our strategy to minimize the Rs error was to reduce the Na+ current density by lowering the external [Na+]. The voltage-clamp quality for TEV recordings in 10 mm Na+ appeared to be greatly improved (Fig. 3B) in a series of responses measured for depolarizations from a holding potential of −100 mV to test potentials of −80 to +40 mV. Based on the voltage responses measured at a variety of Na+ concentrations, we concluded that Na+ current transients up to 150 nA in peak amplitude can be recorded without appreciable distortion of the experimentally observed clamp potential at x= 0.
Figure 3. Two-electrode voltage clamp was not able to control membrane potential in full [Na+].
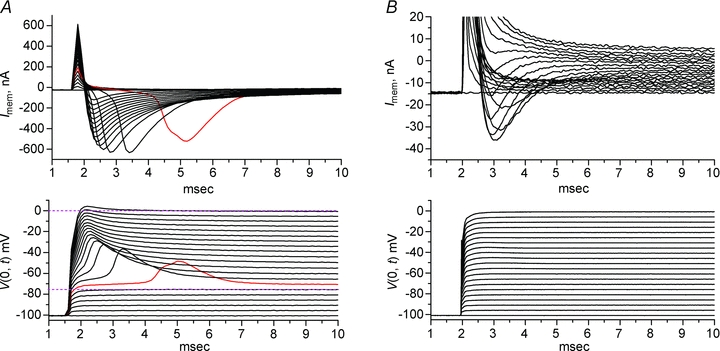
Na+ currents were recorded in detubulated fibres, clamped by TEV at the midpoint. K+, Cl− and Ca2+ currents were blocked or suppressed, as described in the Methods. No leak subtraction has been performed. A, in 145 mm[Na+], loss of voltage-clamp control is obvious from the lag and marked peak of the current (top) and voltage overshoot (bottom) elicited by a depolarization to −70 mV (red trace). The voltage clamp had a brief lag of 0.4 ms to reach steady-state for small depolarizations that did not open Na+ channels (dashed line bottom, −75 mV), and had an overshoot for V≥−70 mV that persisted even at a test potential of 0 mV where the driving force for Na+ was greatly reduced (dashed line, top). B, reducing the [Na+] to 10 mm improved the quality of the voltage clamp.
Computer simulations provide estimates for conditions necessary to maintain voltage-clamp control
Parameter sensitivity studies were performed with the non-linear cable model to ascertain the quality of voltage-clamp control and to determine the range of experimental conditions (current density, fibre size, clamp speed) for which the TEV recordings provide an accurate measure of Na+ channel gating behaviour in mouse muscle fibres. The Rs error produced by large-amplitude ionic currents is readily apparent from the records in Fig. 3A, but there could be additional mechanisms that impede the ability to characterize Na+ currents by voltage-clamp measurements from a point at the centre of the fibre. For example, the membrane conductance increases 50- to 100-fold with maximal activation of Na+ channels, which would transiently decrease the length constant by an order of magnitude. Simulations are needed to determine whether more pronounced cable effects are occurring at the ends of the fibre, even if the peak Na+ current is less than 150 nA and the clamp control appears to be adequate based on the measured voltage at x= 0. It is important to recognize that in the computer simulations the membrane voltage at x= 0 is constrained to equal the predetermined value; V(0, t) is a boundary condition for the solution to eqn (1). Unless otherwise specified, all simulations were performed with V(0, t) computed by the two-exponential fit to the measured TEV response shown in Fig. 2A.
The closed-form solution for the finite-length cable equation applies only to the case of constant (voltage-independent) conductances. Therefore, we used numerical integration to solve the generalized finite-length cable equation with an m3h-type Na+ conductance. The computed spatio-temporal profile of the voltage clamp is shown in Fig. 4A (left panel) for a small 20 mV depolarization from −100 mV, which does not activate the Na+ conductance. The surface plots in Fig. 4 show the voltage profile over half the fibre length, from the midpoint (x= 0) out to one end (x=l/2). The quality of the clamp was excellent, in terms of speed and spatial uniformity, for this simulated 450 μm fibre in Cl−-free bath. The plot in the right panel shows the deviation or voltage error, computed as the difference between the voltage at any position, x, relative to the clamp voltage at x= 0. The sharp transient error at the beginning of the applied voltage step is produced by the brief delay from the passive RC cable properties of the fibre. Depolarization to −40 mV in 145 mm Na+, however, caused a loss of voltage clamp due to the depolarizing effect of the large-amplitude inward Na+ current (Fig. 4B). In experimental practice, the large ionic current in 145 mm[Na+], (typically 600 nA, see Fig. 3A) would produce a loss of voltage control at x= 0 as well. This simulation illustrates the voltage error (right panel) that would occur even if a sufficiently high-compliance amplifier, with low Rs in the current path could be used to maintain clamp control at x= 0. We simulated the effect of reducing extracellular [Na+] to 10 mm, which qualitatively improved the clamp quality (Fig. 3B), by reducing the peak Na+ conductance, GNa, by a factor of (10/145) and by shifting the equilibrium potential, ENa, to 0.4 mV. Both changes reduced the inward Na+ current, and resulted in a dramatic improvement of voltage-clamp quality (Fig. 4C). These model results imply that voltage control over the entire length of the fibre is very good for the experimental conditions shown in the measurements of Fig. 3B. A summary of the voltage-clamp distortions produced by the combined effects from fibre length and current density is provided quantitatively as a contour plot in the Supplementary data (S3).
Figure 4. Model predictions of voltage control over the length of a fibre.
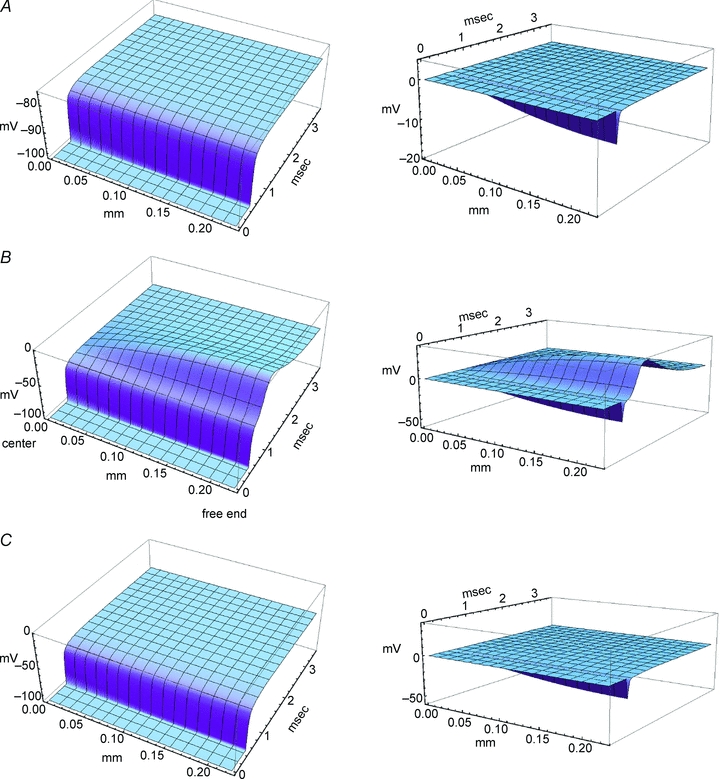
Membrane voltage was clamped at x= 0 (centre of fibre) with a rapid depolarization applied at 0.5 ms. Left panels show the voltage response over a half-fibre length (225 μm), from the centre to one end, and is symmetrical for the other half. Right panels show the voltage error relative to the clamp potential, V(x, t) −V(0, t). Voltage scale (vertical) has been held constant between the left and right panels to aid in visual comparison. A, response to a +20 mV depolarization from −100 mV was below the threshold activation for Na+ channels and therefore voltage clamp along the fibre was well controlled. B, depolarization from −100 mV to −40 mV in 145 mm[Na+] elicited a large Na+ current that created a loss of voltage control at positions away from the midpoint (x= 0). C, a simulated reduction of [Na+] to 10 mm decreased the peak Na+ current to −28 nA (not shown) with a concomitant improvement in voltage clamp over the length of the fibre.
Model simulations of INa provide quantitative estimates for the errors in determining Na+ channel gating parameters from TEV recordings in short fibres
Sodium current responses were computed for voltage-clamp studies of a simulated fibre to quantitatively characterize how well parameter fits of the simulated currents gave accurate estimates for the gating parameters of the Na+ conductance. The idealized control response was defined by the parameter estimates obtained from voltage-clamp simulations of a perfectly space-clamped spherical cell with no series resistance error. The standard simulated fibre was 450 μm in length with an external [Na+] of 22 mm, corresponding to a GNa of 9 mS cm−2 or 15% that in normal physiological sodium and an ENa of 22.8 mV. These model parameters were selected to produce a maximal peak inward Na+ current of about −100 nA, which is comparable to the maximal Na+ current that could be recorded experimentally in the TEV clamp without obvious loss of voltage control detectable with the voltage-sensing electrode. This configuration is a worst-case scenario, in the sense that the conditions ultimately used to experimentally characterize Na+ currents in mouse fibres were more conservative ([Na+] 10 mm).
Clamp speed
The speed of the voltage clamp at the fibre midpoint (x= 0) had a pronounced effect on the time to peak Na+ current and the peak amplitude, as is well known to also occur with a space-clamped spherical cell (Ruben et al. 1997). Figure 5 shows the range of simulated clamp speeds (panel A) and the effect on the Na+ current transient elicited by a depolarization to −30 mV (panel B). Simulated clamp speeds with a single exponential time constant of 200 μs or longer produced a noticeable lag to peak and a decrease in amplitude. Simulations with faster clamp speeds (20–100 μs) were clustered, in part because these transients were faster than the saturating rate of activation for simulated channels ( ms−1, equivalent to τm= 170 μs) and also because the cable properties of the fibre act as a low-pass filter. Simulation with a two-exponential voltage trajectory to model our experimentally measured clamp speed at x= 0 (Fig. 2A, 18 μs 76% and 190 μs 24%) yielded results similar to the fast clamp (100 μs or less). The peak Na+ current amplitude is reduced with slower clamp speeds because inactivation commences before activation is complete (Fig. 5B). In addition, the shape of the peak I–V relation is also distorted by slow clamp speeds that produce an apparent depolarized shift of the reversal potential (Fig. 5C). This phenomenon occurs because channel activation is substantial before the voltage trajectory has reached its maximal depolarized value. As a result, Na+ current flows when the driving force (V(t) –ENa) is larger than will occur as V reaches its steady-state value. Consequently, the I–V relation is distorted toward more negative (inward) currents at depolarized potentials >−10 mV (Fig. 5C). Despite these obvious distortions of the simulated Na+ current transients for slow clamp speeds, the amplitude-normalized peak I–V curves are nearly identical for all but the slowest simulated clamp (Fig. 5D, 500 μs). We conclude that clamp speed is important to accurately determine the latency and amplitude of the peak Na+ current, but the normalized I–V characteristics (and hence the determination of midpoint and slope of a Boltzmann fit) are less sensitive. Unacceptably slow clamp speeds will be reflected by an apparent depolarized shift of the reversal potential compared to the predicted ENa, and the resulting distortions will produce an apparent depolarized shift of V1/2 and larger slope factor K from a Boltzmann fit to estimate the voltage dependence of activation.
Figure 5. Effect of voltage-clamp speed on Na+ currents in a simulated fibre.
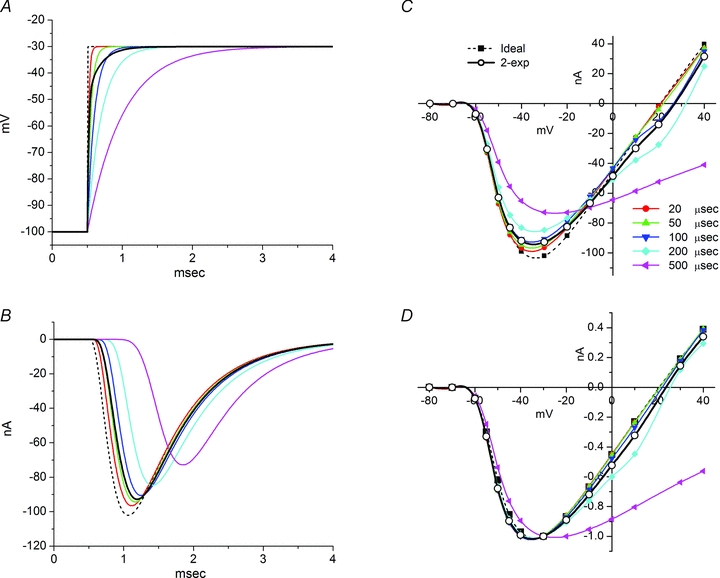
A, voltage transients applied at the simulated fibre midpoint, x= 0. Voltage-clamp kinetics were modelled as a single exponential rise (time constant 20 to 500 μs) or a double-exponential to recapitulate the experimentally measured voltage transient τfast= 0.018 μs (76%) and τslow= 0.19 μs (24%), or an idealized instantaneous jump. B, simulated Na+ currents elicited by depolarization from −100 to −30 mV. Model fibre had a length of 450 μm and was in 22 mm[Na+]. C, peak INa−V relation reveals distortion produced by voltage-clamp commands with a time constant of 200 μs or larger. D, amplitude normalized I–V relation shows the apparent voltage dependence of activation is not affected until the clamp has a time constant of 500 μs.
Fibre length
The influence of fibre length was investigated over a range from 300 to 1200 μm, as compared to a mean length of 450 μm (range 300–600 μm) for the fibres selected for experimental studies. The centre of the simulated fibre was clamped with the two-exponential model of the measured voltage trajectory (Fig. 2A). Figure 6A shows model Na+ current responses for a simulated depolarization from −100 to −30 mV. Current amplitudes have been scaled by a factor of (length (l)/450 μm) to facilitate a visual comparison of the non-linear effects from variation in fibre length. With increasing fibre length, the scaled Na+ current that would be measured at the midpoint is attenuated and delayed for two reasons. First, the rise time for the voltage clamp is slower at the ends of an elongated fibre, which results in significant channel inactivation during the trajectory toward peak activation. Second, because the time to peak Na+ current is delayed at the ends of the fibre, temporal dispersion attenuates the summated current response recorded at the fibre midpoint. The net effect on the simulated peak I–V relation is an attenuation at voltages near the maximal inward current (−40 to −10 mV, Fig. 6B) and a distortion of the normally linear portion of the response near the reversal potential. This latter effect is produced by the slower rise time of membrane depolarization (see above for clamp speed effects). If the peak I–V relation is normalized to the maximal inward current, then it becomes clear by visual inspection that for longer fibres the apparent midpoint of activation will be shifted toward more negative potentials (Fig. 6C). It is important to recognize that this left shift in the apparent voltage dependence of activation with longer fibres can occur without an obvious loss of voltage control from series resistance effects (Figs 3 and 4). The demands on the fidelity of the voltage clamp are less stringent when characterizing the voltage dependence of fast inactivation at steady state, using a 100 ms conditioning pulse. The simulated responses to such an ‘h-infinity’ pulse protocol show no perceptible distortions, even for fibres up to 1200 μm in length (Fig. 6D).
Figure 6. Effect of fibre length on Na+ currents in a simulated fibre.

A, Na+ currents elicited by depolarization from −100 to −30 mV. The simulated fibre was in 22 mm[Na+] and clamped at the midpoint with double exponential command potential as in Fig. 2. Current amplitudes have been linearly scaled by fibre length, relative to a 450 μm fibre. B, peak I–V relation shows attenuation of maximal inward current and distortion near Erev for longer simulated fibres. Curves show spline interpolation for visual comparison and do not represent Boltzmann fits. Dashed line shows the error in estimating Erev from extrapolation of a Boltzmann fit to the data from −80 to 10 mV for a 1200 μm fibre. C, when amplitude normalized for maximal inward current, the peak I–V relation shows the hyperpolarized (leftward) shift in the apparent voltage dependence of activation for longer simulated fibres. D, the voltage dependence of steady-state fast inactivation, measured as the relative peak current for a test depolarization to −30 mV from various holding potentials, is not distorted in simulated fibres up to 1200 μm in length.
The overall effect of fibre length on the determination of Na+ channel gating parameters, based on fits to peak currents measured in standard pulse protocols, is summarized in Fig. 7. The idealized parameter fits for a perfectly space-clamped cell are represented by the values plotted for a ‘0 μm’ length fibre. Our simulations show that as fibre length increases the activation parameters Gmax and k will be underestimated while the apparent midpoint of activation, V1/2, will be shifted toward more negative voltages. The error in parameter estimation is predicted to be very modest for fibres of 600 μm or shorter. The reversal potential estimated by linear interpolation of the peak I–V as the current shifts from inward to outward is accurate (Fig. 7, bottom right). Large errors in estimating Erev may occur, however, if the parameter is determined by extrapolation from a more limited data set wherein only inward Na+ currents are recorded as often occurs experimentally to avoid fibre damage from large positive test depolarizations. For example, a standard Ohmic Boltzmann fit to the peak I–V data for voltages from −80 to 10 mV for a 1200 μm fibre (Fig. 6B, dashed line) erroneously estimates a positive-shifted Erev (Fig. 7, bottom right). These simulations illustrate the importance of experimentally measuring a reversal in current direction to determine Erev.
Figure 7. Errors in activation gating parameters estimated from fits to peak Na+ currents in simulated fibres of various lengths.
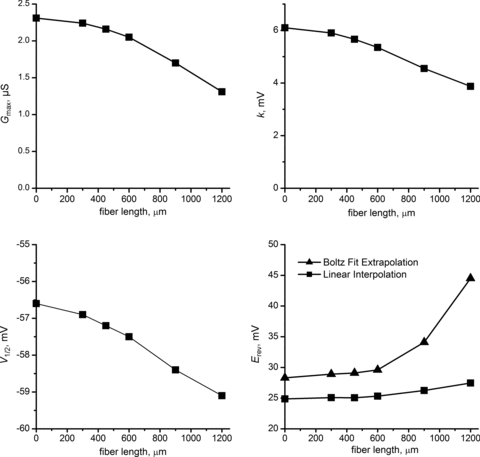
Parameters shown for fibre length of 0 μm were determined from simulations with a perfectly space-clamped spherical cell. The estimate for Erev (bottom right panel) was determined by two methods: linear interpolation (squares) or extrapolation of a Boltzmann fit from −80 to −10 mV (triangles).
Gating properties of Na+ currents in mouse fibres
The gating behaviour for wild type Na+ channels was determined for two mouse strains commonly used in transgenic studies, C57BL/6 and 129-E. All recordings were in enzymatically dissociated fibres from the plantar aspect of the hindfoot, originating from the lumbricales and flexor digitorum brevis. Data were pooled for male and female mice. Recordings were made between 4 and 72 h after dissociation, with fibres maintained in culture as described in the Methods.
Activation
For the activation pulse protocol, we developed a custom leak subtraction strategy (Supplementary material), which is based on voltage-dependent inactivation of Na+ channels to isolate the non-linear background currents over the entire range of test potentials. Leak-subtracted currents are shown in Fig. 8A for a series of test depolarizations from a holding potential of −100 mV. The voltage dependence of activation was determined from the peak Na+ current. Maximal peak Na+ current density was greater for fibres from 129-E mice than C57BL/6 (−19.1 ± 2.3 nA nF−1versus−14.9 ± 0.88 nA nF−1, P= 0.010) and occurred at a test potential of −45 mV (Fig. 8B). The voltage threshold for activation and steepness were comparable for C57BL/6 and 129-E mice. Boltzmann fits to the peak I–V data yielded activation midpoints of −53.3 ± 0.45 mV (C57BL/6) and −53.9 ± 0.73 mV (129-E) and steepness factors of 4.2 ± 0.17 mV (C57BL/6) and 4.4 ± 0.38 mV (129-E). The voltage dependence of Na+ channel activation in these acutely dissociated fibres was markedly shifted by −30 mV toward hyperpolarized potentials in comparison to results from whole-cell patch recordings of heterologously expressed NaV1.4 plus β1 subunits in HEK cells. This difference is illustrated by the conductance–voltage curves in Fig. 8C for which the data from muscle fibres are compared to typical behaviour reported for NaV1.4 expressed in HEK cells from many laboratories (Yang et al. 1994; Hayward et al. 1996; Bendahhou et al. 1999; Bouhours et al. 2004) in conditions with external 140 NaCl, 2 CaCl2, 1 MgCl2; internal 105 CsF, 35 NaCl, 10 EGTA. We have carefully tested for and excluded two factors that have previously been associated with a leftward shift of activation. First, we can exclude a loss of voltage-clamp control. The measured control of membrane potential at the fibre midpoint was excellent (see Fig. 3B and Supplementary Fig. S2), and the extensive set of model simulations demonstrate that for the fibre lengths and current amplitudes in our measurements it is very unlikely that poor voltage control occurred distally. Moreover, the steepness for the voltage dependence of activation we observed is not unusually high (small k) as would be expected for a series resistance artifact with loss of voltage control. Second, the Na+ current in our fibre may have a substantial contribution from NaV1.5, the cardiac/fetal skeletal muscle isoform which does activate at more negative voltages than NaV1.4 (Chahine et al. 1996). We have used TTX sensitivity and RT-PCR to exclude this possibility, as detailed below.
Figure 8. Voltage dependence of activation.
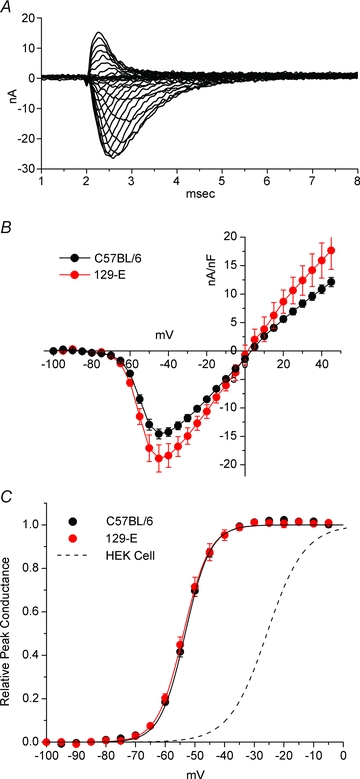
A, Na+ currents elicited by depolarization to a series of test pulses (−80 to +40 mV) from a holding potential of −100 mV. Leak subtraction performed as described in Supplement 1. B, peak Na+ current was normalized to fibre capacitance and plotted as the average for fibres from C57BL/6 mice (n= 41) or 129-E mice (n= 6). Error bars show s.e.m. and the smooth curve is a cubic spline interpolation. C, the data from A are replotted as relative peak conductance. Boltzmann fits were indistinguishable for C57BL/6 and 129-E fibres, both of which were shifted to hyperpolarized potentials in comparison to the response reported for NaV1.4 expressed in HEK cells (midpoint of −26 mV, dashed line).
Fast inactivation
The steady-state voltage dependence of fast inactivation was measured as the relative Na+ current elicited by a test depolarization to −40 mV, following a 300 ms conditioning pulse (Fig. 9). In this protocol a standard P/8 leak subtraction method could be used because for a test potential of −40 mV the residual non-linear capacitance transient did not obscure the peak ionic current (Fig. 9A, inset). The steady-state voltage dependence was not different between fibres from C57BL/6 and 129-E mice, with fits to a Boltzmann function being −87.7 ± 0.59 mV (C57BL/6, n= 36) and −88.7 ± 1.0 mV (129-E, n= 13) for the half-inactivation midpoint and a steepness factor of 6.8 ± 0.13 mV (C57BL/6) and 6.3 ± 0.12 mV (129-E).
Figure 9. Fast inactivation behaviour.
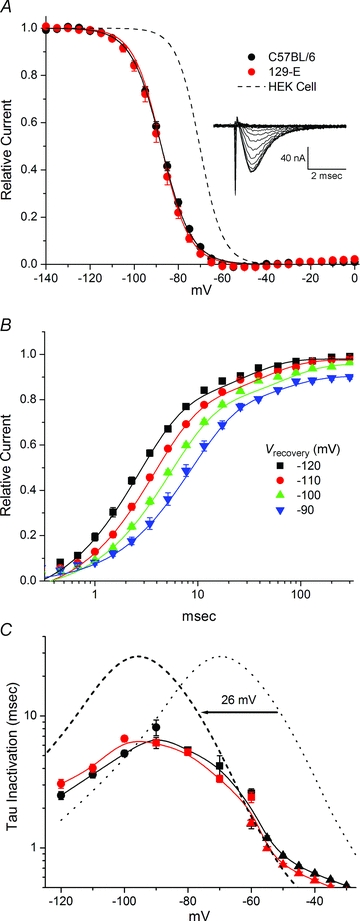
A, voltage dependence of fast inactivation was measured as the relative current after a 300 ms conditioning pulse. Inset shows an example of currents recorded from a C57BL/6 fibre. Boltzmann fits were indistinguishable for C57BL/6 and 129-E (continuous lines), but were left shifted by −18 mV in comparison to the midpoint of fast inactivation (−70 mV) for NaV1.4 channels expressed in HEK cells. B, recovery from inactivation for C57BL/6 following a 30 ms conditioning pulse to −20 mV. Curves show two exponential fits. C, kinetics of fast inactivation are displayed as the time constant for recovery (circles) or entry from closed states (square) or the open state (triangles). Kinetic properties were comparable for C57BL/6 and 129-E fibres, both of which were left shifted compared to reported values for NaV1.4 expressed in HEK cells (dotted line, reproduced from Wu et al. 2005). When the HEK cell curve is shifted leftward by −26 mV (dashed line) to compensate for the difference in activation (8C), the faster rate of recovery from inactivation for Na+ channels in skeletal muscle is revealed.
Recovery from inactivation measured after a 30 ms conditioning pulse to −20 mV, from which recovery was more than 80% complete within 10 ms (Fig. 9B) confirmed that channels were predominantly in the fast inactivated state. For these recovery experiments, the holding potential was set equal to the conditioning pulse potential and therefore the relative current approaches 1.0 at all voltages. The data for recovery at potentials of −120 to −90 mV were fitted by a double exponential (continuous lines, Fig. 9B), with the faster component used to characterize the kinetics of recovery from fast inactivation. The kinetics for entry to fast inactivation from the open state was determined by a single exponential fit to the Na+ current decay measured for test depolarizations of −55 to −20 mV (data as in Fig. 9A). Finally, the rate of closed-state entry to fast inactivation (−90 to −60 mV range) was determined with a two-pulse protocol in which the conditioning pulse duration was progressively increased and the decrement of peak Na+ current elicited by a second pulse to −40 mV was fitted by a single exponential function of conditioning pulse duration. A summary for all three measures of fast inactivation kinetics is shown in Fig. 9C. The responses for C57BL/6 and 129-E fibres were comparable, and both were left shifted by ∼25 mV in comparison to the voltage dependence of fast inactivation kinetics for NaV1.4 expressed in HEK cells. As fast inactivation is strongly coupled to activation (Aldrich et al. 1983; Kuo & Bean, 1994), the comparison of inactivation kinetics is more informative when the HEK cell kinetic data are shifted leftward by the −26 mV difference observed for the peak conductance–voltage relationship in Fig. 8C. With this compensation, the dashed line in Fig. 9C shows the major difference for the kinetics of fast inactivation is a 4-fold faster rate of recovery (smaller time constant) for NaV1.4 channels expressed in skeletal muscle fibres compared to HEK cells.
Slow inactivation
Extracellular cations have more pronounced effects on slow inactivation of sodium channels than on fast gating behaviour (Townsend & Horn, 1997), and the low external [Na+] used to minimize the series resistance error will produce a hyperpolarized shift in the voltage dependence of slow inactivation in the order of 20 mV (Qu et al. 2001). Consequently, we characterized slow inactivation in 140 mm Na+. Series resistance errors were avoided by using a test potential of 20 mV which was close to the reversal potential of ∼50 mV and therefore elicited only small Na+ currents in the order of −200 nA.
Protocols used to measure slow inactivation induced with a conditioning pulse rely upon recovery from fast inactivation, but not slow inactivation, during an intervening gap at hyperpolarized potentials as a means to distinguish between these two non-conducting states. The first step therefore was to determine the optimal recovery gap duration by measuring the full time course of recovery from inactivation. The control response was measured as the peak Na+ current for a depolarization to 20 mV from a holding potential of −100 mV. A 30 s conditioning pulse to 0 mV was then applied to inactivate channels and recovery at −100 mV was monitored as the peak Na+ current elicited by brief (5 ms) test depolarizations to 20 mV applied at a series of progressively longer intervals (see inset, Fig. 10A). Recovery is plotted in Fig. 10A as the relative amplitude of the Na+ current elicited by the test pulse (Pn)/control pulse (P0), where n= 1, 2, 3…. Approximately 10% of the available current recovers within the first 20 ms and little additional recovery occurs by 50 ms. We interpret this initial response as an indication that 90% of the channels were slow inactivated at the end of the 30 s conditioning pulse. There was no discernable difference for the maximal extent slow inactivation or time course of recovery for Na+ channels from C57BL/6 or 129-E fibres. Recovery followed a monotonic trajectory that was best fitted by a two-exponential curve (continuous lines, Fig. 10A). The two components had time constants of about 0.8 s and 6 s, and had comparable magnitudes of 0.45 (Table 1). This recovery from slow inactivation in muscle fibres was about 2-fold slower than is typically observed for NaV1.4 expressed in HEK cells (dashed line, Fig. 10A), where the two time constants are 0.4 and 3 s (Hayward et al. 1997).
Figure 10. Kinetics of slow inactivation.
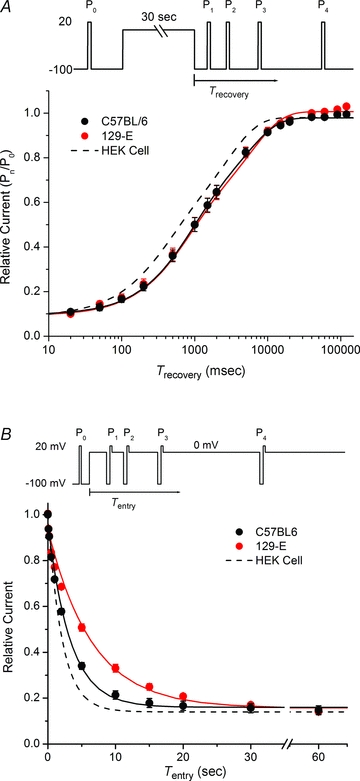
A, recovery from slow inaction at −100 mV was measured as the relative Na+ current (P1/P0, P2/P0, …) elicited by 5 ms test pulses at varying times after a 30 s conditioning pulse to 0 mV. Continuous lines show double exponential fits to the recovery time course, which yield comparable values for C57BL/6 and 129-E fibres as listed in Table 1. Dashed line shows recovery from inactivation at −100 mV observed for NaV1.4 expressed in HEK cells (Hayward et al. 1997). B, entry to slow inactivation at 0 mV was monitored as the relative Na+ current (P1/P0, P2/P0, …) measured for a series of test pulses to +20 mV that were preceded by a 100 ms recovery gap to −100 mV. Responses were measured during a single sweep with a step change in the holding potential to 0 mV as shown in the inset. Single exponential fits demonstrated a 2-fold larger time constant for 129-E fibres (6.50 s) than C57BL/6 (3.28 s).
Table 1.
Slow inactivation properties
| C57BL/6 | 129-E | |
|---|---|---|
| Steady state | ||
| V0.5 (mV) | −69.9 ± 1.9 | −67.6 ± 1.5 |
| K (mV) | 10.7 ± 0.46 | 10.8 ± 0.44 |
| Io | 0.16 ± 0.024 | 0.17 ± .019 |
| (7) | (10) | |
| Entry kinetics | ||
| Amp | 0.80 ± 0.017 | 0.78 ± 0.0081 |
| τ (s) | 3.28 ± 0.21 | 6.50 ± 0.40 |
| (9) | (8) | |
| Recovery kinetics | ||
| Amp_0 | 0.096 ± 0.011 | 0.12 ± 0.017 |
| Amp_1 | 0.43 ± 0.038 | 0.48 ± 0.026 |
| τ_1 (s) | 0.73 ± 0.090 | 0.87 ± 0.12 |
| Amp_2 | 0.45 ± 0.035 | 0.42 ± 0.021 |
| τ_2 (s) | 5.0 ± 0.51 | 7.1 ± 1.0 |
| (9) | (11) | |
Based on the kinetics of recovery at −100 mV following a brief conditioning pulse to 0 mV for 30 ms (Fig. 9B, green triangles) compared to that after a long 30 s conditioning pulse (Fig. 10A), we chose a gap duration of 100 ms at −100 mV as the optimal recovery interval to distinguish fast from slow inactivation. With this recovery interval, 90% of channels would have recovered from fast inactivation, whereas only 5% of channels would have recovered from slow inactivation.
The time course for entry to slow inactivation was measured by depolarizing the holding potential to 0 mV, and then interjecting a series of 100 ms recovery intervals at −100 mV immediately followed by a test depolarization at 20 mV (Fig. 10B, inset). The peak current at these test depolarizations, normalized to the control response elicited at 20 mV from a holding potential of −100 mV (Pn/P0), provided a measure for the onset of slow inactivation at 0 mV. The onset of slow inactivation occurred over a course of seconds and was more sluggish for Na+ channels in 129-E fibres than for C57BL/6 (Fig. 10B). The time course for entry to slow inactivation was fitted well by a single exponential with time constants of 3.28 ± 0.21 s for C57BL/6 (n= 9) and 6.50 ± 0.40 s for 129-E (n= 8), which were different (P < 0.001). Prior studies of NaV1.4 expressed in HEK cells have reported a faster entry to slow inactivation (Wu et al. 2005; Webb et al. 2009), with a time constant of about 2 s (dashed line, Fig. 10B).
The steady-state voltage dependence of slow inactivation was measured as the relative Na+ current that failed to recover within 100 ms at −100 mV, following a series of 30 s conditioning pulses to varying potentials (Fig. 11). The maximal extent of slow inactivation reached a plateau of 80% (0.20 relative current) at depolarized potentials, and the midpoint for the voltage dependence was about −70 mV for sodium channels in both C57BL/6 and 129-E fibres (see Table 1). Unlike the voltage dependence for fast inactivation which was left-shifted compared to NaV1.4 expressed in HEK cells (Fig. 9A), the voltage dependence for slow inactivation was comparable for currents recorded herein for muscle fibres and NaV1.4 expressed in HEK cells.
Figure 11. Voltage dependence of slow inactivation.
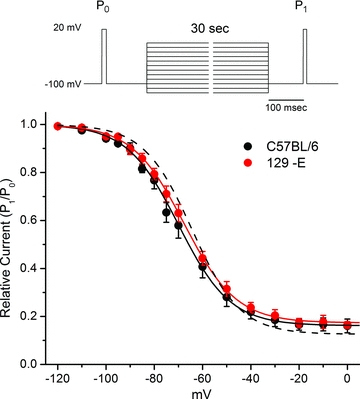
Slow inactivation was measured as the relative Na+ current (P1/P0) that failed to recover within 100 ms at −100 mV, after 30 s conditioning pulses at varying potentials. Responses from C57BL/6 and 129-E fibres were identical. Continuous lines show fits to a Boltzmann with an offset, Io, with the parameters listed in Table 1. Dashed line shows slow inactivation behaviour typical for NaV1.4 expressed in HEK cells (V0.5=−64 mV, k= 10 mV, Io= 0.13).
Estimated contribution from NaV1.5 expression in muscle fibres
The voltage dependence of activation and of fast inactivation in fibres were shifted leftward (hyperpolarized), as compared to gating behaviour of NaV1.4 expressed in HEK cells (Figs 8C and 9A). One possible explanation for this difference would be a contribution from NaV1.5, which activates at more hyperpolarized potentials than NaV1.4 (∼20 mV shift; Chahine et al. 1996). Moreover, NaV1.5 expression is up-regulated in denervated skeletal muscle (Yang et al. 1991), and our recordings were from fibres maintained in aneural cultures for up to 48 h. Two independent methods were used to assess the relative expression of NaV1.4 and NaV1.5 in dissociated fibres.
NaV1.5 channels are relatively resistant to tetrodotoxin (TTX) blockade, with an IC50 of 1–5 μm compared to 5–50 nm for NaV1.4 channels. Figure 12A shows Na+ currents recorded from a fibre were almost completely blocked by application of 200 nm TTX, which implies the majority of the current was conducted by NaV1.4 channels. The average TTX sensitivity for fibres maintained in culture for 3 days is shown by 200 nm block in Fig. 12B. Assuming an IC50 of 30 nm for NaV1.4 and 3 μm for NaV1.5, these data show that 98% of the Na+ current was conducted by NaV1.4 channels.
Figure 12. Contribution of NaV1.5 channels to the Na+ current in skeletal muscle fibres.
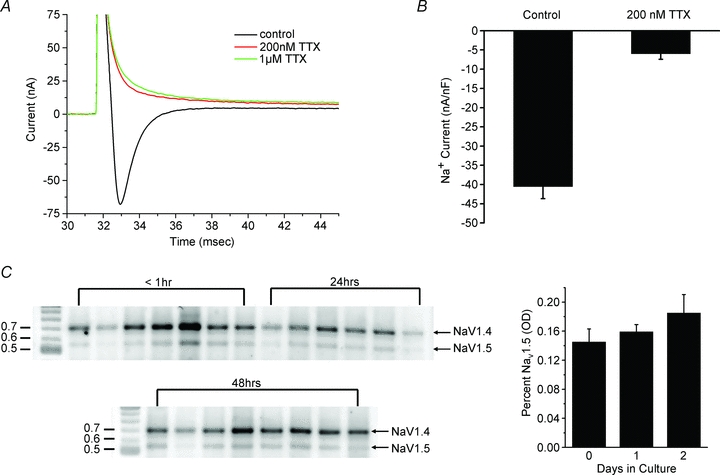
A, Na+ currents recorded from muscle fibres are blocked by 200 nm TTX. No leak subtraction was used. B, reduced Na+ current density for a population of fibres exposed to 200 nm TTX. The 87% reduction in current density is consistent with 98% TTX-sensitive NaV1.4 channels (IC50 30 nm) and 2% TTX-resistant NaV1.5 channels (IC50 3 μm). C, RT-PCR amplification of NaV1.4 and NaV1.5 transcripts, followed by NaV1.5-specific digestion with KpnI reveals a predominance of the NaV1.4 transcript that remains stable for 2 days in culture.
The relative abundance of NaV isoforms was also estimated from mRNA levels. A competitive RT-PCR assay was performed on acutely dissociated fibres and for those in culture for 24 or 48 h. NaV1.4 and NaV1.5 transcripts were both amplified by a single PCR reaction with a common set of primers, and the relative abundance of amplimers was determined by optical densitometry after NaV1.5-specific digestion with KpnI (Fig. 12C). The NaV1.5 transcript was initially 15% of the total and increased with number of days in vitro, but remained under 20% even after 3 days in culture.
Both the TTX block and RT-PCR data show NaV1.5 was a minor contributor to the Na+ channel population in our fibres. Therefore, we conclude the leftward shift of activation and fast inactivation observed for Na+ currents in muscle fibres compared to NaV1.4 gating in HEK cells is attributable to the gating properties of NaV1.4 in the muscle environment and not caused by a contribution from NaV1.5 channels.
Discussion
The goal of this study was to characterize the gating behaviour of voltage-activated sodium channels expressed in fully differentiated skeletal muscle of the mouse. Sodium currents have been measured previously in many mammalian skeletal muscle preparations (Adrian & Marshall, 1977; Duval & Leoty, 1978; Pappone, 1980; Almers et al. 1984). The motivation herein was to obtain data specifically for the mouse, as this is the preferred mammalian system for exploring genetically engineered animals. Indeed, knock-in mutants of NaV1.4 have been constructed in the mouse to study myotonia and periodic paralysis (Hayward et al. 2008). Moreover, the recording technique was optimized to maintain the endogenous regulation of Na+ channels (fully differentiated intact fibres and sharp microelectrodes to preserve the myoplasmic contents) and to achieve a more accurate two-electrode voltage clamp by using short detubulated fibres and low external sodium. The principle observations were that the voltage dependence for activation and fast inactivation were shifted dramatically toward more hyperpolarized potentials (−53 mV and −88 mV, respectively), as compared to heterologous expression studies of NaV1.4 in HEK cells, and that slow inactivation occurred over a relatively depolarized range compared to fast inactivation.
Voltage dependence of gating is hyperpolarized for native NaV1.4 expressed in muscle
The leftward shift for the voltage dependence of fast gating of NaV1.4 observed in this study is consistent with the widely accepted properties of mammalian skeletal muscle excitability, namely a voltage threshold for spike initiation at −60 to −55 mV from a resting potential of −90 to −85 mV. Indeed, it is difficult to reconcile the NaV1.4 activation midpoint of −24 mV observed in HEK cell expression systems with the spike threshold for muscle fibres. Nevertheless, because the reports of NaV1.4 behaviour in artificial expression systems have dominated the concepts of channel gating for decades, we performed several controls to exclude possible sources of artifact. Voltage-clamp error is not a likely cause for the following reasons. First, the model simulations of a short cable with voltage-activated conductances demonstrated that our experimental conditions (fibre length ∼450 μm, low external [Na+] of 10 mm with peak Na+ current <150 nA) were conservative with regard to space clamp and clamp speed. Explicit simulations for the peak I–V curve showed only a minimal leftward shift of activation from distortions of the voltage clamp, about 1.5 mV for a 600 μm fibre in 22 mm Na+ (Fig. 7). Second, there was no correlation between the maximal peak amplitude of the Na+ current and the midpoint of activation amongst a population of over 30 fibres. If series resistance error had been significant, then an apparent leftward shift and steeper voltage dependence of activation would have been observed in fibres with larger current amplitudes. Third, the relative leftward shift of gating was not identical for activation and fast inactivation, which rules out an uncompensated junction potential or membrane surface charge effect. Three different leak subtraction techniques were used: conventional P/8, TTX-sensitive, and NaV inactivation with a prepulse; of which all yielded the same leftward shift of gating. The low external [Na+] of 10 mm used to minimize series resistance effects is not a likely cause of the left shift. A reduced Na+ gradient has been shown to cause a left shift for sodium currents recorded from neurons, but the magnitude was smaller, about 5 mV for hippocampal neurons in 0 Na+ (Kuo & Liao, 2000) or 10 mV for a 3-fold reduced gradient in recordings from cerebellar neurons (Afshari et al. 2004), compared to the 30 mV observed herein. To exclude this possible effect of low [Na+], we performed the activation pulse protocol in a 140 mm Na+ bath to which 80 nm TTX was added to reduce the peak Na+ currents. The midpoint of activation was −50.1 ± 1.1 mV (n= 7), which was not significantly different from the −53 mV recorded in 10 mm[Na+]. Finally, the possibility of an up-regulation of NaV1.5 relative to NaV1.4 was excluded by showing near-complete block of currents with 200 nm TTX and by mRNA analysis with RT-PCR. Therefore, we conclude that the relatively hyperpolarized values for the voltage dependence of gating reported herein are an intrinsic feature of NaV1.4 when expressed in an intact fully differentiated mouse fibre.
A pattern of NaV1.4 gating shifts for different experimental preparations
A survey of published reports for the voltage dependence of NaV1.4 gating reveals a rather broad range of values for the midpoint of activation or fast inactivation. In general, the observed voltage dependence of gating for NaV1.4 is more depolarized when expressed heterologously in HEK cells (Takahashi & Cannon, 1999; Bouhours et al. 2004) than is observed for native current in skeletal muscle, regardless of whether the β1 subunit is co-expressed (Webb et al. 2009). Moreover, the midpoint of activation is notoriously unstable in HEK cells. Over the course of a few minutes after attaining whole-cell access, the voltage dependence shifts by up to 20 mV to more hyperpolarized potentials. Even with this shift, however, the voltage dependence of NaV1.4 gating in HEK cells is still depolarized relative to that of native channels in muscle. It is notable that we did not observe this progressive leftward shift in TEV recordings lasting up to 30 min in muscle fibres. In HEK cells the midpoint of activation is −20 to −30 mV, and for fast inactivation is −60 to −70 mV. No consistent differences in voltage dependence are observed between rat (Cummins et al. 1993; Hayward et al. 1996) and human (Yang et al. 1994; Takahashi & Cannon, 1999) NaV1.4 expressed in HEK cells. To our knowledge, mouse NaV1.4 has not been studied by expression in HEK cells.
To study Na+ currents in a muscle-cell context, recordings are often performed by whole-cell patch recording from myoballs that were differentiated from primary cultures of myoblasts. For human myoballs, the midpoint of activation and fast inactivation were −34 mV and −66 mV, respectively (Probstle et al. 1988). Whole-cell patch recording, whether in HEK cells or myoballs, will dialyse the cytoplasmic contents and will undoubtedly affect channel gating by disruption of phosphorylation (especially with the use of internal fluoride to improve seal stability), ox/redox, soluble cofactors, and even mechanical stretch. In mouse, cell-attached patch recordings from myoballs yielded values of −40 mV for activation and −75 mV for fast inactivation (Mille et al. 2009). An important caveat for the myoball studies is the high expression level of the fetal/cardiac isoform, NaV1.5, which has a leftward shift of gating relative to NaV1.4 and may account for 40% of the total Na+ current (Mille et al. 2009). Finally, a variety of approaches have been used to record Na+ currents from acutely dissociated fully differentiated mammalian skeletal muscle. Adrian and Marshall developed a three-electrode technique for voltage clamping intact fibres of physical lengths exceeding the length constant (Adrian & Marshall, 1977). Voltage control was approximate, at best, and the estimated midpoints for activation and fast inactivation in rat EDL were −47 mV and −80 mV, respectively. Pappone (1980) used a Vaseline gap voltage clamp on cut fibres from rat fast twitch muscle (EDL or sternocleidomastoid m.). The midpoints for activation and fast inactivation were −52 mV and −90 mV, values that are identical to our findings herein. Almers and colleagues developed the loose-patch voltage-clamp method (Stuhmer & Almers, 1982) and recordings from biopsied human intercostal muscle showed midpoints for activation and fast inactivation of −46 mV and −86 mV, respectively (Almers et al. 1984).
Taken together, these observations show a general trend that as the experimental preparation becomes more distant from fully differentiated intact muscle along a progression through disruption of muscle fibre integrity, cultured myotubes, or heterologous expression in non-muscle mammalian cell lines then there is a progressively larger depolarized shift in the voltage dependence of NaV1.4 gating compared to the behaviour in unperturbed muscle. Similar behaviours have been observed for neuronal sodium channels (NaV1.1, NaV1.2, NaV1.3 and NaV1.6) for which activation has a midpoint in the range of −20 mV to −10 mV when channels are co-expressed with β subunits in HEK cells (Qu et al. 2001; Aman et al. 2009), and yet endogenous currents in isolated neurons have activation midpoints in the −40 to −30 mV range (Raman et al. 1997; Maurice et al. 2001; Yu et al. 2006).
Modulation of NaV1.4 gating in skeletal muscle
In addition to the variation in experimental technique described above that results in shifts for the voltage dependence of NaV1.4 gating, there are many examples whereby the voltage dependence of the Na+ current is dynamically modulated in skeletal muscle. One of the strongest modulators is denervation, which results in up-regulation of the NaV1.5 TTX-resistant channel expression (Yang et al. 1991) and therefore a leftward shift in the voltage dependence of current activation. Fibre type also influences Na+ currents, with slow type I fibres having lower current density and a depolarized shift in gating as compared with fast type IIa or IIb (Duval & Leoty, 1980; Ruff & Whittlesey, 1992; although also see Rannou et al. 2009). We did not histologically assess fibre type in this study, but the intrinsic muscles of the footpad are primarily fast twitch (Carlsen et al. 1985). Sodium currents may also be modified by acquired muscle diseases. In critical illness myopathy, excitability is decreased by a hyperpolarized shift of inactivation and activation with a net result of chronic inhibition at the resting potential (Rich & Pinter, 2003). More recently, it has been observed in loose patch recordings that the midpoint of Na+ current activation and fast inactivation in rat EDL will shift reversibly by tens of millivolts over minutes in response to sustained shifts in the holding potential (Filatov et al. 2005). This discovery raises questions about the impact of depolarizing high-K+ solutions used to nullify the resting potential for cell-attached patch studies on skeletal muscle. Genetic background can also affect Na+ channel gating, as was observed for myoballs cultured from different strains of mice (Mille et al. 2009), although in agreement with our study there was no significant difference for C57BL/6 and 129-E mice. Much remains to be determined about the relative contributions of NaV isoform switching, post-translational modification or trafficking as the mechanistic basis for the dynamic modulation of Na+ current gating in skeletal muscle. Recognition of these effects, however, illustrates how it is possible for the gating behaviour of NaV1.4 channels to vary under different experimental contexts and supports our contention that the hyperpolarized shift of gating observed herein for TEV recordings of detubulated mouse fibres, relative to the plethora of HEK cell expression studies, most probably represents the channel behaviour when endogenously expressed in fast twitch muscle and not an artifact associated with the technical challenges for recording Na+ currents in fibres.
Dissociation in the voltage dependence of slow inactivation and fast inactivation for NaV1.4 in skeletal muscle
Slow inactivation of NaV1.4 in skeletal muscle may be important for setting Na+ channel availability in response to slow shifts in the resting potential (Ruff et al. 1988), and when disrupted results in susceptibility to periodic paralysis (Cannon, 2006). As a result of the technical challenges to maintain a stable recording over several minutes required to characterize slow inactivation, prior studies of slow inactivation for endogenous Na+ currents in mammalian muscle fibres are primarily based on the loose patch technique (Ruff et al. 1988; Ruff & Whittlesey, 1992; Rich & Pinter, 2003) and a few cell-attached patch studies (Desaphy et al. 2001). We found robust slow inactivation for Na+ currents in mouse muscle fibres for which the kinetics of entry and recovery were about 2-fold slower than observed when NaV1.4 is expressed in HEK cells (Hayward et al. 1997), both at room temperature. Unlike the situation for fast inactivation where we observed an ∼20 mV leftward shift in muscle fibres compared to HEK cells (Fig. 9A), the voltage dependence for slow inactivation was comparable in muscle fibres and HEK cells, both being about −65 mV (Fig. 11). Viewed another way, our data for endogenous Na+ currents in mouse muscle fibres show a much larger separation in the voltage dependence of fast inactivation (−88 mV) and slow inactivation (−68 mV) than has been observed for NaV1.4 expressed in HEK cells, typically −70 mV for fast and −64 mV for slow inactivation. Curiously, the inverse has been reported by two groups using loose patch recording (Ruff & Whittlesey, 1992; Rich & Pinter, 2003); that is, slow inactivation occurred at more hyperpolarized potentials then fast inactivation. In one case (Ruff & Whittlesey, 1992), this may be partially explained by the use of an unusually short conditioning pulse duration (20 ms) which would cause an apparent rightward shift of fast inactivation. Cell-attached patch recordings in rat fibres (Desaphy et al. 2001), both EDL and soleus, revealed a 30 mV depolarized shift for slow inactivation (−64 mV) compared to fast inactivation (−94 mV), similar to our TEV studies in mouse fibres.
The functional implication of our finding is that modulation of Na+ channel availability in skeletal muscle is tuned for regulation by fast inactivation; the resting potential of −90 mV corresponds to the steepest region of the fast inactivation curve. Slow inactivation, however, occurs at much more depolarized potentials (−68 mV). Therefore slow inactivation is more likely to have physiological relevance for limiting excitability during prolonged bursts of action potentials (use-dependent trapping in the slow inactivated state) or as a protective mechanism to prevent attacks of depolarization-induced periodic paralysis resulting from fast gating defects in mutant NaV1.4 channels.
Fidelity of TEV recordings in skeletal muscle fibres
This study provides a methodological guide for optimization of a two-electrode voltage clamp to record Na+ currents from isolated mouse skeletal muscle fibres. The model simulations define the range of experimental conditions (clamp speed, fibre length, current amplitude) for which voltage-clamp control is achieved and also provide quantitative estimates for the magnitude of potential artifacts and the influence these have on the determination of voltage-dependent gating parameters. If these conditions are met, then accurate measurement of Ca2+, K+ or Cl− currents is also assured, since the technical challenges of current density and gating kinetics are less demanding for these other voltage-gated conductances.
Short muscle fibres isolated from enzymatic dissociation of the flexor digitorum brevis (FDB) and lumbricale muscles (<600 μm, equivalent to an apparent capacitance for detubulated fibres of <3 nF) and detubulated with hyperosmolar shock are well suited for TEV studies. Despite the length/diameter ratio of ∼10, space clamp is quite good because the relatively large diameter compared to an axon results in an effective electrical length for the entire fibre of 0.2λ–0.3λ under resting conditions. During the large conductance increase that occurs with Na+ channel activation, space clamp of the membrane potential remains good, provided the peak ionic current is <150 nA. In practice, the two experimentally controllable parameters that are most critical to obtain accurate TEV recordings from detubulated short muscle fibres are the clamp quality at the site of electrode impalement and limiting the amplitude of the peak ionic current. The settling time of the voltage clamp at x= 0 should be <100 μs (Fig. 5), which requires a high-compliance amplifier and minimization of the resistance for the current injection pathway. Faster clamp speeds will not improve performance because the intrinsic low-pass properties of the fibre have an effective time constant of 25–50 μs. If the clamp time constant is >100 μs, then the greatest errors are an underestimate of peak current amplitude and prolonged latency to peak (Fig. 5B and Ruben et al. 1997). Additional caution is warranted for determination of the reversal potential by linear extrapolation (Fig. 5C), which has an apparent rightward (depolarized) shift. Surprisingly, the parameter estimates for the midpoint and slope of voltage-dependent activation are relatively unaffected even for clamp time constants up to 200 μs. Peak ionic current, studied herein by changing the concentration of the permeant ion, must be constrained to <150 nA (equivalent to [Na+] < ∼25 mm) or the axial resistance of the fibre will lead to ‘escape’ from the voltage clamp at the distal ends (Fig. 4B). With regard to fibre length, voltage control is well maintained up to fibre lengths of about 600 μm (again, provided the peak ionic current <150 nA). Simulations show that estimates for the midpoint of activation from the peak I–V relation are within 1 mV of the true value (Fig. 7, lower left). When the fibre length exceeds 600 μm, there is an apparent hyperpolarized (left) shift for the voltage dependence of activation, which also becomes steeper (smaller k) and has a lower apparent peak conductance.
The gating properties of Na+ currents reported herein provide an important benchmark. These data were recorded under conditions of minimal disruption of the internal milieu (by using sharp microelectrodes instead of cut fibres or patch pipette) in fully differentiated fibres and with excellent voltage-clamp control (detubulation and low external [Na+] to reduce series resistance errors). Moreover, slow inactivation was characterized in addition to the conventional measures of activation and fast inactivation. Model simulations of fibre excitability in mammalian muscle and quantitative analyses to explore the functional impact of Na+ channel mutations in myotonia and periodic paralysis should be based on these data rather than the properties observed in HEK cells. Finally, these data provide normative controls for Na+ currents in the mouse which has become the preferred species for mammalian studies due to the opportunities for genetic manipulation.
Acknowledgments
We thank Hillery Gray for providing technical support for animal care. Dr Fenfen Wu assisted with the NaV1.5 expression studies. This work was supported by NIAMS of the NIH (AR42703) and the Muscular Dystrophy Association. The authors have no financial conflicts to disclose in relation to this work.
Glossary
Abbreviations
- BTS
N-benzyl-p-toluene sulphonamide
- HEK
human embryonic kidney cell line
- NaV1.4
skeletal muscle isoform of the voltage-gated sodium channel
- NaV1.5
cardiac isoform of the voltage-gated sodium channel
- TEV
two-electrode voltage clamp
Author contributions
This work was completed in Professor Cannon's laboratory at UT Southwestern Medical Center. The conception and design of the experiments were led by S.C. and A.S. Data collection and analysis were performed by Y.F. V.M. developed the Mathematica programs, and simulations were analysed by V.M., S.C. and A.S. S.C. wrote the paper with editorial input from all authors. All authors approved the final version.
Supplementary material
Supplemental Figure 1.
Supplemental Figure 2.
Supplemental Figure 3.
As a service to our authors and readers, this journal provides supporting information supplied by the authors. Such materials are peer-reviewed and may be re-organized for online delivery, but are not copy-edited or typeset. Technical support issues arising from supporting information (other than missing files) should be addressed to the authors
References
- Adrian RH, Chandler WK, Hodgkin AL. Voltage clamp experiments in striated muscle fibres. J Physiol. 1970;208:607–644. doi: 10.1113/jphysiol.1970.sp009139. [DOI] [PMC free article] [PubMed] [Google Scholar]
- Adrian RH, Marshall MW. Sodium currents in mammalian muscle. J Physiol. 1977;268:223–250. doi: 10.1113/jphysiol.1977.sp011855. [DOI] [PMC free article] [PubMed] [Google Scholar]
- Afshari FS, Ptak K, Khaliq ZM, Grieco TM, Slater NT, McCrimmon DR, Raman IM. Resurgent Na currents in four classes of neurons of the cerebellum. J Neurophysiol. 2004;92:2831–2843. doi: 10.1152/jn.00261.2004. [DOI] [PubMed] [Google Scholar]
- Aldrich RW, Corey DP, Stevens CF. A reinterpretation of mammalian sodium channel gating based on single channel recording. Nature. 1983;306:436–441. doi: 10.1038/306436a0. [DOI] [PubMed] [Google Scholar]
- Almers W, Roberts WM, Ruff RL. Voltage clamp of rat and human skeletal muscle: measurements with an improved loose-patch technique. J Physiol. 1984;347:751–768. doi: 10.1113/jphysiol.1984.sp015094. [DOI] [PMC free article] [PubMed] [Google Scholar]
- Aman TK, Grieco-Calub TM, Chen C, Rusconi R, Slat EA, Isom LL, Raman IM. Regulation of persistent Na current by interactions between β subunits of voltage-gated Na channels. J Neurosci. 2009;29:2027–2042. doi: 10.1523/JNEUROSCI.4531-08.2009. [DOI] [PMC free article] [PubMed] [Google Scholar]
- Beam KG, Knudson CM. Calcium currents in embryonic and neonatal mammalian skeletal muscle. J Gen Physiol. 1988;91:781–798. doi: 10.1085/jgp.91.6.781. [DOI] [PMC free article] [PubMed] [Google Scholar]
- Bendahhou S, Cummins TR, Tawil R, Waxman SG, Ptacek LJ. Activation and inactivation of the voltage-gated sodium channel: role of segment S5 revealed by a novel hyperkalaemic periodic paralysis mutation. J Neurosci. 1999;19:4762–4771. doi: 10.1523/JNEUROSCI.19-12-04762.1999. [DOI] [PMC free article] [PubMed] [Google Scholar]
- Bouhours M, Sternberg D, Davoine CS, Ferrer X, Willer JC, Fontaine B, Tabti N. Functional characterization and cold sensitivity of T1313A, a new mutation of the skeletal muscle sodium channel causing paramyotonia congenita in humans. J Physiol. 2004;554:635–647. doi: 10.1113/jphysiol.2003.053082. [DOI] [PMC free article] [PubMed] [Google Scholar]
- Campbell DT, Hille B. Kinetic and pharmacological properties of the sodium channel of frog skeletal muscle. J Gen Physiol. 1976;67:309–323. doi: 10.1085/jgp.67.3.309. [DOI] [PMC free article] [PubMed] [Google Scholar]
- Cannon SC. Pathomechanisms in channelopathies of skeletal muscle and brain. Annu Rev Neurosci. 2006;29:387–415. doi: 10.1146/annurev.neuro.29.051605.112815. [DOI] [PubMed] [Google Scholar]
- Carle T, Lhuillier L, Luce S, Sternberg D, Devuyst O, Fontaine B, Tabti N. Gating defects of a novel Na+ channel mutant causing hypokalemic periodic paralysis. Biochem Biophys Res Commun. 2006;348:653–661. doi: 10.1016/j.bbrc.2006.07.101. [DOI] [PubMed] [Google Scholar]
- Carlsen RC, Larson DB, Walsh DA. A fast-twitch oxidative-glycolytic muscle with a robust inward calcium current. Can J Physiol Pharmacol. 1985;63:958–965. doi: 10.1139/y85-158. [DOI] [PubMed] [Google Scholar]
- Chahine M, Deschene I, Chen LQ, Kallen RG. Electrophysiological characteristics of cloned skeletal and cardiac muscle sodium channels. Am J Physiol Heart Circ Physiol. 1996;271:H498–H506. doi: 10.1152/ajpheart.1996.271.2.H498. [DOI] [PubMed] [Google Scholar]
- Cheung A, Dantzig JA, Hollingworth S, Baylor SM, Goldman YE, Mitchison TJ, Straight AF. A small-molecule inhibitor of skeletal muscle myosin II. Nat Cell Biol. 2002;4:83–88. doi: 10.1038/ncb734. [DOI] [PubMed] [Google Scholar]
- Chua M, Betz WJ. Characterization of ion channels on the surface membrane of adult rat skeletal muscle. Biophys J. 1991;59:1251–1260. doi: 10.1016/S0006-3495(91)82340-2. [DOI] [PMC free article] [PubMed] [Google Scholar]
- Cummins TR, Zhou J, Sigworth FJ, Ukomadu C, Stephan M, Ptacek LJ, Agnew WS. Functional consequences of a Na+ channel mutation causing hyperkalemic periodic paralysis. Neuron. 1993;10:667–678. doi: 10.1016/0896-6273(93)90168-q. [DOI] [PubMed] [Google Scholar]
- Desaphy JF, Pierno S, Leoty C, George AL, Jr, De Luca A, Camerino DC. Skeletal muscle disuse induces fibre type-dependent enhancement of Na+ channel expression. Brain. 2001;124:1100–1113. doi: 10.1093/brain/124.6.1100. [DOI] [PubMed] [Google Scholar]
- Dulhunty AF, Gage PW. Differential effects of glycerol treatment on membrane capacity and excitation–contraction coupling in toad sartorius fibres. J Physiol. 1973;234:373–408. doi: 10.1113/jphysiol.1973.sp010350. [DOI] [PMC free article] [PubMed] [Google Scholar]
- Duval A, Leoty C. Ionic currents in mammalian fast skeletal muscle. J Physiol. 1978;278:403–423. doi: 10.1113/jphysiol.1978.sp012312. [DOI] [PMC free article] [PubMed] [Google Scholar]
- Duval A, Leoty C. Ionic currents in slow twitch skeletal muscle in the rat. J Physiol. 1980;307:23–41. doi: 10.1113/jphysiol.1980.sp013421. [DOI] [PMC free article] [PubMed] [Google Scholar]
- Filatov GN, Pinter MJ, Rich MM. Resting potential-dependent regulation of the voltage sensitivity of sodium channel gating in rat skeletal muscle in vivo. J Gen Physiol. 2005;126:161–172. doi: 10.1085/jgp.200509337. [DOI] [PMC free article] [PubMed] [Google Scholar]
- Hayward LJ, Brown RH, Jr, Cannon SC. Inactivation defects caused by myotonia-associated mutations in the sodium channel III-IV linker. J Gen Physiol. 1996;107:559–576. doi: 10.1085/jgp.107.5.559. [DOI] [PMC free article] [PubMed] [Google Scholar]
- Hayward LJ, Brown RH, Jr, Cannon SC. Slow inactivation differs among mutant Na channels associated with myotonia and periodic paralysis. Biophys J. 1997;72:1204–1219. doi: 10.1016/S0006-3495(97)78768-X. [DOI] [PMC free article] [PubMed] [Google Scholar]
- Hayward LJ, Kim JS, Lee MY, Zhou H, Kim JW, Misra K, et al. Targeted mutation of mouse skeletal muscle sodium channel produces myotonia and potassium-sensitive weakness. J Clin Invest. 2008;118:1437–1449. doi: 10.1172/JCI32638. [DOI] [PMC free article] [PubMed] [Google Scholar]
- Hille B, Campbell DT. An improved vaseline gap voltage clamp for skeletal muscle fibers. J Gen Physiol. 1976;67:265–293. doi: 10.1085/jgp.67.3.265. [DOI] [PMC free article] [PubMed] [Google Scholar]
- Hodgkin AL, Huxley AF. A quantitative description of membrane current and its application to conduction and excitation in nerve. J Physiol. 1952;117:500–544. doi: 10.1113/jphysiol.1952.sp004764. [DOI] [PMC free article] [PubMed] [Google Scholar]
- Hodgkin AL, Rushton WA. The electrical constants of a crustacean nerve fibre. Proc R Soc Med. 1946;133:444–479. doi: 10.1098/rspb.1946.0024. [DOI] [PubMed] [Google Scholar]
- Kuo C, Bean BP. Sodium channels must deactivate to recover from inactivation. Neuron. 1994;12:819–829. doi: 10.1016/0896-6273(94)90335-2. [DOI] [PubMed] [Google Scholar]
- Kuo CC, Liao SY. Facilitation of recovery from inactivation by external Na+ and location of the activation gate in neuronal Na+ channels. J Neurosci. 2000;20:5639–5646. doi: 10.1523/JNEUROSCI.20-15-05639.2000. [DOI] [PMC free article] [PubMed] [Google Scholar]
- Lehmann-Horn F, Rüdel R, Dengler R, Lorkovic H, Haass A, Ricker K. Membrane defects in paramyotonia congenita with and without myotonia in a warm environment. Muscle Nerve. 1981;4:396–406. doi: 10.1002/mus.880040508. [DOI] [PubMed] [Google Scholar]
- Lueck JD, Mankodi A, Swanson MS, Thornton CA, Dirksen RT. Muscle chloride channel dysfunction in two mouse models of myotonic dystrophy. J Gen Physiol. 2007;129:79–94. doi: 10.1085/jgp.200609635. [DOI] [PMC free article] [PubMed] [Google Scholar]
- Maurice N, Tkatch T, Meisler M, Sprunger LK, Surmeier DJ. D1/D5 dopamine receptor activation differentially modulates rapidly inactivating and persistent sodium currents in prefrontal cortex pyramidal neurons. J Neurosci. 2001;21:2268–2277. doi: 10.1523/JNEUROSCI.21-07-02268.2001. [DOI] [PMC free article] [PubMed] [Google Scholar]
- Mille M, Koenig X, Zebedin E, Uhrin P, Cervenka R, Todt H, Hilber K. Sodium current properties of primary skeletal myocytes and cardiomyocytes derived from different mouse strains. Pflugers Arch. 2009;457:1023–1033. doi: 10.1007/s00424-008-0570-x. [DOI] [PMC free article] [PubMed] [Google Scholar]
- Moore JW, Ramon F, Joyner RW. Axon voltage-clamp simulations. I. Methods and tests. Biophys J. 1975;15:11–24. doi: 10.1016/S0006-3495(75)85788-2. [DOI] [PMC free article] [PubMed] [Google Scholar]
- Pappone PA. Voltage-clamp experiments in normal and denervated mammalian skeletal muscle fibres. J Physiol. 1980;306:377–410. doi: 10.1113/jphysiol.1980.sp013403. [DOI] [PMC free article] [PubMed] [Google Scholar]
- Poindessault JP, Duval A, Leoty C. Voltage clamp with double sucrose gap technique. External series resistance compensation. Biophys J. 1976;16:105–120. doi: 10.1016/s0006-3495(76)85668-8. [DOI] [PMC free article] [PubMed] [Google Scholar]
- Probstle T, Rudel R, Ruppersberg JP. Hodgkin-Huxley parameters of the sodium channels in human myoballs. Pflugers Arch. 1988;412:264–269. doi: 10.1007/BF00582507. [DOI] [PubMed] [Google Scholar]
- Qu Y, Curtis R, Lawson D, Gilbride K, Ge P, DiStefano PS, Silos-Santiago I, Catterall WA, Scheuer T. Differential modulation of sodium channel gating and persistent sodium currents by the β1, β2, and β3 subunits. Mol Cell Neurosci. 2001;18:570–580. doi: 10.1006/mcne.2001.1039. [DOI] [PubMed] [Google Scholar]
- Raman IM, Sprunger LK, Meisler MH, Bean BP. Altered subthreshold sodium currents and disrupted firing patterns in Purkinje neurons of Scn8a mutant mice. Neuron. 1997;19:881–891. doi: 10.1016/s0896-6273(00)80969-1. [DOI] [PubMed] [Google Scholar]
- Rannou F, Droguet M, Giroux-Metges MA, Pennec Y, Gioux M, Pennec JP. Differences in sodium voltage-gated channel properties according to myosin heavy chain isoform expression in single muscle fibres. J Physiol. 2009;587:5249–5258. doi: 10.1113/jphysiol.2009.176446. [DOI] [PMC free article] [PubMed] [Google Scholar]
- Rich MM, Pinter MJ. Crucial role of sodium channel fast inactivation in muscle fibre inexcitability in a rat model of critical illness myopathy. J Physiol. 2003;547:555–566. doi: 10.1113/jphysiol.2002.035188. [DOI] [PMC free article] [PubMed] [Google Scholar]
- Ruben PC, Fleig A, Featherstone D, Starkus JG, Rayner MD. Effects of clamp rise-time on rat brain IIA sodium channels in Xenopus oocytes. J Neurosci Methods. 1997;73:113–122. doi: 10.1016/s0165-0270(96)02216-9. [DOI] [PubMed] [Google Scholar]
- Ruff RL. Insulin acts in hypokalemic periodic paralysis by reducing inward rectifier K+ current. Neurology. 1999;53:1556–1563. doi: 10.1212/wnl.53.7.1556. [DOI] [PubMed] [Google Scholar]
- Ruff RL, Simoncini L, Stuhmer W. Slow sodium channel inactivation in mammalian muscle: a possible role in regulating excitability. Muscle Nerve. 1988;11:502–510. doi: 10.1002/mus.880110514. [DOI] [PubMed] [Google Scholar]
- Ruff RL, Whittlesey D. Na+ current densities and voltage dependence in human intercostal muscle fibres. J Physiol. 1992;458:85–97. doi: 10.1113/jphysiol.1992.sp019407. [DOI] [PMC free article] [PubMed] [Google Scholar]
- Stein P, Palade P. Patch clamp of sacrolemmal spheres from stretched skeletal muscle fibres. Am J Physiol Cell Physiol. 1989;256:C434–C440. doi: 10.1152/ajpcell.1989.256.2.C434. [DOI] [PubMed] [Google Scholar]
- Stuhmer W, Almers W. Photobleaching through glass micropipettes: sodium channels without lateral mobility in the sarcolemma of frog skeletal muscle. Proc Nat Acad Sci U S A. 1982;79:946–950. doi: 10.1073/pnas.79.3.946. [DOI] [PMC free article] [PubMed] [Google Scholar]
- Takahashi MP, Cannon SC. Enhanced slow inactivation by V445M: a sodium channel mutation associated with myotonia. Biophys J. 1999;76:861–868. doi: 10.1016/S0006-3495(99)77249-8. [DOI] [PMC free article] [PubMed] [Google Scholar]
- Townsend C, Horn R. Effect of alkali metal cations on slow inactivation of cardiac Na+ channels. J Gen Physiol. 1997;110:23–33. doi: 10.1085/jgp.110.1.23. [DOI] [PMC free article] [PubMed] [Google Scholar]
- Wang ZM, Messi ML, Delbono O. Patch-clamp recording of charge movement, Ca2+ current, and Ca2+ transients in adult skeletal muscle fibers. Biophys J. 1999;77:2709–2716. doi: 10.1016/s0006-3495(99)77104-3. [DOI] [PMC free article] [PubMed] [Google Scholar]
- Webb J, Wu FF, Cannon SC. Slow inactivation of the NaV1.4 sodium channel in mammalian cells is impeded by co-expression of the β1 subunit. Pflugers Arch. 2009;457:1253–1263. doi: 10.1007/s00424-008-0600-8. [DOI] [PMC free article] [PubMed] [Google Scholar]
- Wu FF, Gordon E, Hoffman EP, Cannon SC. A C-terminal skeletal muscle sodium channel mutation associated with myotonia disrupts fast inactivation. J Physiol. 2005;565:371–380. doi: 10.1113/jphysiol.2005.082909. [DOI] [PMC free article] [PubMed] [Google Scholar]
- Yang JS, Sladky JT, Kallen RG, Barchi RL. TTX-sensitive and TTX-insensitive sodium channel mRNA transcripts are independently regulated in adult skeletal muscle after denervation. Neuron. 1991;7:421–427. doi: 10.1016/0896-6273(91)90294-a. [DOI] [PubMed] [Google Scholar]
- Yang N, Ji S, Zhou M, Ptacek LJ, Barchi RL, Horn R, George AL., Jr Sodium channel mutations in paramyotonia congenita exhibit similar biophysical phenotypes in vitro. Proc Nat Acad Sci U S A. 1994;91:12785–12789. doi: 10.1073/pnas.91.26.12785. [DOI] [PMC free article] [PubMed] [Google Scholar]
- Yu FH, Mantegazza M, Westenbroek RE, Robbins CA, Kalume F, Burton KA, Spain WJ, McKnight GS, Scheuer T, Catterall WA. Reduced sodium current in GABAergic interneurons in a mouse model of severe myoclonic epilepsy in infancy. Nat Neurosci. 2006;9:1142–1149. doi: 10.1038/nn1754. [DOI] [PubMed] [Google Scholar]
Associated Data
This section collects any data citations, data availability statements, or supplementary materials included in this article.