

Abstract
Oscillations in the primary motor cortex are transmitted through the corticospinal tract to the motoneuron pool. This transmission has been previously investigated using coherence analysis between concurrent recordings of EEG and surface EMG signals. In this study we used a mathematical derivation and motor unit recordings in vivo to investigate the origin of linear transmission of cortical input to the motoneuron spike trains (neural drive to muscle). The theoretical derivation showed that a common input spread to a relatively small number of motoneurons is partly transmitted in a linear way, overcoming the interference signal generated by the non-linearity of the individual motoneurons. We further calculated the corticomuscular coherence between experimental EEG signals and the cumulative spike trains of motor units in the abductor digiti minimi muscle of seven healthy men. The experimental results indicated that, on average, only four to five motor units were sufficient to reach the same level of coherence as estimated from the surface EMG. The results demonstrate that linearity in the transmission of the cortical input to motoneurons through the corticospinal tract is achieved because (i) this input is largely common to all motoneurons, and (ii) its frequency content requires only a small fraction of active motoneurons to be accurately sampled. In this way, the central nervous system can directly transmit oscillations to the control signals to muscles for practically the entire range of functionally relevant forces.
Non-technical summary
Since the human central nervous system controls muscle contraction through inputs to spinal motoneurons, oscillations recorded on the primary motor cortex during voluntary movements are correlated with the electrical activity produced on the surface of the muscles. We show through theoretical derivations and experimental recordings that cortical input is transmitted partly in a linear way to the population of motoneurons. The results demonstrate the effective spread of the cortical projections to the motoneuron pool to allow an efficient control of the muscle force output.
Introduction
Direct and indirect pathways from the motor cortex to the spinal motoneurons are necessary for the precise control of muscle contractions (Lemon, 2008). Oscillations at ∼20 Hz in the electroencephalogram (EEG) in humans (Conway et al. 1995; Pfurtscheller & Lopes da Silva, 1999) are coherent with the surface electromyogram (EMG) during sustained contractions, which is referred to as corticomuscular coherence (Salenius et al. 1997; Halliday et al. 1998). This observation indirectly indicates the effective transmission of cortical activity through the corticospinal tract and the monosynaptic connections between cortical neurons and spinal motoneurons (de Noordhout et al. 1999; Baker et al. 2003). Changes in corticomuscular coupling have been identified in pathological conditions (Grosse et al. 2002), such as stroke (Strens et al. 2004; Fang et al. 2009) and during tremor (Volkmann et al. 1996; Salenius et al. 2002; Raethjen et al. 2009), and in healthy subjects during fatigue (Tecchio et al. 2006; Yang et al. 2009), peripheral nerve stimulation (Hansen & Nielsen, 2004), and alterations of afferent pathways (Pohja & Salenius, 2003; Riddle & Baker, 2005). Since it is revealed by a linear technique, the presence of corticomuscular coherence also indicates that the transmission of cortical input to the motoneuron output is partly linear, despite the non-linearity of the motoneuron transfer function. The reasons and limits of linear transmission in this system have however not been investigated extensively.
The transfer function of single motoneurons limits the response time to fast changing transient inputs to determine relatively low discharge rates at moderate contraction levels (Heckman & Enoka, 2004). Therefore, the input signal is under-sampled by individual motoneurons. However, the concurrent activation of several motoneurons discharging asynchronously increases the sampling rate. An effective increase in sampling rate occurs if the same input is largely common to all motoneurons and if a sufficient number of motoneurons is activated. Since accurate transmission of cortical input to motoneurons is likely to be important in the performance of fine motor tasks (Lawrence & Kuypers, 1968), including tasks at relatively low forces which correspond to the activation of a small number of motoneurons, it is expected that the number of motoneurons needed for accurate transmission should be small (Halliday, 2000; Baker et al. 2003), although this issue has not been previously addressed.
In this study, we hypothesize that linearity in the transmission of cortical inputs to the neural drive to muscles (output of motoneurons) is made possible by two characteristics of this transmission system: (i) the cortical input is largely common to all motoneurons, and (ii) the frequency content of the input requires only a small fraction of motoneurons to be accurately sampled. We test for these hypotheses with an approach that includes a theoretical derivation and experimental recordings of EEG and individual motor unit spike trains in humans.
Methods
The approach is based on providing a theoretical derivation of the frequency content of the output of an ensemble of motoneurons that receive sinusoidal inputs. Moreover, we provide results on concurrent EEG and motor unit recordings in humans.
Motor neuron output with sinusoidal inputs
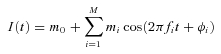
Under simplified conditions, we show analytically that a common input to a population of motoneurons can be transmitted in an approximately linear way if the number of active motoneurons is sufficiently large. In this theoretical derivation, each motoneuron is assumed to be a perfect integrate-and-fire (PIF) neuron. We further assume that the common input signal is described by a sum of M sinusoidal signals:
 |
(1) |
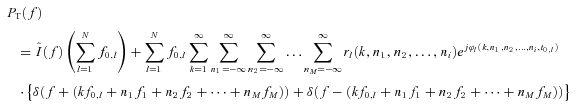
where m0 is the mean value of the input, mi the amplitudes of the M input sinusoids, fi the frequencies of the sinusoids, and ϕi the corresponding phases. Using the expressions for the integral pulse frequency modulation (IPFM) process derived by (Bayly (1968) and (Nakao et al. (1997) and extending them to N neurons, we obtain the output power spectrum PT(f) for the cumulative spike train of a pool of N motoneurons:
 |
(2) |
where  is the Fourier transform of the input signal in eqn (1), f0,l is the discharge rate of the l-th motoneuron, fi are the frequencies of the M input sinusoids, r(k, n1, n2, …, nM) and ϕ (k, n1, n2, …, nM, t0,l) are the modulus and the phase of harmonics components in the output at the frequencies fI=kf0+n1f1+n2f2+·+nMfM (interfering harmonics generated by the non-linearity of the system), and δ is the delta Dirac function, that represents a sinusoid in the Fourier domain (pure spectral line). The phase of each harmonics depends on t0,l, which is the time instant of the first spike in the train of action potentials of the l-th motoneuron and can thus be assumed random. The first term of the expression (2) is the amplitude spectrum of N motoneuron spike trains responding to the input (1) and has components at the frequencies fi (input frequencies), with a strength proportional to the sum of the discharge rates of the motoneurons (
 ), which represents the total output drive to the muscle. This first term thus represents the part of the input signal that is transmitted in a linear way to the output and it will be referred to as linear term. The second term of eqn (2) is an interference term that contains an infinite number of harmonics (spectral lines represented by the Dirac delta functions) whose frequencies depend on the motoneuron discharge rates and on the frequencies of the input sinusoids. The amplitude and phase of each of the harmonics in the second term are described by r and ϕ, whose expressions can be found in Nakao et al. (1997). The second term in the eqn (2) represents the non-linear part of the output signal since it is not proportional, in the frequency domain, to the input.
Equation (2) shows that the linear part of the output signal has power that increases linearly with the number of spikes since  represents the total number of spikes discharged per second. Conversely, the non-linear term has power that is spread over several frequencies and is not proportional to the number of discharged spikes.
Experimental analysis
Subjects
Seven healthy men participated in the experiment (mean ±s.d., age: 26.6 ± 3.4 years; range, 24–32 years). The experiments were conducted in accordance with the Declaration of Helsinki and approved by the ethics committee (approval number N-20090019). All participants self-reported to be right handed and signed a written informed consent form before inclusion.
Recordings
EEG signals were recorded with a 40-channel digital DC EEG amplifier (NuAmps; Compumedics Neuroscan, Charlotte, NC, USA). Tin electrodes were mounted in a standard EEG cap (Electro-Cap International, Inc., Eaton, OH, USA) according to the 10–20 system and the electrodes at location C3 and FC3 were used for recording (Fig. 1A). The EEG recordings were referenced to one tin electrode at the left mastoid and grounded on the forehead. Two tin electrodes were used for electrooculographic (EOG) recordings, one positioned above and the other on the outer canthi of the left eye. The EEG/EOG signals were band-pass filtered (0.1–100 Hz) and digitized at 1000 Hz using a 22-bit A/D converter.
Figure 1. Example of raw data and decomposition of experimental intramuscular EMG recordings.
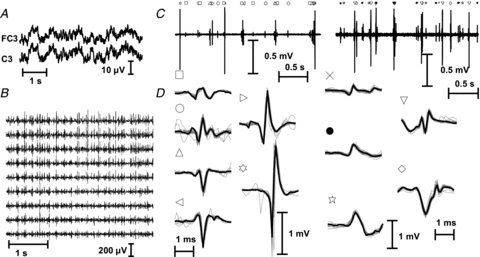
A, EEG signals recorded from two electrodes placed over the motor cortex. B, multichannel surface EMG signal detected with nine bipolar electrodes. C, intramuscular EMG signals. The two intramuscular traces are the signals recorded from each of the two pairs of wire electrodes. The symbols over the intramuscular traces indicate a discharge of a motor unit, whose action potentials are also shown (D). The contraction force was 5% MVC. D, action potential shapes for the 11 motor units that were identified in this contraction.
Single motor unit action potentials were recorded from the abductor digiti minimi muscle with Teflon-coated stainless steel wires (diameter 0.1 mm; A-M Systems, Carlsborg, WA, USA) inserted into the muscle with 25-gauge hypodermic needles. To increase the sampling size of the motor unit population, two pairs of wires were placed approximately 1 cm apart in the transverse direction in the proximal portion of the muscle. The needles were inserted and removed after the insertion, leaving the wires inside the muscle. Each wire was cut to expose the cross section of the tip without insulation. The two bipolar intramuscular EMG signals were amplified (Counterpoint EMG, Dantec Medical, Skovlunde, Denmark), band-pass filtered (500 Hz to 5 kHz), and sampled at 10 kHz. The position of the wires was slightly adjusted before starting the recordings and when the signal quality was poor, which occurred rarely, a new pair of wires was inserted.
Surface EMG signals were recorded using an array of nine electrodes (1 mm diameter, 2.5 mm interelectrode distance) in bipolar derivation (Aalborg University, Denmark, and Politecnico di Torino, Italy). The array of electrodes was placed on the muscle belly. Before the placement of the electrodes, the skin was lightly abraded using abrasive paste (Meditec-Every, Parma, Italy) and cleansed afterwards. The surface EMG signal was amplified as one bipolar recording along the direction of the fibres (LISiN-OT Bioelettronica, Torino, Italy), band-pass filtered (3 dB bandwidth, 10–500 Hz), and sampled at 2048 Hz by a 12 bit A/D converter (Fig. 1B).
Procedures
The subject was seated on an adjustable chair with the right arm extended in a force brace (Aalborg University). The fifth finger was fixed in the isometric device for the measurement of finger-abduction forces. The forearm and the four digits were secured with Velcro straps. The force produced by the fifth finger was measured using two force transducers (Interface Inc., Scottsdale, AZ, USA), one in the transverse plane (abduction force) and the other in the sagittal plane (flexion force). The force signal was sampled at 10 kHz. Visual feedback on the finger abduction force was provided on an oscilloscope.
The subjects performed three maximal voluntary contractions (MVCs) of finger abduction with a rest of 2 min in between. The maximum force achieved during the maximal contractions was considered as the reference MVC. The electrodes for EEG and EMG recording were then mounted, as described above. The subject performed five contractions of 60 s duration at 5% MVC with a pause of 5 min between contractions. The subject had visual feedback on force during the contractions and was asked to maintain the target force level as stable as possible. During each contraction, the flexion force was monitored and contractions with flexion force higher than 1% of the force generated during the MVC attempt were repeated.
Experimental signal analysis
The EEG signals were digitally band-pass filtered (0.5–40 Hz) and the bipolar derivation between the electrodes C3 and FC3 was calculated from the raw signals referenced to the left mastoid. Ocular and muscular artefacts were visually monitored and time intervals of the EEG recordings influenced by these artefacts were excluded from further analysis.
Individual motor units were identified from the intramuscular EMG signals recorded from the two locations in the muscle by the use of a decomposition algorithm (McGill et al. 2005). This interactive algorithm (EMGLAB) includes a user interface for manually editing and verifying the correctness of the spike trains. The EMGLAB displays a segment of the intramuscular EMG signal, the averaged templates of the action potentials of the detected motor units, their discharge patterns, and a close-up of the signal for resolving missed discharges and superimpositions. Each motor unit spike train was edited using this visual interface by an experienced operator and any unusually long (>250 ms) or short (<20 ms) inter-spike intervals (ISIs) were manually inspected for checking potential discrimination errors. An example of the decomposition is shown in Fig. 1C and D. From the results of the decomposition, spike trains of individual motor units were calculated with a sampling rate of 1000 Hz. The composite spike train (CST) was defined as the sum of the individual spike trains, as for the simulated signals. The intramuscular spike trains obtained from EMG decomposition were filtered in the bandwidth 0.5–40 Hz in order to match the bandwidth of the EEG signals.
The surface EMG signals were digitally band-pass filtered (10–500 Hz). From the array of nine electrodes, two bipolar derivations were extracted, corresponding to interelectrode distances of 2.5 mm and 20 mm. The two interelectrode distances corresponded to different selectivity of the recording.
The CST of the motoneuron output was derived for the experimental data. The corticomuscular coherence was calculated from the cross-spectra of the EEG and the CST. The five recording segments were divided in intervals of 1 s duration from which the power spectra were estimated (periodogram with Hanning window of 1 s duration and frequency resolution of 0.5 Hz, achieved by zero-padding). The confidence limit for coherence values was computed as described by Rosenberg et al. (1989) and the coherence level was considered significant when above the 95% confidence limit. To analyse the changes in the magnitude of coherence as a function of the number of spike trains, the CST was calculated adding different numbers of motor unit spike trains. All possible combinations of motor unit spike trains were investigated and the resulting coherence values were averaged across each group of combinations.
For comparisons between subjects in the experimental recordings, the corticomuscular coherence values were z-transformed as described in (Rosenberg et al. 1989; Amjad et al. 1989).
Statistical analysis
Comparison of coherence values was performed, after the z-transformation, by Student's paired t test. Significance was accepted for P values smaller than 0.05. Data are reported as means and s.d.
Results
Motor neuron output with sinusoidal inputs
The analytical expression of the power spectrum of the output of a pool of motoneurons that receive sinusoidal input (eqn (2)) indicates that, in addition to the linear term, the output signal also contains an infinite number of harmonics, which constitute the non-linear term. The non-linear term may contain spectral lines in the frequency bandwidth of the input and may thus interfere with the linear term when in opposition of phase (the phase of the harmonics of the non-linear term can be considered random since it depends on the random distribution of time instants of the first discharges in the spike trains). However, if the linear term has greater power than the non-linear term, it cannot be fully cancelled by the non-linear term and at least a part of the input is transmitted linearly. This condition depends on the total number of spikes, since the power of the linear term is directly associated to the sum of the motoneuron discharge rates (eqn (2)) (this is another way of interpreting the sampling process; see Terzuolo & Bayly, 1968). When the number of active motoneurons is sufficiently large, the transmission becomes practically linear, i.e. the input term in the motoneuron output is much larger than the non-linear term. This can be interpreted as a saturation in the ability of a set of motoneurons to linearly transmit the input.
Figure 2 shows the effect of the population size on the transmission efficiency by comparing the power in the output at the frequency of the input and the power of the non-linear term for increasing number of motoneurons, according to eqn (2). For relatively few motoneurons, the power at the input frequency becomes greater than the sum of the powers at all other frequencies. At this point, the input is transmitted at least partly linearly since full cancellation by the non-linear term is not possible. Figure 2 thus shows that a relatively small set of motoneurons is sufficient for partial linear transmission of the input.
Figure 2. Power of the linear (continuous line) and of the non-linear (dashed line) term ineqn (2), as a function of the number of motoneurons.
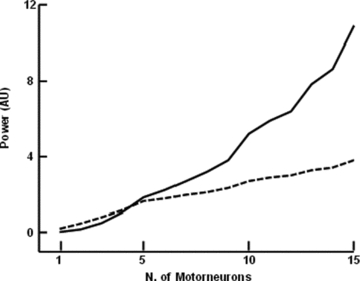
In this example, the input signal is the sum of three sinusoids. The parameters fi, f0,l, t0,l in eqn (2) were chosen randomly from uniform distributions in the ranges 10–30 Hz, 8–30 pps, and 20 ms – , respectively. The parameter k was limited to 100 and –3 ≤ni≤ 3 for truncating the series in eqn (2). With more than 4 motoneurons, the power of the linear term was greater than that of the non-linear term.
Experimental results
The average number of segments not influenced by EEG artifacts and with stable discharge rates of the active motor units was 156 ± 42 (∼65% of the total) per subject. The average number of motor units whose discharge pattern was identified with high accuracy was 8 ± 3, with an average discharge rate of 10.4 ± 1.2 pps (pulses per second) (Table 1).
Table 1.
Motor unit characteristics for the 7 subjects, averaged over the five contractions
| P. COH CST | P. COH REMG | ||||
|---|---|---|---|---|---|
| N. MU | DR | Freq | COH | Freq | COH |
| Sub. 1 5 | 8.3 ± 0.4 | 23.5 | 0.13 | 15 | 0.08 |
| Sub. 2 9 | 9.3 ± 0.5 | 13.5 | 0.06 | 13.5 | 0.05 |
| Sub. 3 7 | 11.3 ± 0.5 | 20.5 | 0.09 | 20.5 | 0.07 |
| Sub. 4 10 | 10.2 ± 0.9 | 21.5 | 0.09 | 13.5 | 0.09 |
| Sub. 5 5 | 11.9 ± 0.9 | 21.0 | 0.07 | 21.5 | 0.10 |
| Sub. 6 11 | 11.1 ± 2.4 | 20.5 | 0.05 | 19.5 | 0.07 |
| Sub. 7 12 | 10.7 ± 1.8 | 17.5 | 0.14 | 14 | 0.17 |
Values are means ±s.d., n= 7, for five contractions at 5% MVC. N. MU: number of motor units identified in at least one of the five contractions; DR: discharge rate; P COH CST: coherence peak between EEG and the composite spike trains (CST); P COH REMG: coherence peak between EEG and the rectified surface EMG; Freq: peak frequency. COH; peak magnitude.
Figure 3 shows the coherence analysis between EEG and spike trains for the investigated subjects. The comparison with the rectified EMG is reported in Table 1. The coherence spectra were highly variable among subjects, as expected by the theoretical derivation (see Discussion). However, in all subjects the coherence level was significant for both the CST and the surface EMG analysis. Subjects 2, 3, 5 and 6 showed maximum coherence peaks at similar frequencies for the CST and EMG analysis and subject 1 showed one peak at similar frequency for both analyses (Table 1). The spectra from subject 7 had larger variability probably because of the smaller number of segments (89) used in the calculation of coherence with respect to the other subjects. The coherence spectra had peak frequency of 20.1 ± 3.4 Hz with the calculation with CST and 17.3 ± 3.7 Hz with the calculation using the rectified EMG (the values were not significantly different, P= 0.58) when using 2.5 mm interelectrode distance for the EMG recordings. The peak frequency did not change significantly when using an interelectrode distance of 20 mm for the surface EMG recordings (17.9 ± 5.1 Hz; P= 0.8). The average peak coherence value was 5.4 ± 1.3 (z-transformed values) when using the CST, 5.1 ± 1.3 when using the rectified EMG with 2.5 mm interelectrode distance, and 4.3 ± 1.2 for 20 mm interelectrode distance (not statistically different, all P > 0.05).
Figure 3. Estimation of corticomuscular coherence between the EEG signal and the CST, using all the identified motor units for all the subjects.
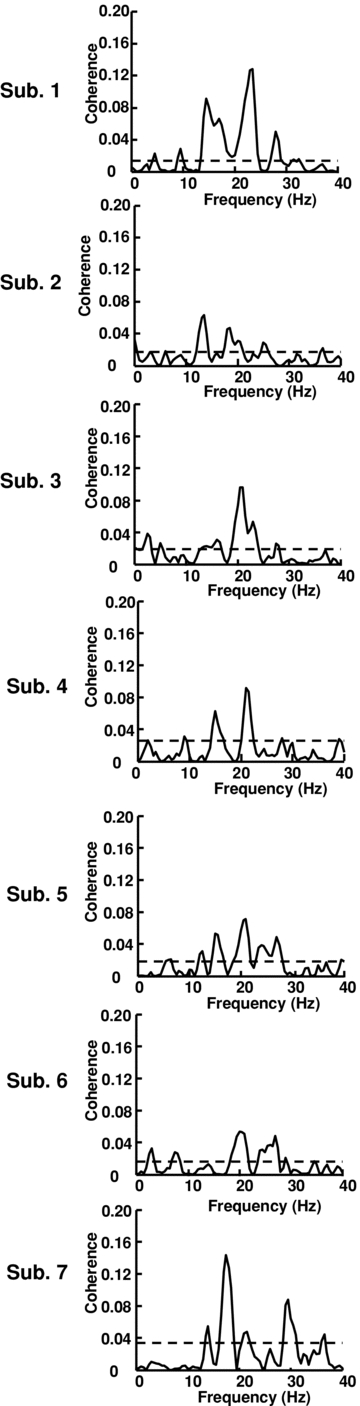
The horizontal line in the coherence plots represents the confidence level according to eqn (2).
To investigate the required sampling, we analysed the level of coherence as a function of the number of spike trains used for calculating the coherence value. Figure 4 shows the dependency of the coherence level on the number of spike trains used in the calculation for a representative subject. The coherence values were calculated for all combinations of the minimum number of motor unit spike trains in all recording segments (5) and then averaged. In this subject, the number of detected motor units was seven and the level of coherence between EEG and CST increased monotonically with increasing the number of spike trains used for the calculation of the CST. However, the increment was progressively smaller with increasing number of motor units. In this example, the peak of coherence at 21 Hz increased by 29.0% when using three motor units with respect to one but the increment was only 15.6% when the number of units was increased from five to seven. The secondary peak of coherence at 23 Hz was not significant using only one motor unit, but it resulted as significant using two or more motor units. The results for the group data were consistent with this observation and showed that using 25% of the identified motor units provided an estimation of the coherence peak value of 51.3 ± 13.5% of the value obtained with the entire pool of detected units; and using 50% of the detected motor units provided a value of 75.1 ± 11.9% of the maximum. For the comparison, the coherence values were z-transformed, as described in Methods. According to the theoretical derivation, this result demonstrates that the sampling process of the motoneurons influences the coherence estimation but that relatively few spike trains provide an accurate estimation of the effective transmission of cortical input to the muscle. Adding more spike trains has a progressively smaller influence on the coherence value. Since the increase in coherence estimation was monotonic for any permutation of motoneuron spike trains used for the calculation, this analysis provides evidence that the cortical contributions are highly spread over the motoneuron pool, as was assumed for the theoretical derivations.
Figure 4. Number of spike trains and corticomuscular coherence in a representative subject.
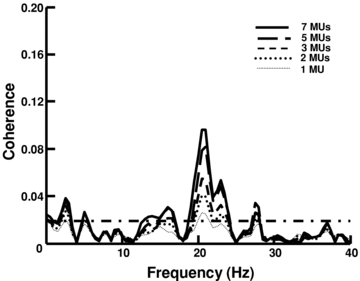
A, corticomuscular coherence in one subject when using 1, 2, 3, 5 and 7 (maximum number of detected motor unit spike trains in the five contraction segments) motor units. The results are averaged over all possible combinations of motor unit spike trains. The horizontal line in the coherence plots represents the confidence level according to eqn (2).
Discussion
In this study we investigated the corticomuscular transmission to the motoneuron pool using a theoretical derivation and single motor unit recordings in humans.
The theoretical result obtained for sinusoidal inputs to a pool of (moto)neurons can be interpreted as a saturation in the ability of a set of motoneurons to linearly transmit the input. A relatively small set of motoneurons is sufficient to transmit the input in the best linear way, with the constraint of the non-linear transfer function of each motoneuron. This result is consistent with the need for precise input transmission in a large range of forces, including levels of force that require the activation of only a relatively small proportion of motoneurons. Note that the theoretical derivation (eqn (2)) has been obtained assuming a common input to all motoneurons. If this condition fails, it is easy to prove that the mathematical formulation and the conclusions obtained do not hold. Therefore, the analytical derivation has shown that if (i) the input to motoneurons is common, and (ii) at least a few motoneurons are active, then the ensemble of motoneuron activity reproduces in an approximately linear way the input. Moreover, adding more motoneurons does not substantially change the degree of linearity in the transmission, and thus different numbers of active motoneurons would provide an almost equal accuracy in the transmission of the input they receive, given that the number of active motoneurons is larger than a (small) threshold value (Fig. 2). This characteristic is presumably relevant for accurate muscle control since the central nervous system can rely on the same type of input transmission for a large range of forces that require different numbers of active motoneurons.
The observation that common input to few (moto)neurons acts as a linearization process for the input/output characteristics may be a feature relevant for transmission of information in other parts of the nervous system, in agreement with previous studies in animals. For example, the decoding of the activity of a population of retinal ganglion cells showed a rapid saturation of the total information extracted using few neurons (Warland et al. 1997). In the auditory system, similar results have been found using multiple spike trains in the auditory receptor neurons (Machens et al. 2001). Baker et al. (2003) showed this concept in the central nervous system of primates and demonstrated that a relatively small population of pyramidal track neurons (PTNs) could transmit the cortical oscillations recorded by local field potentials (LFPs) correctly. Therefore, in different parts of the nervous system, the projection of common inputs to a small array of cells seems to be sufficient to adjust the input/output characteristics, given a non-linearity in each cell, so that transmission becomes at least partly linear.
The experimental results confirmed the conclusions of the theoretical analysis. A significant degree of corticomuscular coherence was found between the CST of the detected motor units and EEG recordings for all subjects (Fig. 3). The variability of the estimation among subjects was high, as also reported previously for EEG/EMG coherence (Pohja et al. 2005), but there was a consistent finding of significant coherence in the frequency band 15–35 Hz (Halliday et al. 1998; Marsden et al. 2000). The overall magnitude of the coherence could also be affected by the high precision demanding task that the subjects performed (Kristeva et al. 2007). Occasionally, peaks at frequencies lower than 15 Hz were also observed, but they were relatively small compared with the overall coherence magnitude and not consistent across all subjects.
The degree of coherence identified using the CST and the rectified surface EMG were not statistically different (Table 1). In two cases there was a substantial difference (subject 4 and subject 7), both in magnitude and peak frequencies of the corticomuscular coherence, but they were also the ones with less artifact free segments available (115 and 89, respectively). One explanation for the large amount of variability found in this and previous studies derives from the theoretical calculations reported in the current study. Corticospinal pathways can be directly (monosynaptically) or indirectly connected to motoneurons. According to eqn (2), the amount of distortion introduced by the non-linear term in a single neuron is considerable compared with the actual amplitude of the input signal. An indirect pathway from the motor cortex to the motoneuron pool will determine the transmission of the non-linear term introduced by the first interneuron to the successive neurons, which will introduce further non-linearity. On the other hand, the amount of excitatory monosynaptic inputs from the motor cortex to the motoneurons is small compared with other direct pathways (Kuypers & Brinkman, 1970; Lemon, 2008), which may explain the large variability and small magnitudes in the corticomuscular coherence measures usually found experimentally.
In agreement with the theoretical analysis, the strength of the corticomuscular coherence from the experimental data depended on the number of spike trains used for the calculation (Fig. 4). This confirms that more than one spike train is necessary for accurate input transmission. Moreover, the value of corticomuscular coherence increased monotonically with increasing the number of spike trains used for the calculation in any permutation. Together with the results of a previous study (Negro et al. 2009), this observation indicates largely spread cortical inputs to the entire population of motoneurons innervating a muscle.
The non-linear term in the output spike trains also contributes to the variability in coherence estimates found experimentally. Moreover, some frequencies (for example the 8–12 Hz band) that are generated at the cortical level, may be more affected by cancellation compared with other frequency bands since most motoneurons discharge in that range of frequencies during low level contractions and the non-linear term corresponds to harmonics of the discharge frequencies.
In conclusion, this study demonstrates that the cortical input to the motoneuron pool can be transmitted approximately linearly through corticospinal projections because (i) the input is largely common, and (ii) the input is reliably sampled by an average number of four to five active motoneurons, which is relatively small compared with the total number of motoneurons active during a sustained contraction. Coherence between EEG and EMG thus provides an indication of the proportion of cortical input, relative to other inputs, that is transmitted to the output of motoneurons, i.e. to the neural drive to muscles. However, the non-linearities introduced by the spiking nature of the motoneurons can influence this measure and its variability.
Acknowledgments
This study was supported by the European Project TREMOR (Contract no. 224051) (D.F.).
Glossary
Abbreviations
- CST
composite spike train
- MVC
maximal voluntary contraction
Author contributions
The study was performed at the Center for Sensory-Motor Interaction of Aalborg University, Aalborg, Denmark. The authors contributed in equal way to the collection/analysis of the data, interpretation of the results and drafting/revisioning of the manuscript. D.F. raised the fundings for the study.
References
- Amjad AM, Breeze P, Conway BA, Halliday DM, Rosenberg JR. A framework for the analysis of neuronal networks. Prog Brain Res. 1989;80:243–55. doi: 10.1016/s0079-6123(08)62218-9. discussion 2, 239–242. [DOI] [PubMed] [Google Scholar]
- Baker SN, Pinches EM, Lemon RN. Synchronization in monkey motor cortex during a precision grip task. II. effect of oscillatory activity on corticospinal output. J Neurophysiol. 2003;89:1941–1953. doi: 10.1152/jn.00832.2002. [DOI] [PubMed] [Google Scholar]
- Bayly EJ. Spectral analysis of pulse frequency modulation in the nervous systems. IEEE Trans Biomed Eng. 1968;15:257–265. doi: 10.1109/tbme.1968.4502576. [DOI] [PubMed] [Google Scholar]
- Conway BA, Halliday DM, Farmer SF, Shahani U, Maas P, Weir AI, Rosenberg JR. Synchronization between motor cortex and spinal motoneuronal pool during the performance of a maintained motor task in man. J Physiol. 1995;489:917–924. doi: 10.1113/jphysiol.1995.sp021104. [DOI] [PMC free article] [PubMed] [Google Scholar]
- de Noordhout AM, Rapisarda G, Bogacz D, Gerard P, De Pasqua V, Pennisi G, Delwaide PJ. Corticomotoneuronal synaptic connections in normal man: an electrophysiological study. Brain. 1999;122:1327–1340. doi: 10.1093/brain/122.7.1327. [DOI] [PubMed] [Google Scholar]
- Fang Y, Daly JJ, Sun J, Hvorat K, Fredrickson E, Pundik S, Sahgal V, Yue GH. Functional corticomuscular connection during reaching is weakened following stroke. Clin Neurophysiol. 2009;120:994–1002. doi: 10.1016/j.clinph.2009.02.173. [DOI] [PMC free article] [PubMed] [Google Scholar]
- Grosse P, Cassidy MJ, Brown P. EEG-EMG, MEG-EMG and EMG-EMG frequency analysis: physiological principles and clinical applications. Clin Neurophysiol. 2002;113:1523–1531. doi: 10.1016/s1388-2457(02)00223-7. [DOI] [PubMed] [Google Scholar]
- Halliday DM. Weak, stochastic temporal correlation of large scale synaptic input is a major determinant of neuronal bandwidth. Neural Comput. 2000;12:693–707. doi: 10.1162/089976600300015754. [DOI] [PubMed] [Google Scholar]
- Halliday DM, Conway BA, Farmer SF, Rosenberg JR. Using electroencephalography to study functional coupling between cortical activity and electromyograms during voluntary contractions in humans. Neurosci Lett. 1998;241:5–8. doi: 10.1016/s0304-3940(97)00964-6. [DOI] [PubMed] [Google Scholar]
- Hansen NL, Nielsen JB. The effect of transcranial magnetic stimulation and peripheral nerve stimulation on corticomuscular coherence in humans. J Physiol. 2004;561:295–306. doi: 10.1113/jphysiol.2004.071910. [DOI] [PMC free article] [PubMed] [Google Scholar]
- Heckman CJ, Enoka RM. Physiology of the motor neuron and the motor unit. In: Eisen A, editor. Handbook of Clinical Neurophysiology, vol. 4, Clinical Neurophysiology of Motor Neuron Diseases. Elsevier; 2004. pp. 119–147. [Google Scholar]
- Kristeva R, Patino L, Omlor W. Beta-range cortical motor spectral power and corticomuscular coherence as a mechanism for effective corticospinal interaction during steady-state motor output. Neuroimage. 2007;36:785–792. doi: 10.1016/j.neuroimage.2007.03.025. [DOI] [PubMed] [Google Scholar]
- Kuypers HG, Brinkman J. Precentral projections to different parts of the spinal intermediate zone in the rhesus monkey. Brain Res. 1970;24:29–48. doi: 10.1016/0006-8993(70)90272-6. [DOI] [PubMed] [Google Scholar]
- Lawrence DG, Kuypers HG. The functional organization of the motor system in the monkey. I. The effects of bilateral pyramidal lesions. Brain. 1968;91:1–14. doi: 10.1093/brain/91.1.1. [DOI] [PubMed] [Google Scholar]
- Lemon RN. Descending pathways in motor control. Annu Rev Neurosci. 2008;31:195–218. doi: 10.1146/annurev.neuro.31.060407.125547. [DOI] [PubMed] [Google Scholar]
- Machens CK, Stemmler MB, Prinz P, Krahe R, Ronacher B, Herz AV. Representation of acoustic communication signals by insect auditory receptor neurons. J Neurosci. 2001;21:3215–3227. doi: 10.1523/JNEUROSCI.21-09-03215.2001. [DOI] [PMC free article] [PubMed] [Google Scholar]
- Marsden JF, Werhahn KJ, Ashby P, Rothwell J, Noachtar S, Brown P. Organization of cortical activities related to movement in humans. J Neurosci. 2000;20:2307–2314. doi: 10.1523/JNEUROSCI.20-06-02307.2000. [DOI] [PMC free article] [PubMed] [Google Scholar]
- McGill KC, Lateva ZC, Marateb HR. EMGLAB: an interactive EMG decomposition program. J Neurosci Methods. 2005;149:121–133. doi: 10.1016/j.jneumeth.2005.05.015. [DOI] [PubMed] [Google Scholar]
- Nakao M, Norimatsu M, Mizutani Y, Yamamoto M. Spectral distortion properties of the integral pulse frequency modulation model. IEEE Trans Biomed Eng. 1997;44:419–426. doi: 10.1109/10.568918. [DOI] [PubMed] [Google Scholar]
- Negro F, Holobar A, Farina D. Fluctuations in isometric muscle force can be described by one linear projection of low-frequency components of motor unit discharge rates. J Physiol. 2009;587:5925–5938. doi: 10.1113/jphysiol.2009.178509. [DOI] [PMC free article] [PubMed] [Google Scholar]
- Pfurtscheller G, Lopes da Silva FH. Event-related EEG/MEG synchronization and desynchronization: basic principles. Clin Neurophysiol. 1999;110:1842–1857. doi: 10.1016/s1388-2457(99)00141-8. [DOI] [PubMed] [Google Scholar]
- Pohja M, Salenius S. Modulation of cortex-muscle oscillatory interaction by ischaemia-induced deafferentation. Neuroreport. 2003;14:321–324. doi: 10.1097/00001756-200303030-00005. [DOI] [PubMed] [Google Scholar]
- Pohja M, Salenius S, Hari R. Reproducibility of cortex-muscle coherence. Neuroimage. 2005;126:764–770. doi: 10.1016/j.neuroimage.2005.02.031. [DOI] [PubMed] [Google Scholar]
- Raethjen J, Govindan RB, Muthuraman M, Kopper F, Volkmann J, Deuschl G. Cortical correlates of the basic and first harmonic frequency of Parkinsonian tremor. Clin Neurophysiol. 2009;120:1866–1872. doi: 10.1016/j.clinph.2009.06.028. [DOI] [PubMed] [Google Scholar]
- Riddle CN, Baker SN. Manipulation of peripheral neural feedback loops alters human corticomuscular coherence. J Physiol. 2005;566:625–639. doi: 10.1113/jphysiol.2005.089607. [DOI] [PMC free article] [PubMed] [Google Scholar]
- Rosenberg JR, Amjad AM, Breeze P, Brillinger DR, Halliday DM. The Fourier approach to the identification of functional coupling between neuronal spike trains. Prog Biophys Mol Biol. 1989;53:1–31. doi: 10.1016/0079-6107(89)90004-7. [DOI] [PubMed] [Google Scholar]
- Salenius S, Avikainen S, Kaakkola S, Hari R, Brown P. Defective cortical drive to muscle in Parkinson's disease and its improvement with levodopa. Brain. 2002;125:491–500. doi: 10.1093/brain/awf042. [DOI] [PubMed] [Google Scholar]
- Salenius S, Portin K, Kajola M, Salmelin R, Hari R. Cortical control of human motoneuron firing during isometric contraction. J Neurophysiol. 1997;77:3401–3405. doi: 10.1152/jn.1997.77.6.3401. [DOI] [PubMed] [Google Scholar]
- Strens LH, Asselman P, Pogosyan A, Loukas C, Thompson AJ, Brown P. Corticocortical coupling in chronic stroke: its relevance to recovery. Neurology. 2004;63:475–484. doi: 10.1212/01.wnl.0000133010.69694.f8. [DOI] [PubMed] [Google Scholar]
- Tecchio F, Porcaro C, Zappasodi F, Pesenti A, Ercolani M, Rossini PM. Cortical short-term fatigue effects assessed via rhythmic brain-muscle coherence. Exp Brain Res. 2006;174:144–151. doi: 10.1007/s00221-006-0432-8. [DOI] [PubMed] [Google Scholar]
- Terzuolo CA, Bayly EJ. Data transmission between neurons. Kybernetik. 1968;5:83–85. doi: 10.1007/BF00288897. [DOI] [PubMed] [Google Scholar]
- Volkmann J, Joliot M, Mogilner A, Ioannides AA, Lado F, Fazzini E, Ribary U, Llinas R. Central motor loop oscillations in parkinsonian resting tremor revealed by magnetoencephalography. Neurology. 1996;46:1359–1370. doi: 10.1212/wnl.46.5.1359. [DOI] [PubMed] [Google Scholar]
- Yang Q, Fang Y, Sun CK, Siemionow V, Ranganathan VK, Khoshknabi D, Davis MP, Walsh D, Sahgal V, Yue GH. Weakening of functional corticomuscular coupling during muscle fatigue. Brain Res. 2009;1250:101–112. doi: 10.1016/j.brainres.2008.10.074. [DOI] [PMC free article] [PubMed] [Google Scholar]
- Warland DK, Reinagel P, Meister M. Decoding visual information from a population of retinal ganglion cells. J Neurophysiol. 1997;78:2336–2350. doi: 10.1152/jn.1997.78.5.2336. [DOI] [PubMed] [Google Scholar]