

Abstract
Little is known about the precise mechanism that relates skeletal muscle glycogen to muscle fatigue. The aim of the present study was to examine the effect of glycogen on sarcoplasmic reticulum (SR) function in the arm and leg muscles of elite cross-country skiers (n= 10,  72 ± 2 ml kg−1 min−1) before, immediately after, and 4 h and 22 h after a fatiguing 1 h ski race. During the first 4 h recovery, skiers received either water or carbohydrate (CHO) and thereafter all received CHO-enriched food. Immediately after the race, arm glycogen was reduced to 31 ± 4% and SR Ca2+ release rate decreased to 85 ± 2% of initial levels. Glycogen noticeably recovered after 4 h recovery with CHO (59 ± 5% initial) and the SR Ca2+ release rate returned to pre-exercise levels. However, in the absence of CHO during the first 4 h recovery, glycogen and the SR Ca2+ release rate remained unchanged (29 ± 2% and 77 ± 8%, respectively), with both parameters becoming normal after the remaining 18 h recovery with CHO. Leg muscle glycogen decreased to a lesser extent (71 ± 10% initial), with no effects on the SR Ca2+ release rate. Interestingly, transmission electron microscopy (TEM) analysis revealed that the specific pool of intramyofibrillar glycogen, representing 10–15% of total glycogen, was highly significantly correlated with the SR Ca2+ release rate. These observations strongly indicate that low glycogen and especially intramyofibrillar glycogen, as suggested by TEM, modulate the SR Ca2+ release rate in highly trained subjects. Thus, low glycogen during exercise may contribute to fatigue by causing a decreased SR Ca2+ release rate.
Non-technical summary
Glucose is stored as glycogen in skeletal muscle. The importance of glycogen as a fuel during exercise has been recognized since the 1960s; however, little is known about the precise mechanism that relates skeletal muscle glycogen to muscle fatigue. We show that low muscle glycogen is associated with an impairment of muscle ability to release Ca2+, which is an important signal in the muscle activation. Thus, depletion of glycogen during prolonged, exhausting exercise may contribute to muscle fatigue by causing decreased Ca2+ release inside the muscle. These data provide indications of a signal that links energy utilization, i.e. muscle contraction, with the energy content in the muscle, thereby inhibiting a detrimental depletion of the muscle energy store.
Introduction
In skeletal muscle, glucose is stored as glycogen, which is a major source of energy during most forms of muscle activity. Studies at the beginning of the last century by Krogh and Lindhard (Krogh & Lindhard, 1920), and later by Christensen and Hansen (Christensen & Hansen, 1939), revealed the importance of carbohydrate as a fuel during exercise. Later the use of the muscle biopsy technique demonstrated a direct correlation between muscle glycogen concentration and time to fatigue during moderately intense exercise (∼75% of maximum oxygen uptake;  ) (Bergström et al. 1967). The importance of muscle glycogen on performance during both prolonged and high intensity intermittent exercise has subsequently been confirmed in numerous studies (for a review see Green, 1991). However, the link between glycogen depletion and the development of fatigue, as well as the precise mechanism whereby muscle glycogen affects the series of events that ultimately result in fatigue, is not fully understood.
The existence of a glycogenolytic complex associated with sarcoplasmic reticulum (SR) is now well established (Wanson & Drochmans, 1972; Entman et al. 1980; Xu & Becker, 1998). This SR–glycogen complex consists of glycogen and associated proteins involved in glycogenolysis and resynthesis, glycolysis and regulating proteins. These assemblies are dynamic and raise the possibility that feedback regulation from glycogen storage deposits associated with the SR may exist. Such an SR–glycogen arrangement may permit the regulation of the level of [Ca2+]i and, in turn, the regulation of the contractile activation and energy utilization of skeletal muscle.
Several investigators have demonstrated impaired SR function following exercise (Byrd et al. 1989; Favero et al. 1993; Ørtenblad et al. 2000; Duhamel et al. 2006a). These data are obtained in homogenates from fatigued muscle by direct measurements of SR vesicle Ca2+-ATPase activity, and SR vesicle uptake and release rates. The idea of an exercise-induced impaired SR function, leading to muscle fatigue, is supported by experiments on single fibres with simultaneous measurements of force and [Ca2+]i. These experiments have demonstrated that [Ca2+]i is decreased during repeated tetani, which is primarily caused by a decreased SR Ca2+ release rate (Allen et al. 2008). While it is generally accepted that impaired SR Ca2+ release is a substantial factor in fatigue following most forms of exercise, several mechanism can potentially be involved in the series of events that lead to a decrease in SR Ca2+ release rate. A range of different studies suggests that reduced muscle glycogen results in an impairment of SR function. Using both single fibres and muscle bundles, Chin and Allen (Chin & Allen, 1997) elegantly demonstrated, through the manipulation of glucose availability in the recovery phase after fatiguing contractions, that muscle force and [Ca2+]i are associated with muscle glycogen content. Thus, a reduced resting level of glycogen was associated with a faster decrease in tetanic [Ca2+]i and force during subsequent contractions. These results have subsequently been confirmed (Kabbara et al. 2000; Helander et al. 2002) and together these data suggest that the change in SR function associated with fatigue and recovery has a component which is glycogen dependent. Additional evidence for a link between muscle glycogen and SR function comes from human experiments in which Duhamel and colleagues manipulated pre-exercise glycogen in untrained subjects and thereby demonstrated an association between low muscle glycogen levels and a reduced SR vesicle Ca2+ release rate during subsequent exercise (Duhamel et al. 2006b,c;). In line with this, by using mechanically skinned fibres from toad and rat EDL, where ATP and phosphocreatine (PCr) levels can be kept high and constant, muscle glycogen content has been correlated with the muscle fatigability (Stephenson et al. 1999; Barnes et al. 2001; Nielsen et al. 2009). Thus, despite a constant myoplasmic ATP and PCr concentration, muscle glycogen level affects the excitation–contraction (E–C) coupling. This is interpreted as glycogen having either a non-metabolic role or that compartmentalized energy transfer through the glycolysis is important for maintaining normal E–C coupling (Chin & Allen, 1997; Stephenson et al. 1999; Barnes et al. 2001; Nielsen et al. 2009).
In agreement with the hypothesis of a role for glycogen in E–C coupling, transmission electron microscopy (TEM) reveals that glycogen is located in distinct compartments close to different sites of E–C coupling and with possible distinct functions (Wanson & Drochmans, 1972; Sjöström et al. 1982a; Friden et al. 1985, 1989; Marchand et al. 2002, 2007). Thus, muscle glycogen is located: (1) in the subsarcolemmal region beneath the sarcolemma (SS), (2) between the myofibrils close to SR and mitochondria (IMF), and (3) inside the myofibrils, between the contractile filaments, mainly in the I-band (Intra). In mechanically skinned fibres, we have previously shown distinct functions for these subpopulations in rat muscle, with the intramyofibrillar glycogen correlating with fatigue resistance capacity, and the intermyofibrillar glycogen correlating with the muscle half-relaxation time in an unfatigued tetanic contraction (Nielsen et al. 2009). Furthermore, it is recognized that repeated contractions mediate an uneven breakdown of the three subpopulations of glycogen (Sjöström et al. 1982b; Friden et al. 1985, 1989; Marchand et al. 2007). However, while there is evidence for an association between low muscle glycogen and SR function, little is known about the role of the individual glycogen compartments and SR function. Furthermore, the association between low muscle glycogen and exhaustion is less pronounced in highly trained subjects and it remains uncertain whether there is an association between muscle glycogen and SR function in these athletes. In the present study we have measured muscle glycogen content and the SR function in humans in the recovery period after glycogen-depleting exercise. Thus, by either keeping muscle glycogen low or allowing optimal glycogen resynthesis during recovery, we were able to create an experimental design where changes in muscle glycogen level were separated from parallel changes affecting SR Ca2+ function.
The aim of the present study was to investigate the role of skeletal muscle glycogen on SR function in elite cross country (cc) skiers, through manipulating glycogen levels with exhaustive arm and leg exercise and variation in the CHO feeding in the recovery after the exercise. We hypothesize that low glycogen levels are associated with impaired SR function and that restricting CHO intake in the early recovery period after exhaustive exercise will hinder the recovery of SR function. Furthermore, by using electron microscopy images to visualize and quantify muscle glycogen granules, we aimed to examine the role of possible distinct functions of compartmentalized glycogen on the SR function in trained humans. Thus, the specific hypothesis to be tested was that low intramyofibrillar glycogen content, localized near the SR Ca2+ release site, is associated with SR Ca2+ release and intermyofibrillar glycogen is related to the SR Ca2+ uptake rate.
Methods
Ethical approval
The project was approved by the Regional Ethical Review Board in Umeå, Sweden (no. 07-076M). Before giving their written consent to participate, the subjects were fully informed about the project, the risks involved, discomfort associated with the experiment, and that they could withdraw from the project at any time.
Subjects
Ten male elite cc-skiers (age: (mean ±s.e.m.) 22 ± 0.4 years; height: 181 ± 2 cm; body mass: 78.8 ± 2.6 kg) with a  of 72 ± 2 (range 62–79) ml kg−1 min−1 (5.4 ± 0.5 (range 4.8–6.1) l min−1) and haemoglobin concentration of 155 ± 2 g l−1, volunteered for the study. The skiers were selected from Norwegian elite skiers and had an average of 11 years of training. Six out of ten competed in the Norwegian national team and eight competed in the FIS World Cup the subsequent year; one subject had won a world cup race. All participants were training an average of 700 h per year (550–850 h).
Experimental design
In order to validate the role of muscle glycogen levels in SR function the cc-skiers completed a high intensity classical cc race, reducing muscle glycogen levels in both arms and legs, and were then followed in the recovery period after the race. During the first 4 h recovery, the skiers were randomized and received either water or carbohydrate (CHO), which allowed discrimination between muscle glycogen level without having an effect of acute exercise on SR function. After the 4 h recovery, the subject received the same CHO-enriched energy intake for the remainder of the 22 h recovery, i.e. 18 h CHO for the water trial. The CHO-enriched energy intake consisted of both liquid solutions and food allowing the skiers to receive at least 1 g CHO kg−1 h−1. Muscle biopsies were obtained in both arm and leg before (Pre), immediately after (Post), as well as 4 h and 22 h after the cc race. The Post biopsy was obtained immediately after (1–2 min) the skiers had crossed the finish line. Heart rate (HR) was measured continuously during the race and blood lactate concentration ([La−]) was measured 1 min after the finish. The cc-skiers were tested for  in the laboratory within 2 weeks of the performance test.
Performance
Each subject performed a ∼20 km time trial (classic style) on a competition (hilly) cc racecourse. The race and tests took place at the end of the race season. In order to ensure maximum performance, the time trial was arranged as a competition between the participating subjects, with the chance to win bonus money for the three best final times and time at half-distance. The weather conditions during the ski race were optimal with a clear sky, no wind, an air and snow temperature of ∼−2°C and a relative humidity of 70%. Subjects performed individual warm-up and ski preparation before the race. Snow conditions and the racecourse favoured the diagonal stride technique and a high degree of double poling, i.e. upper body exercise.
Laboratory tests
 and maximal heart rate (HRmax) were determined using diagonal skiing on a treadmill (Rodby, Södertälje, Sweden) (Calbet et al. 2005). The skiers started at 11 km h−1 on a treadmill inclination of 4 deg; subsequently the inclination was raised 1 deg every minute to exhaustion. Blood samples (20 μl) were taken from the fingertip and used for determination of [La−] by Biosen 5140 (EKF-diagnostic GmbH, Magdeburg, Germany). All tests were performed using roller skis on a motor-driven treadmill (Rodby RL 3000, Vänge, Sweden), secured in a safety harness suspended from the ceiling. All participants were well accustomed to roller skiing on the treadmill as part of their regular training.
Respiratory variables were measured with the mixed expired procedure employing an ergo-spirometry system (AMIS 2001 model C, Innovision A/S, Odense, Denmark), equipped with an inspiratory flowmeter. The gas analysers were calibrated with a high-precision two-component gas mixture of 16.0% O2 and 4.0% CO2 (Air Liquide, Kungsängen, Sweden) and calibration of the flowmeter was performed at low, medium and high flow rates with a 3-l air syringe (Hans Rudolph, Kansas City, MO, USA). Ambient conditions were monitored with an external apparatus (Vaisala PTU 200, Vaisala OY, Helsinki, Finland). Expired O2 and CO2 and the inspired minute ventilation ( ) were monitored continuously and
  values were calculated and averaged during the final 30 s at each workload. HR was followed continuously using the HR monitor Polar S610 (Polar Electro OY, Kempele, Finland) in combination with the metabolic cart.
Muscle biopsy preparation and analytical procedures
Muscle biopsies were obtained in both arm and leg muscles before and immediately after the race (within 1–2 min after the race), as well as 4 h and 22 h after the race. The biopsies were taken in a randomized order on the left and right side, with two biopsies in each arm and leg. All biopsies from individual subjects were taken by the same person to ensure standardization of the location on the muscle and muscle depth from where the biopsies were taken. After local anaesthesia (2–3 ml 2% lidocaine (lignocaine)), an incision was made through the skin and fascia and the muscle biopsy was taken from m. vastus lateralis (leg) and m. triceps brachii (distal part of the lateral head, arm), using a modified Bergström needle with suction. These muscles were preferred because they are highly active during cc skiing (Holmberg et al. 2005). The muscle specimen was dried on a filter paper placed on a glass plate cooled on ice. After the removal of visible connective tissue and fat the muscle specimen was divided into three specimens and either: (1) frozen directly in liquid N2 and stored for later analyses of metabolites, (2) a muscle segment was fixed for transmission electron microscopy analysis, or (3) a segment was weighed and homogenized in 10 volumes (w/v) of ice-cold buffer (300 mm sucrose, 1 mm EDTA, 10 mm NaN3, 40 mm Tris-base and 40 mm histidine at pH 7.8) at 0°C in a 1 ml glass homogenizer with a glass pestle (Kontes Glass Industry, Vineland, NJ, USA). Prior to homogenization the muscle sample was rinsed free of contaminating blood by washing in ice-cold buffer. The homogenate was divided into different portions and frozen into liquid nitrogen for later analyses of Ca2+ kinetics, protein and myosin heavy chain (MHC) composition (see below). In a few biopsies (out of 40 from both arm and leg muscle) the sample portion was not enough to obtain all three specimens.
SR vesicle Ca2+ uptake and release measured in crude muscle homogenate
The technique for measuring SR vesicle Ca2+ uptake and release was performed as previously described in detail (Ørtenblad et al. 2000; Nielsen et al. 2007) (Fig. 1). Briefly, muscle homogenate (70 μl) was mixed with 2 ml assay buffer (165 mm KCl, 22 mm Hepes, 7.5 mm oxalate, 11 mm NaN3, 5.5 μmN,N,N′,N′-tetrakis(2-pyridylmethyl)ethylenediamine (TPEN), 20 μm CaCl2 and 2 mm MgCl2 (pH 7.0 at 37°C)), and the reaction initiated by adding ATP to a final concentration of 5 mm. [Ca2+] was determined fluorometrically (20 Hz, Ratiomaster RCM, Photon Technology International, Brunswick, NJ, USA) using the fluorescent Ca2+ indicator indo-1 (1 μm). When [Ca2+] reached a plateau (nadir-Ca2+, i.e. [Ca2+] at the end of Ca2+ uptake, Fig. 1 value c), SR Ca2+ uptake was blocked by adding cyclopiazonic acid (40 μm) and Ca2+ release was initiated by adding 4-chloro-m-cresol (5 mm), and the fluorescence followed for at least 30 s.
Figure 1.
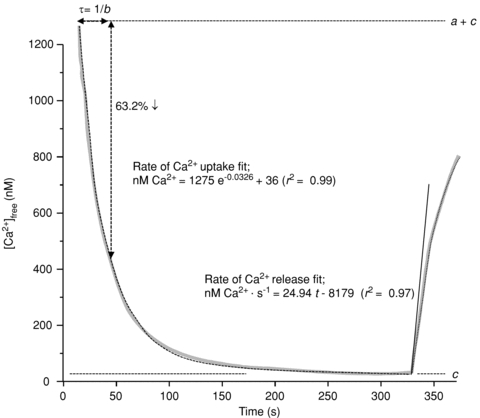
Measurement of parameters associated with SR vesicle Ca2+ uptake and Ca2+ release from a representative [Ca2+] trace (grey trace) obtained on a homogenate muscle sample from the arm after exercise using the assays described in Methods.
Fluorescence was converted to free [Ca2+] (Ørtenblad et al. 2000, Fig. 1 grey line) and raw data for [Ca2+] were imported into Matlab version 7.0.1 (The MathWorks, Natick, MA, USA) and mathematically analysed (Curve Fitting Toolbox version 1.1.1; The MathWorks). Curve fitting of Ca2+ uptake was performed with data points between a free [Ca2+] of 1000 nm and the free [Ca2+] 20 s prior to initiating Ca2+ release (r2 > 0.99 for all data sets, Fig. 1, dotted line between 0 and 330 s). The time (τ) to reach 63% of the SR vesicle uptake (i.e. the initial free [Ca2+] minus nadir-Ca2+) was calculated as 1/b from the equation; y=ae−bt+ c, where y is the free [Ca2+], t is time and a, b and c are constants assigned from Matlab. There were no differences in the values of the constants a and c (nadir-Ca2+) between trials, arm and leg, time or within same subject at various time points, with a averaging 1297 ± 24 nm and nadir-Ca2+ averaging 35 ± 4 nm.
SR Ca2+ release rate was obtained by mathematically fitting the data points during the first 30 s of release to the equation: y=x(1 – e−y(t−z)) (Fig. 1, dotted line from 330 s), back-extrapolate to nadir-Ca2+ and the rate of Ca2+ release was determined as the derivative of the initial release (Fig. 1, continuous line). The values obtained for SR Ca2+-release rates are relative and therefore expressed as arbitrary units of Ca2+ min−1 (g protein)−1). Due to the inter-individual variation in SR Ca2+ release rate, largely owing to fibre-type differences (see Results), figures and statistics are determined by relative SR Ca2+ release and uptake rates (%Pre). Assays of uptake and release rates of Ca2+ were performed in triplicate (a few in duplicate due to limited tissue homogenate).
Protein content in the muscle homogenate was measured in triplicate using a standard kit (Pierce BCA protein reagent no. 23225). The homogenate protein content averaged 11.1 ± 0.2 mg ml−1, with no significant difference between trials or time point, or in samples from the same subject.
Fibre-type composition
Myosin heavy chain composition was analysed in the same muscle homogenate as used for measurements of Ca2+ kinetics using gel electrophoresis as previously described (Salviati et al. 1986) and modified for humans (Andersen & Aagaard, 2000). Briefly, muscle homogenate (80 μl) was mixed with 200 μl of sample buffer (10% glycerol, 5% 2-mercaptoethanol and 2.3% SDS, 62.5 mm Tris and 0.2% bromophenol blue at pH 6.8), boiled in a water bath at 100°C for 3 min and loaded (10–40 μl) on a SDS-PAGE gel (6% polyacrylamide (100:1, acrylamide:bis-acrylamide), 30% glycerol, 67.5 mm Tris-base, 0.4% SDS, and 0.1 mm glycine). Gels were run at 80 V for at least 42 h at 4°C and MHC bands made visible by staining with Coomassie. The gels were scanned (Linoscan 1400 scanner, Heidelberg, Germany) and MHC bands densitometrically quantified (Phoretix 1D, non-linear, Newcastle, UK). MHCII was identified with Western blot using monoclonal antibody (Sigma M 4276) with the protocol Xcell IITM (Invitrogen, Carlsbad, CA, USA). Data are averages of three biopsies, i.e. two from one leg/arm and one from the other leg/arm.
Biochemical determination of muscle glycogen
Muscles were frozen and later freeze-dried, dissected free of non-muscle tissue, powdered and extracted with perchloric acid as previously described (Harris et al. 1974). Muscle glycogen was analysed from a separate portion of the freeze-dried muscle according to Lowry & Passonneau (1972).
Transmission electron microscopy (TEM) and estimation of glycogen content and localization
A segment of the muscle was fixed for TEM analysis as previously described in detail (Nielsen et al. 2010). Briefly, the segment was fixed with 2.5% glutaraldehyde in 0.1 m sodium cacodylate buffer (pH 7.3) for 24 h and afterwards rinsed four times in 0.1 m sodium cacodylate buffer. The segments were then post-fixed and stained with 1% osmium tetroxide (OsO4) and 1.5% potassium ferrocyanide (K4Fe(CN)6) in 0.1 m sodium cacodylate buffer for 90 min at 4°C, the use of reduced osmium tetroxide-containing potassium ferrocyanide favouring a high electron density of glycogen particles (de Bruijn, 1973). After post-fixation the packed fibre segments were rinsed twice in 0.1 m sodium cacodylate buffer at 4°C, dehydrated through graded series of alcohol at 4–20°C, infiltrated with graded mixtures of propylene oxide and Epon at 20°C, and embedded in 100% Epon at 30°C. Ultra-thin sections (∼60 nm) were cut using a Leica Ultracut UCT ultramicrotome, and contrasted with uranyl acetate and lead citrate. The sections were examined and photographed in a pre-calibrated Philips EM 208 electron microscope and a Megaview III FW camera.
Images were obtained at ×40,000 magnification in a randomized systematic order to ensure unbiased results. Three localizations of glycogen were defined: (1) the subsarcolemmal space, (2) the intermyofibrillar space, and (3) the intramyofibrillar space. The glycogen volume fraction (VV) of each subpopulation was estimated as proposed by Weibel (1980), where the effect of section thickness was taken into account:  , where AA is the glycogen area fraction, t is the section thickness (60 nm), BA is the glycogen boundary length density, NA is the number of particles per area, and H is the average glycogen profile diameter.
Statistical analyses
All data are shown as means ± standard error of the mean (s.e.m.). Data were analysed using unpaired t test, ANOVA when appropriate. Significant differences between means were located using the Bonferroni post hoc test. Correlation between two variables was tested with Pearson's correlation analysis using log transformed data. Analyses were conducted in StatView 5.0 (SAS Institute, Cary, NC, USA). The significance level was set to P≤ 0.05.
Results
Cross country race performance
The average race time for the ∼20 km race was 56 min 58 s ± 1 min 8 s (range 52 min 8 s to 62 min 30 s) for the ∼20 km race. Blood lactate measured immediately after the race was 10.4 ± 0.8 mmol l−1 (range 7.7–14.1 mmol l−1).
Myosin heavy chain distribution
MHC distribution in m. vastus lateralis and m. triceps brachii (distal part of the lateral head) revealed a clear overweight of MHCI in the leg muscle (58%), with the opposite in the arm, revealing an average of 60% expression of the MHCIIa isoform (Table 1). Two of the cc-skiers who were very successful in sprint performance had more than 70% of the arm fibres expressing MHCIIa, i.e. 71% and 72%.
Table 1.
Myosin heavy chain composition in arm and leg muscle from elite cc-skiers
| Fibre-type distribution (%) | |||
|---|---|---|---|
| MHCI | MHCIIa | MHCIIx | |
| Leg (vastus lateralis) | 58 ± 2 | 41 ± 2 | 1 ± 0.4 |
| Arm (triceps brachii) | 40 ± 3* | 60 ± 3* | 0.4 ± 0.2 |
Myosin heavy chain (MHC) composition from m. vastus lateralis and m. triceps brachii (distal part of the lateral head). The analysis was performed on three biopsies from each subject, i.e. both left- and right-hand side muscles included, using SDS-PAGE.
Significantly different from leg muscle.
Glycogen content
Biochemically determined muscle glycogen was on average reduced to 31 ± 4% (from 540.2 to 167.1 mmol (kg dry wt)−1 in the arms and 71 ± 10% (from 484.7 to 331.3 mmol (kg dry wt)−1) of the initial level in the legs directly after the race (Fig. 2). Accordingly, there was a pronounced higher muscle glycogen utilization in the arms compared to the legs during the race (363 ± 47 and 143 ± 53 mmol (kg dry wt)−1, arms and legs, respectively). After 4 h recovery with CHO, arm glycogen was noticeably recovered (59 ± 5% of Pre) and fully recovered in the leg muscle. In the absence of CHO during the first 4 h recovery, muscle glycogen remained low (arm 29 ± 2% and leg 76 ± 5%). However, after the remaining 18 h recovery with CHO the muscle glycogen was restored to pre-race levels in both the CHO and water trials (Fig. 2, arm 85 ± 7% and leg 101 ± 3%).
Figure 2.
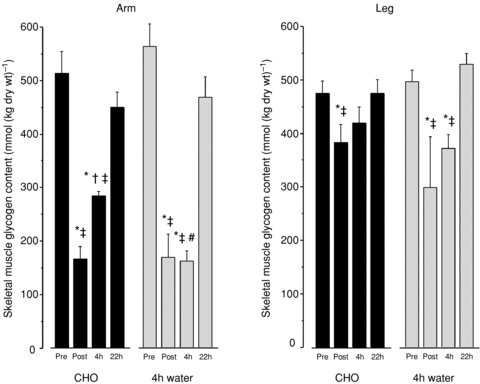
Muscle glycogen was analysed biochemically in freeze-dried muscle from triceps brachii (arm) and vastus lateralis (leg). Data are from before (Pre), immediately after (Post) and 4 h and 22 h after an approximately 1 h exhaustive cross-country race. CHO denotes that the skiers received optimal CHO during the first 4 h, and water denotes that for the first 4 h skiers only received water and no CHO. After the 4 h recovery, the skier assigned to the water trial received the same CHO-enriched energy intake for the remaining time of the 22 h recovery, i.e. 18 h CHO for the water trial. n= 4–5. *Significantly different from Pre; †significantly different from 4 h; ‡significantly different from 22 h; #significantly different from 4 h CHO trial.
SR vesicle function
There was a significant, on average 15 ± 2%, decrease in arm SR vesicle Ca2+ release rate following the exhaustive cc race (from 4.7 ± 0.4 to 3.9 ± 0.4 μmol Ca2+ (g protein)−1 min−1), with no significant difference between trials (Fig. 3). However, there was no significant effect on leg Ca2+ release, but a significant difference between the arm and leg release rates. In the arm, a 4 h recovery with optimal CHO fully normalized the SR Ca2+ release rate. In the water trial, which omitted CHO during the first 4 h of recovery, the muscle SR Ca2+ release rate remained reduced (on average, by 23 ± 5%) and significantly different from that of the 4 h recovery with CHO (Fig. 3). In the water trial, SR Ca2+ release rate returned to normal values 22 h after the race, i.e. after 18 h with optimal CHO. There were no differences in leg SR Ca2+ release rates throughout the recovery period, in both CHO and water trials.
Figure 3. SR vesicle Ca2+ release rate in crude muscle homogenate.
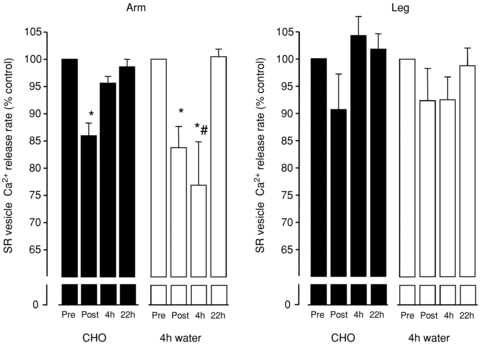
The SR vesicle Ca2+ uptake and release were measured fluorometrically. Data were mathematically fitted using mono-exponential equations before estimating the vesicle Ca2+ release rate. Arm muscle SR Ca2+ release rates were on average decreased to 85 ± 2% of initial values following the race. Four hours of recovery with CHO fully normalized SR Ca2+ release rate. However, in the absence of CHO during the first 4 h recovery the SR Ca2+ release rate remained low and reduced by 23 ± 5%, returning to normal levels after the remaining 18 h recovery with optimal CHO. There were no significant effects of exercise on the leg SR Ca2+ release rate. n= 4–5. *Significantly different from Pre; #significantly different from 22 h.
In Pre biopsies there was a significant 34% higher SR Ca2+ release rate in arm compared to leg (4.7 ± 0.4 vs. 3.5 ± 0.3 μmol Ca2+ (g protein)−1 min−1, respectively). When combining arm and leg data at rest, there was a significant correlation between the MHCI distribution and the SR vesicle Ca2+ release rate (SR vesicle release rate = 6.913–0.054 %MHCI, r= 0.34, P < 0.01, n= 19), where SR vesicle release rate is given in μmol Ca2+ (g protein)−1 min−1. This reveals that there is an approximately 4.6 times higher SR Ca2+ release rate in MHCII fibres as compared to MHCI, i.e. release rate of 6.9 and 1.5 with 100% MHCII and MHCI fibres, respectively. This supports data from rodents demonstrating an approximately 3-fold higher action potential-induced peak rate of SR Ca2+ release between the fibre types (Baylor & Hollingworth, 2003). Accordingly, with a 4.6 times higher release rate in MHCII fibres the observed difference in the relative MHC composition of the two muscles would be expected to give a 24% higher Ca2+ release rate in the arm, which is in line with present data.
SR Ca2+ uptake function was estimated as the ATP-supported SR vesicle uptake and given as the τ value, calculated after curve fitting, defined as the time for the free [Ca2+] to decrease by 63% of the initial free [Ca2+]. There was no significant difference in the τ value in arm following the exhaustive race and neither in the 22 h recovery period after the race. However, in leg muscle τ was significantly increased by 23 ± 12% immediately following the race (i.e. SR Ca2+ uptake decreased) from a resting value of 25.6 ± 2.3 s. SR Ca2+ uptake in the leg muscles was fully recovered within the first 4 h recovery with no difference between trials.
Correlation between SR release rate and muscle glycogen content
The study design enables the estimation of the possible role of muscle glycogen in SR function since the muscle milieu will be normalized after 4 h recovery, while muscle glycogen levels vary in the recovery period, due to the availability of CHO. In arm, which had a significant decrease in the release rate and marked reduction in muscle glycogen, there was a close association between SR Ca2+ release rate and muscle glycogen content (Figs 2 and 3). Thus, relatively low glycogen levels (Post and 4 h water trial) are followed by an impaired SR Ca2+ release rate. In order to verify whether muscle glycogen levels are associated with SR vesicle release rate at the individual level, we correlated the individual data of SR release and glycogen content from the cc-skiers. There was significant logarithmic correlation (r2= 0.29, n= 67, P < 0.0001) between muscle total glycogen content and the relative SR Ca2+ release rate. When discriminating data from arm and leg, only arm muscle (which exhibited very low glycogen levels) revealed a significant correlation between SR release rate and muscle glycogen (r2= 0.41, n= 34, P < 0.0001). Furthermore, a discrimination between time points revealed a significant correlation after 4 h recovery (r2= 0.30, n= 16, P= 0.03, Fig. 4), and no significant correlations at the other time points.
Figure 4. Correlation of SR Ca2+ release rate and total glycogen concentration in biopsies from cross-country skiers obtained 4 h post exercise.
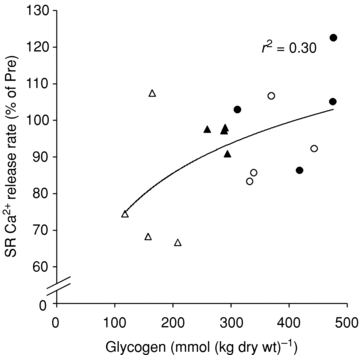
Data points are included from the legs (circles) and arms (triangles) from both CHO (filled symbols) and water (open symbols) trials. The line indicates best fit of all the data points (r2= 0.30, P= 0.03, n= 16).
TEM-determined glycogen volume and association with SR function
Since glycogen is heterogeneously distributed in the muscle in distinct regions of the fibre (Marchand et al. 2002; Nielsen et al. 2010), we used TEM estimations of glycogen volume in order to verify associations of the discrete glycogen localization with the observed SR Ca2+ release rate. As previously stated, three localizations of glycogen were defined in the fibres: (i) IMF, (ii) Intra, and (iii) SS (Fig. 6) (Nielsen et al. 2010), with a relative volume distribution of about 75–85%, 8–15% and 5–10% in the intermyofibrillar, intramyofibrillar and subsarcolemmal spaces, respectively (Marchand et al. 2007; Nielsen et al. 2010). The data showed a high correlation between biochemically determined glycogen and TEM-estimated glycogen (r2= 0.57). When including all observations (n= 72) there was a significant correlation of SR Ca2+ release rate and all three subfractions of glycogen (IMF, r2= 0.15; P= 0.001; Intra, r2= 0.24; P < 0.0001; SS, r2= 0.14, P= 0.001). However, discrimination between time points revealed a significant correlation between Intra glycogen and SR Ca2+ release rate 4 h post (r2= 0.23; P= 0.04, Fig. 5B) and there were no significant correlations at the other time points or subfractions. If the correlation analysis is further stratified by limbs no correlations were present using this small sample size (n= 9–10). Thus a small fraction (10–15%) of glycogen that is localized inside the myofibrils, near the SR-voltage sensors at the triad in the I-band, appears to be most closely associated with the SR Ca2+ release rate.
Figure 6. TEM images showing the subcellular localization of skeletal muscle glycogen.

Both images are from a pre-exercise biopsy of arm m. triceps brachii. A, overview of part of fibre showing the myofibrillar (Myo) space and subsarcolemmal (SS) space. At the top of the image an adjacent fibre with a nucleus (N) can be seen and in the interstitial space between the two fibres a capillary (C) is found. All the grey structures in the fibre are mitochondria and black areas represent spaces filled with glycogen. The black box indicates the position of the image at higher magnification shown in B. Scale bar = 5 μm. Original ×5000 magnification. B, typical localization pattern of IMF and Intra glycogen in skeletal muscle. Glycogen particles are seen as black dots. Z, Z-line; M, M-band. Scale bar = 0.5 μm. Original ×40,000 magnification.
Figure 5. Correlation of TEM-determined subfractions of glycogen and SR Ca2+ release rate.
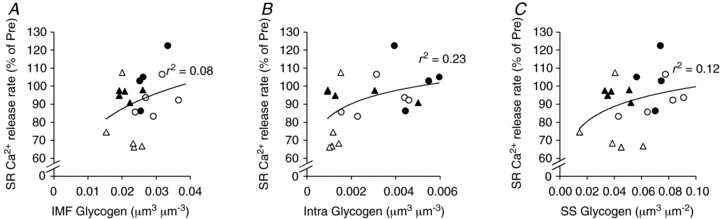
A, IMF glycogen; B, Intra glycogen; C, SS glycogen. Data points are included from the legs (circles) and arms (triangles) from both CHO (filled symbols) and water (open symbols) trials. Lines indicate best fits of all the data points (A: r2= 0.08, P= 0.23, n= 19; B: r2= 0.23, P= 0.04, n= 19; C, r2= 0.12, P= 0.14, n= 19).
Discussion
In the present study, we have investigated the role of intense 1 h exercise and glycogen availability on the SR function in the arm and leg muscles of highly trained cc-skiers. The main findings were that following the exercise, the SR Ca2+ release rate was only significantly decreased in the arms and that this coincided with lower glycogen content when compared to the legs. The role of glycogen availability was strengthened by the finding that the diminished SR vesicle Ca2+ release rate was not improved if glycogen was maintained low in the recovery period by the absence of CHO intake indicating a direct role for glycogen in regulating SR Ca2+ release rate. Further, regression analysis of subcellular localizations of glycogen and the SR Ca2+ release rate suggested that only glycogen localized inside the myofibrils (intramyofibrillar glycogen) was associated with SR Ca2+ release rate. The results raise the possibility that intramyofibrillar glycogen is a prerequisite for normal SR Ca2+ release, and that feedback regulation from glycogen storage deposits located inside the myofibrils may exist. Thus, glycogen may regulate the cytosolic levels of Ca2+ and, in turn, the energy utilization of skeletal muscle.
SR function in fatigue
It is clear that reduced SR function in general, and SR Ca2+ release in particular, is an important contributor to muscle fatigue during a variety of exercise types (Favero, 1999; Allen et al. 2008). The demonstration of intrinsic dysfunctions of the SR as an important mechanism of fatigue is gained from both studies at the single cell level (Chin & Allen, 1997; Allen et al. 2008), isolated muscles (Ward et al. 1998; Ørtenblad et al. 2000), and whole body exercise (Byrd et al. 1989; Gollnick et al. 1991; Duhamel et al. 2006a,b;). Thus, the present findings in highly trained athletes are consistent with previous studies, showing an exercise-induced impairment in the muscle Ca2+ regulation following 1 h of exhaustive exercise. Direct measurements of SR Ca2+ uptake and release rates can only be obtained in SR vesicle preparations and these studies have demonstrated exercise-related decreases in both or either of these properties. Several studies have reported an up to 40% decrease in the SR vesicle Ca2+ release rate following both intense and prolonged exercise in humans (Hill et al. 2001; Li et al. 2002; Leppik et al. 2004; Duhamel et al. 2006a). Currently, several mechanisms are likely candidates for explaining the in vivo reduction in SR function, depending on fatigue mode and intracellular environment, e.g. low ATP, elevated Mg2+, Ca2+, intracellular phosphate, or reactive oxygen species. However, measurements of SR vesicle function are carried out in vitro under apparently optimal conditions, and demonstrate that once the SR is removed from the intracellular environment and not under normal voltage sensor control, changes in function persist. This, however, does not imply that the depressed SR vesicle function unequivocally is linked to a decreased rate of Ca2+ release during normal in vivo excitation–contraction coupling. One factor that appears to affect SR vesicle function is the glycogen content of the skeletal muscle cell. In turn, Duhamel and colleagues (Duhamel et al. 2006a,c;), using the same method as in the present study, have shown that there is a clear association between muscle glycogen content and SR vesicle function during prolonged exercise, when starting exercise with high and low glycogen levels, respectively. Furthermore, present data on human muscles obtained immediately after exercise and during the recovery period following exercise, support the data from both single fibres and muscle bundles that demonstrate that muscle force and tetanic [Ca2+]i are associated with muscle glycogen content (Chin et al. 1997; Kabbara et al. 2000; Helander et al. 2002) in the recovery phase after fatiguing contractions. Together, these data suggest that in elite trained humans the change in SR function is also associated with fatigue and that impaired SR function has a component that is glycogen dependent. There was no significant decrease in the SR vesicle Ca2+ release rate in leg muscle following exhaustive exercise and there was a significantly greater decrease in the arm vesicle release rate compared to that of the leg (P < 0.05). This may be unexpected and explained by a lack of power, either due to a limited number of subjects and SR data (n= 9) or the different fibre-type distribution in the arm muscles compared to leg muscles (Table 1). Thus, assuming that the MHCII fibres are more prone to impaired SR Ca2+ release, the arm muscles would be more affected than leg muscles, as well as if the MHCII fibres were more active in the arms than in the legs.
In the present study of highly trained cc-skiers, the SR Ca2+ uptake rate in leg muscle was significantly reduced after exercise, while fully recovered after a 4 h recovery. However, we did not observe an effect on SR vesicle Ca2+ uptake rate following exercise in the arm. When viewed as a whole, most studies have reported a reduced SR vesicle Ca2+ uptake following exercise (Luckin et al. 1991; Duhamel et al. 2006a), though SR Ca2+ uptake has also been reported to be unaltered (Dossett-Mercer et al. 1994, 1995). These discrepancies may be related to the exercise mode and training status. In term of glycogen, our results suggest that in elite cc-skiers whole-muscle glycogen is not associated with the SR Ca2+ uptake rate, whereas it could be speculated that the exercise mode of the leg muscle may determine the susceptibility of the SR Ca2+ pump to the exercise.
Association between SR and the glycogenolytic complex
An important assumption for the present, and previous, conclusions is that the SR vesicle used for the in vitro measurements of SR function is associated with glycogen. Therefore, even though SR dysfunction is evident when it is removed from the intracellular milieu and evaluated in constant and optimal conditions, it is important to consider the physiological relevance of glycogen in the SR vesicle preparation. Previous studies have demonstrated a strong binding between SR membrane and glycogen and glycogen-regulating proteins, and the existence of a glycogenolytic complex consisting of glycogen and enzymes involved in its metabolism is now well established (Wanson & Drochmans, 1972; Entman et al. 1980; Kruszynska et al. 2001; Shearer & Graham, 2004). This association of glycogen, related enzymes and regulating proteins substantiates the existence of a functionally independent glycogenolytic complex, which is involved in the control of its own glycolytic metabolism. Furthermore, it has been demonstrated that part of this glycogenolytic complex can be physically associated with the SR (Wanson & Drochmans, 1972; Entman et al. 1980; Cuenda et al. 1995; Xu & Becker, 1998; Lees et al. 2001, 2004). Thus, Entman and collegues have demonstrated that the SR–glycogenolytic complex is a highly specific, functionally defined compartment for phosphorylase regulation and that this is a compartmented system for phosphorylase activation controlled by SR calcium flux (Entman et al. 1980). Importantly, the association between SR and the glycogenolytic complex is apparently dynamic, changing with the metabolic state of the muscle cell (Xu & Becker, 1998; Kruszynska et al. 2001; Lees et al. 2001). Taken together, these observations provide evidence for an integrated and dynamic association between the SR and part of the glycogenolytic complex, which appears to be essential for SR function and persists in SR vesicle preparations.
Association of glycogen and SR Ca2+ release rate
The present data demonstrate a 15% decrease in the SR Ca2+ release rate in arm after exhaustive exercise, associated with low glycogen levels (<200 mmol (kg dry wt)−1). Further, when muscle glycogen was kept low by omitting CHO in the recovery period, the SR Ca2+ release rate remained impaired. Importantly, the SR Ca2+ release rate recovered and was significantly different from the water trial when the athletes received optimal CHO during the 4 h recovery period and muscle glycogen was increased to 283 ± 8 mmol (kg dry wt)−1 (59 ± 5% of Pre). These measurements after 4 h recovery eliminate parallel changes in a variety of candidates that traditionally explain the reduction in SR function when fatigued, and strongly indicate that low muscle glycogen per se affects SR Ca2+ release rate.
A critical level of muscle glycogen below which SR function is impaired has been suggested (Duhamel et al. 2006c). This concept arises from the observations that: (1) a small decrease in muscle glycogen does not impair muscle Ca2+ regulation (Chin & Allen, 1997; Duhamel et al. 2006c), (2) under conditions with low starting muscle glycogen the impaired Ca2+ regulation is accelerated (Chin & Allen, 1997; Helander et al. 2002), and (3) exercise-induced reductions in SR function are observed much later during exercise when starting with high glycogen compared to low glycogen during whole body exercise (Duhamel et al. 2006c). Thus it was observed that the SR vesicle Ca2+ release rate was significantly depressed at muscle glycogen levels below an apparent critical level of 300 mmol (kg dry wt)−1, which was attained after ∼30 min and ∼60 min of exercise, with low and high starting glycogen levels, respectively (Duhamel et al. 2006c). These data are very much in line with the present observation of a decrease in SR Ca2+ release rate associated with very low glycogen levels (<200 mmol (kg dry wt)−1). Importantly, when muscle glycogen was kept low by omitting CHO in the recovery period, SR Ca2+ release rate remained impaired, while the SR Ca2+ release rate recovered and was significantly different from that in the water trial, when muscle glycogen was 283 ± 8 mmol (kg dry wt)−1. From the present data and previously published data (Duhamel et al. 2006c) we suggest a critical level of muscle glycogen of 280–300 mmol (kg dry wt)−1, below which the SR Ca2+ release rate is impaired. The idea of a critical level of total glycogen can, however, be challenged by the present results using TEM, showing that only intramyofibrillar glycogen is associated with SR Ca2+ release rate. Nevertheless, the logarithmic correlation between Intra glycogen and SR Ca2+ release rate 4 h post exercise indicates that a critical level for the Intra glycogen is necessary for optimal SR Ca2+ release.
Glycogen localization and the role of distinct pools
Both qualitative and quantitative studies have shown that repeated contractions mediate an uneven breakdown of glycogen fractions, raising the likely possibility that the various glycogen pools, or even granula, may act as independent metabolic units with specialized functions, resulting in regulatory or metabolic compartments with distinct characteristics and functions (Sjöström et al. 1982a; Friden et al. 1985, 1989; Marchand et al. 2007; Nielsen et al. 2009). In line with this, we have recently shown that in mechanically skinned fibres, the distinct pool of intramyofibrillar glycogen was positively correlated with the fatigue resistance capacity. These results demonstrate that the distinct subcellular populations of glycogen have different roles in contracting single muscle fibres and that muscle fatigueability is partly controlled by the availability of intramyofibrillar glycogen (Nielsen et al. 2009). Further, the intramyofibrillar pool is recognized as being preferentially restored after prolonged exercise (Marchand et al. 2007). Here we demonstrate for the first time, in whole muscles from elite cc-skiers, that it is the particular subfraction of intramyofibrillar glycogen which is significantly associated with the SR Ca2+ release rate (r2= 0.23, Fig. 5). The fact that intramyofibrillar glycogen is not physically associated with SR suggests that the link between low glycogen and SR Ca2+ release rate is mediated through a signalling cascade. Importantly, in this study, using trained athletes and prolonged exercise, the biochemically determined glycogen (whole muscle glycogen) and TEM-estimated glycogen were relatively closely correlated. This relationship explains the observed association between biochemically determined glycogen and the SR Ca2+ release rate despite the apparent significance of the particular subfraction of intramyofibrillar glycogen on the SR Ca2+ release rate. The finding of a higher correlation coefficient when the SR Ca2+ release rate is related to biochemically determined glycogen (r2= 0.30) rather than to TEM-estimated Intra glycogen (r2= 0.23) may suggest that biochemical glycogen is the best predictor of SR Ca2+ release rate. However, the higher r2 value is due to a lower sample size in biochemically determined glycogen and a correction for the sample size reveals similar r-values (data not shown) by the two methods.
Coupling mechanisms between intramyofibrillar glycogen and SR Ca2+ release
The vast majority of intramyofibrillar glycogen is specifically located in the I-band of the sarcomere, which is close to the triads, with the voltage sensor and SR Ca2+ release channel (RyR). In line with the idea of a compartmentalized energy transfer between glycolytic-derived ATP and energy-controlled processes, the role of intramyofibrillar glycogen could be to provide glycolytic intermediates to the triads maintaining an optimal coupling between voltage sensors and SR RyRs. Such an apparent coupling has previously been demonstrated between both glycolysis and the skeletal muscle transverse-tubule Na+,K+-pumps (Dutka & Lamb, 2007) and with the existence of a sequential glycolytic reaction compartmentalized in the triads, where the glycolytic-derived ATP formation appears not to be in equilibrium with the bulk ATP (Han et al. 1992; Less et al. 2004). The triad is located in a very restricted space formed by the terminal cisternae of the SR, which lie alongside the T-system, and it is thereby clearly separated from mitochondria and intermyofibrillar glycogen. Thus, a high and constant myoplasmic energy status does not imply that the energy status is constant in the very restricted space in the triadic gap (12 nm and limited by the SR) with a high local energy turnover during repetitive contractions. The triadic gap is physically remote from mitochondria, lipids, glycogen and other constituents of the intermyofibrillar space (Fig. 6B). Thus, access of glycolytic intermediates, from the breakdown of glycogen to the triad, could be speculated to be favoured from intramyofibrillar glycogen localized in the I-band near the triads, but not necessarily physically associated with the SR. On the contrary, intermyofibrillar glycogen does not seem to be directly located next to the triad and both intermyofibrillar and subsarcolemmal glycogen might have limited access to the triad gap, which is covered by the SR. In line with this, several glycolytic enzymes are present in the triads, and do not seem to be in direct equilibrium with the bulk enzymes (Han et al. 1992). This association between the SR, the enzymes and the connection to intramyofibrillar glycogen apparently persists with the SR vesicle preparation as used in the present study. The present demonstration of a correlation between intramyofibrillar glycogen and the SR Ca2+ release rate suggests that compartmentalized energy transfer through glycolysis or signalling via glycolytic intermediates is essential for normal muscle function and may explain the long time recognized importance of muscle glycogen on performance, during both prolonged and high intensity intermittent exercise.
Conclusions
This study demonstrates, in human elite cc-skiers, a close association between low glycogen (less than about 50% of control) and impaired SR Ca2+ release. This strongly indicates that glycogen content modulates the SR Ca2+ release rate, which is in agreement with the emerging concept of a structural role for glycogen, meaning it has a much more diverse functional role than just an energy reserve. Moreover, transmission electron microscopy analysis revealed that the distinct fraction of glycogen localized in the intramyofibrillar space, was highly significantly correlated with the SR Ca2+ release rate. Thus, the depletion of glycogen during prolonged, exhausting exercise may contribute to fatigue by causing a decreased SR Ca2+ release rate. Further, the present findings suggest that the link between glycogen and SR Ca2+ release rate is compartmentalized to intramyofibrillar glycogen particles and may provide further insight to explain the long recognized importance of muscle glycogen on performance during both prolonged and high intensity intermittent exercise.
Perspectives
The importance of carbohydrate as a fuel during exercise has been recognized since the beginning of last century. Using the muscle biopsy technique, it was later demonstrated that the importance of carbohydrate can be explained by a close association between the muscle glycogen concentration and time to exhaustion. We have now demonstrated that low muscle glycogen is associated with an impairment of SR Ca2+ release, leading to fatigue. Thus, the depletion of glycogen during prolonged, exhausting exercise may contribute to fatigue by causing decreased SR Ca2+ release. We show here that the specific localization of glycogen in the intramyofibrillar space is important for a normal SR Ca2+ release rate. These data provide strong indications for the importance of the subcellular arrangement of glycogen in muscle fibres and the possible existence of a compartmentalized energy transfer or signal transduction from intramyofibrillar glycogen particles to the restricted area of the triad junction that modulates the SR Ca2+ release rate.
Acknowledgments
The study was supported by The Danish Ministry of Culture, the Committee on Sports Research (TKIF2005-049) and TEAM Denmark (06-40215/3). The authors have no conflicts of interest to disclose.
Glossary
Abbreviations
- cc
cross country
- CHO
carbohydrate
- E–C
excitation–contraction
- HR
heart rate
- HRmax
maximum heart rate
- [La−]
lactate concentration
- IMF
intermyofibrillar
- Intra
intramyofibrillar
- MHC
myosin heavy chain
- PCr
phosphocreatine
- RyR
ryanodine receptor (Ca2+ release channel)
- SR
sarcoplasmic reticulum
- SS
subsarcolemmal
- TEM
transmission electron microscopy
Author contributions
The experiments were performed at the Institute of Sports Science and Clinical Biomechanics (muscle analysis) and Institute of Pathology, Faculty of Health Science (electron microscopy pictures), University of Southern Denmark, DK-5230 M, Denmark, and the Swedish Winter Sports Research Centre, Department of Health Sciences, Mid Sweden University, Östersund, Sweden (exercise and testing). All authors contributed to the conception and design of the experiments, collection, analysis and interpretation of data, and drafting the article or revising it critically for important intellectual content. All authors approved the final version of the manuscript.
References
- Allen DG, Lamb GD, Westerblad H. Skeletal muscle fatigue: cellular mechanisms. Physiol Rev. 2008;88:287–332. doi: 10.1152/physrev.00015.2007. [DOI] [PubMed] [Google Scholar]
- Andersen JL, Aagaard P. Myosin heavy chain IIX overshoot in human skeletal muscle. Muscle Nerve. 2000;23:1095–1104. doi: 10.1002/1097-4598(200007)23:7<1095::aid-mus13>3.0.co;2-o. [DOI] [PubMed] [Google Scholar]
- Barnes M, Gibson LM, Stephenson DG. Increased muscle glycogen content is associated with increased capacity to respond to T-system depolarisation in mechanically skinned skeletal muscle fibres from the rat. Pflugers Arch. 2001;442:101–106. doi: 10.1007/s004240000510. [DOI] [PubMed] [Google Scholar]
- Baylor SM, Hollingworth S. Sarcoplasmic reticulum calcium release compared in slow-twitch and fast-twitch fibres of mouse muscle. J Physiol. 2003;551:125–138. doi: 10.1113/jphysiol.2003.041608. [DOI] [PMC free article] [PubMed] [Google Scholar]
- Bergström J, Hermansen L, Hultman E, Saltin B. Diet, muscle glycogen and physical performance. Acta Physiol Scand. 1967;71:140–150. doi: 10.1111/j.1748-1716.1967.tb03720.x. [DOI] [PubMed] [Google Scholar]
- Byrd SK, Bode AK, Klug GA. Effects of exercise of varying duration on sarcoplasmic reticulum function. J Appl Physiol. 1989;66:1383–1389. doi: 10.1152/jappl.1989.66.3.1383. [DOI] [PubMed] [Google Scholar]
- Calbet JA, Holmberg HC, Rosdahl H, van Hall G, Jensen-Urstad M, Saltin B. Why do arms extract less oxygen than legs during exercise? Am J Physiol Regul Integr Comp Physiol. 2005;289:R1448–R1458. doi: 10.1152/ajpregu.00824.2004. [DOI] [PubMed] [Google Scholar]
- Chin ER, Allen DG. Effects of reduced muscle glycogen concentration on force, Ca2+ release and contractile protein function in intact mouse skeletal muscle. J Physiol. 1997;498:17–29. doi: 10.1113/jphysiol.1997.sp021838. [DOI] [PMC free article] [PubMed] [Google Scholar]
- Chin ER, Balnave CD, Allen DG. Role of intracellular calcium and metabolites in low-frequency fatigue of mouse skeletal muscle. Am J Physiol Cell Physiol. 1997;272:C550–C559. doi: 10.1152/ajpcell.1997.272.2.C550. [DOI] [PubMed] [Google Scholar]
- Christensen EH, Hansen O. Arbeitsfahigkeit und ernahrung. Skand Arch Physiol. 1939;81:160–171. [Google Scholar]
- Cuenda A, Nogues M, Henao F, Gutierrez-Merino C. Interaction between glycogen phosphorylase and sarcoplasmic reticulum membranes and its functional implications. J Biol Chem. 1995;270:11998–12004. doi: 10.1074/jbc.270.20.11998. [DOI] [PubMed] [Google Scholar]
- de Bruijn WC. Glycogen, its chemistry and morphologic appearance in the electron microscope. I. A modified OsO4 fixative which selectively contrasts glycogen. J Ultrastruct Res. 1973;42:29–50. doi: 10.1016/s0022-5320(73)80004-8. [DOI] [PubMed] [Google Scholar]
- Dossett-Mercer J, Green H, Chin ER, Grange F. Failure of short term stimulation to reduce sarcoplasmic reticulum Ca2+-ATPase function in homogenates of rat gastrocnemius. Mol Cell Biochem. 1995;146:23–33. doi: 10.1007/BF00926877. [DOI] [PubMed] [Google Scholar]
- Dossett-Mercer J, Green HJ, Chin E, Grange F. Preservation of sarcoplasmic reticulum Ca2+-sequestering function in homogenates of different type composition following sprint activity. Can J Physiol Pharmacol. 1994;72:1231–1237. doi: 10.1139/y94-175. [DOI] [PubMed] [Google Scholar]
- Duhamel TA, Green HJ, Perco JG, Ouyang J. Comparative effects of a low-carbohydrate diet and exercise plus a low-carbohydrate diet on muscle sarcoplasmic reticulum responses in males. Am J Physiol Cell Physiol. 2006a;291:C607–C617. doi: 10.1152/ajpcell.00643.2005. [DOI] [PubMed] [Google Scholar]
- Duhamel TA, Green HJ, Perco JG, Ouyang J. Effects of prior exercise and a low-carbohydrate diet on muscle sarcoplasmic reticulum function during cycling in women. J Appl Physiol. 2006b;101:695–706. doi: 10.1152/japplphysiol.00052.2006. [DOI] [PubMed] [Google Scholar]
- Duhamel TA, Perco JG, Green HJ. Manipulation of dietary carbohydrates after prolonged effort modifies muscle sarcoplasmic reticulum responses in exercising males. Am J Physiol Regul Integr Comp Physiol. 2006c;291:R1100–R1110. doi: 10.1152/ajpregu.00858.2005. [DOI] [PubMed] [Google Scholar]
- Dutka TL, Lamb GD. Na+-K+ pumps in the transverse tubular system of skeletal muscle fibers preferentially use ATP from glycolysis. Am J Physiol Cell Physiol. 2007;293:C967–C977. doi: 10.1152/ajpcell.00132.2007. [DOI] [PubMed] [Google Scholar]
- Entman ML, Keslensky SS, Chu A, Van Winkle WB. The sarcoplasmic reticulum-glycogenolytic complex in mammalian fast twitch skeletal muscle. Proposed in vitro counterpart of the contraction-activated glycogenolytic pool. J Biol Chem. 1980;255:6245–6252. [PubMed] [Google Scholar]
- Favero TG. Sarcoplasmic reticulum Ca2+ release and muscle fatigue. J Appl Physiol. 1999;87:471–483. doi: 10.1152/jappl.1999.87.2.471. [DOI] [PubMed] [Google Scholar]
- Favero TG, Pessah IN, Klug GA. Prolonged exercise reduces Ca2+ release in rat skeletal muscle sarcoplasmic reticulum. Pflugers Arch. 1993;422:472–475. doi: 10.1007/BF00375074. [DOI] [PubMed] [Google Scholar]
- Friden J, Seger J, Ekblom B. Implementation of periodic acid-thiosemicarbazide-silver proteinate staining for ultrastructural assessment of muscle glycogen utilization during exercise. Cell Tissue Res. 1985;242:229–232. doi: 10.1007/BF00225582. [DOI] [PubMed] [Google Scholar]
- Friden J, Seger J, Ekblom B. Topographical localization of muscle glycogen: an ultrahistochemical study in the human vastus lateralis. Acta Physiol Scand. 1989;135:381–391. doi: 10.1111/j.1748-1716.1989.tb08591.x. [DOI] [PubMed] [Google Scholar]
- Gollnick PD, Korge P, Karpakka J, Saltin B. Elongation of skeletal muscle relaxation during exercise is linked to reduced calcium uptake by the sarcoplasmic reticulum in man. Acta Physiol Scand. 1991;142:135–136. doi: 10.1111/j.1748-1716.1991.tb09139.x. [DOI] [PubMed] [Google Scholar]
- Green HJ. How important is endogenous muscle glycogen to fatigue in prolonged exercise? Can J Physiol Pharmacol. 1991;69:290–297. doi: 10.1139/y91-045. [DOI] [PubMed] [Google Scholar]
- Han JW, Thieleczek R, Varsanyi M, Heilmeyer LM., Jr Compartmentalized ATP synthesis in skeletal muscle triads. Biochemistry. 1992;31:377–384. doi: 10.1021/bi00117a010. [DOI] [PubMed] [Google Scholar]
- Harris RC, Hultman E, Nordesjö LO. Glycogen, glycolytic intermediates and high-energy phosphates determined in biopsy samples of musculus quadriceps femoris of man at rest. Methods and variance of values. Scand J Clin Lab Invest. 1974;33:109–120. [PubMed] [Google Scholar]
- Helander I, Westerblad H, Katz A. Effects of glucose on contractile function, [Ca2+]i, and glycogen in isolated mouse skeletal muscle. Am J Physiol Cell Physiol. 2002;282:C1306–C1312. doi: 10.1152/ajpcell.00490.2001. [DOI] [PubMed] [Google Scholar]
- Hill CA, Thompson MW, Ruell PA, Thom JM, White MJ. Sarcoplasmic reticulum function and muscle contractile character following fatiguing exercise in humans. J Physiol. 2001;531:871–878. doi: 10.1111/j.1469-7793.2001.0871h.x. [DOI] [PMC free article] [PubMed] [Google Scholar]
- Holmberg HC, Lindinger S, Stöggl T, Eitzlmair E, Müller E. Biomechanical analysis of double poling in elite cross-country skiers. Med Sci Sports Exerc. 2005;37:807–818. doi: 10.1249/01.mss.0000162615.47763.c8. [DOI] [PubMed] [Google Scholar]
- Kabbara AA, Nguyen LT, Stephenson GM, Allen DG. Intracellular calcium during fatigue of cane toad skeletal muscle in the absence of glucose. J Muscle Res Cell Motil. 2000;21:481–489. doi: 10.1023/a:1005650425513. [DOI] [PubMed] [Google Scholar]
- Krogh A, Lindhard J. The relative value of fat and carbohydrate as sources of muscular energy: with appendices on the correlation between standard metabolism and the respiratory quotient during rest and work. Biochem J. 1920;14:290–363. doi: 10.1042/bj0140290. [DOI] [PMC free article] [PubMed] [Google Scholar]
- Kruszynska YT, Ciaraldi TP, Henry RR. A Critical, Comprehensive Presentation of Physiological Knowledge and Concepts. In: Jefferson LS, Cherrington A, editors. Handbook of Physiology. New York: Oxford University Press; 2001. pp. 579–607. section 7, The Endocrine System. [Google Scholar]
- Lees SJ, Franks PD, Spangenburg EE, Williams JH. Glycogen and glycogen phosphorylase associated with sarcoplasmic reticulum: effects of fatiguing activity. J Appl Physiol. 2001;91:1638–1644. doi: 10.1152/jappl.2001.91.4.1638. [DOI] [PubMed] [Google Scholar]
- Lees SJ, Williams JH. Skeletal muscle sarcoplasmic reticulum glycogen status influences Ca2+ uptake supported by endogenously synthesized ATP. Am J Physiol Cell Physiol. 2004;286:C97–C104. doi: 10.1152/ajpcell.00188.2003. [DOI] [PubMed] [Google Scholar]
- Leppik JA, Aughey RJ, Medved I, Fairweather I, Carey MF, McKenna MJ. Prolonged exercise to fatigue in humans impairs skeletal muscle Na+-K+-ATPase activity, sarcoplasmic reticulum Ca2+ release, and Ca2+ uptake. J Appl Physiol. 2004;97:1414–1423. doi: 10.1152/japplphysiol.00964.2003. [DOI] [PubMed] [Google Scholar]
- Li JL, Wang XN, Fraser SF, Carey MF, Wrigley TV, McKenna MJ. Effects of fatigue and training on sarcoplasmic reticulum Ca2+ regulation in human skeletal muscle. J Appl Physiol. 2002;92:912–922. doi: 10.1152/japplphysiol.00643.2000. [DOI] [PubMed] [Google Scholar]
- Lowry OH, Passonneau JV. A Flexible System of Enzymatic Analysis. New York: Academic Press; 1972. [Google Scholar]
- Luckin KA, Favero TG, Klug GA. Prolonged exercise induces structural changes in SR Ca2+-ATPase of rat muscle. Biochem Med Metab Biol. 1991;46:391–405. doi: 10.1016/0885-4505(91)90087-2. [DOI] [PubMed] [Google Scholar]
- Marchand I, Chorneyko K, Tarnopolsky M, Hamilton S, Shearer J, Potvin J, Graham TE. Quantification of subcellular glycogen in resting human muscle: granule size, number, and location. J Appl Physiol. 2002;93:1598–1607. doi: 10.1152/japplphysiol.00585.2001. [DOI] [PubMed] [Google Scholar]
- Marchand I, Tarnopolsky M, Adamo KB, Bourgeois JM, Chorneyko K, Graham TE. Quantitative assessment of human muscle glycogen granules size and number in subcellular locations during recovery from prolonged exercise. J Physiol. 2007;580:617–628. doi: 10.1113/jphysiol.2006.122457. [DOI] [PMC free article] [PubMed] [Google Scholar]
- Nielsen J, Mogensen M, Vind BF, Sahlin K, Højlund K, Schrøder HD, Ørtenblad N. Increased subsarcolemmal lipids in type 2 diabetes: effect of training on localization of lipids, mitochondria, and glycogen in sedentary human skeletal muscle. Am J Physiol Endocrinol Metab. 2010;298:E706–E713. doi: 10.1152/ajpendo.00692.2009. [DOI] [PubMed] [Google Scholar]
- Nielsen J, Schrøder HD, Rix CG, Ørtenblad N. Distinct effects of subcellular glycogen localization on tetanic relaxation time and endurance in mechanically skinned rat skeletal muscle fibres. J Physiol. 2009;587:3679–3690. doi: 10.1113/jphysiol.2009.174862. [DOI] [PMC free article] [PubMed] [Google Scholar]
- Nielsen JS, Sahlin K, Ørtenblad N. Reduced sarcoplasmic reticulum content of releasable Ca2+ in rat soleus muscle fibres after eccentric contractions. Acta Physiol (Oxf) 2007;191:217–228. doi: 10.1111/j.1748-1716.2007.01732.x. [DOI] [PubMed] [Google Scholar]
- Ørtenblad N, Sjogaard G, Madsen K. Impaired sarcoplasmic reticulum Ca2+ release rate after fatiguing stimulation in rat skeletal muscle. J Appl Physiol. 2000;89:210–217. doi: 10.1152/jappl.2000.89.1.210. [DOI] [PubMed] [Google Scholar]
- Salviati G, Betto R, Danieli-Betto D, Biasia E, Serena M, Mini M, Scarlato G. Myosin light chains and muscle pathology. Neurology. 1986;36:693–697. doi: 10.1212/wnl.36.5.693. [DOI] [PubMed] [Google Scholar]
- Shearer J, Graham TE. Novel aspects of skeletal muscle glycogen and its regulation during rest and exercise. Exerc Sport Sci Rev. 2004;32:120–126. doi: 10.1097/00003677-200407000-00008. [DOI] [PubMed] [Google Scholar]
- Sjöström M, Friden J, Ekblom B. Fine structural details of human muscle fibres after fibre type specific glycogen depletion. Histochemistry. 1982a;76:425–438. doi: 10.1007/BF00489899. [DOI] [PubMed] [Google Scholar]
- Sjöström M, Neglen P, Friden J, Eklof B. Human skeletal muscle metabolism and morphology after temporary incomplete ischaemia. Eur J Clin Invest. 1982b;12:69–79. doi: 10.1111/j.1365-2362.1982.tb00941.x. [DOI] [PubMed] [Google Scholar]
- Stephenson DG, Nguyen LT, Stephenson GM. Glycogen content and excitation–contraction coupling in mechanically skinned muscle fibres of the cane toad. J Physiol. 1999;519:177–187. doi: 10.1111/j.1469-7793.1999.0177o.x. [DOI] [PMC free article] [PubMed] [Google Scholar]
- Wanson JC, Drochmans P. Role of the sarcoplasmic reticulum in glycogen metabolism. Binding of phosphorylase, phosphorylase kinase, and primer complexes to the sarcovesicles of rabbit skeletal muscle. J Cell Biol. 1972;54:206–224. doi: 10.1083/jcb.54.2.206. [DOI] [PMC free article] [PubMed] [Google Scholar]
- Ward CW, Spangenburg EE, Diss LM, Williams JH. Effects of varied fatigue protocols on sarcoplasmic reticulum calcium uptake and release rates. Am J Physiol Regul Integr Comp Physiol. 1998;275:R99–R104. doi: 10.1152/ajpregu.1998.275.1.R99. [DOI] [PubMed] [Google Scholar]
- Weibel ER. Theoretical Foundations. Vol. 2. London: Academic Press; 1980. Stereological Methods. [Google Scholar]
- Xu KY, Becker LC. Ultrastructural localization of glycolytic enzymes on sarcoplasmic reticulum vesticles. J Histochem Cytochem. 1998;46:419–427. doi: 10.1177/002215549804600401. [DOI] [PubMed] [Google Scholar]