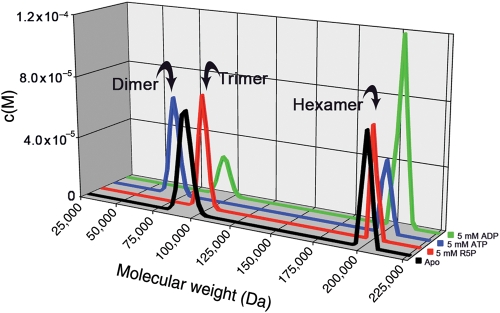
Fig. 7.
Mt-PrsA self-assembly analysis using analytical ultracentrifugation. Sedimentation velocity experiments were conducted to investigate the oligomeric state of Mt-PrsA in solution in the presence of no additional ligands (black line), 5 mM R5P (red line), 5 mM ATP (blue line) and 5 mM ADP (green line). Individual plots represent the molar mass distribution c(M) vs. the apparent molecular weight (Da). Arrows indicate the calculated oligomeric state of Mt-PrsA in each sedimentation velocity experiment.

