Abstract
Liquid Chromatography Time-of-Flight Mass Spectrometry (LC-TOF-MS) is widely used for profiling metabolite compounds. LC-TOF-MS is a chemical analysis technique that combines the physical separation capabilities of high-pressure liquid chromatography (HPLC) with the mass analysis capabilities of Time-of-Flight Mass Spectrometry (TOF-MS) which utilizes the difference in the flight time of ions due to difference in the mass-to-charge ratio. Since metabolite compounds have various chemical characteristics, their precise identification is a crucial problem of metabolomics research. Contemporaneously analyzed reference standards are commonly required for mass spectral matching and retention time matching, but there are far fewer reference standards than there are compounds in the organism. We therefore developed a retention time prediction method for HPLC to improve the accuracy of identification of metabolite compounds. This method uses a combination of Support Vector Regression and Multiple Linear Regression adaptively to the measured retention time. We achieved a strong correlation (correlation coefficient = 0.974) between measured and predicted retention times for our experimental data. We also demonstrated a successful identification of an E. coli metabolite compound that cannot be identified by precise mass alone.
Keywords: liquid chromatography, retention time prediction, support vector regression, LC-TOF-MS, metabolomics
Background
While the ‘-ome’ researches such as genome, transcriptome, proteome and metabolome, need the technologies to analyze thoroughly in the organism, the metabolome is much different in analyte from the others. The analyte in metabolome analysis is a group of the chemical compounds with various chemical characteristics and their precise identification is a crucial problem of metabolomics research.
Liquid Chromatography Time-of-Flight Mass Spectrometry (LC-TOF-MS) is widely used for profiling metabolite compounds [1]. LC-TOF-MS is a chemical analysis technique that combines the physical separation capabilities of high-pressure liquid chromatography (HPLC) with the mass analysis capabilities of Time-of-Flight Mass Spectrometry (TOF-MS) which utilizes the difference in the flight time of ions due to difference in the mass-to-charge ratio. In the identification of compounds by LC-TOFMS, contemporaneously analyzed reference standards are commonly required for mass spectral matching and retention time matching. However, reference standards are not always available because there are far fewer reference standards than there are compounds in the organism. Acquiring reference standards for amino and nucleic acids, which are related to synthesis and degradation pathways, is especially difficult.
In this paper, we describe our development of a system for predicting the retention time of compounds without reference standards. There have been several studies on retention time prediction for peptides [2] [3] and organic compounds [4] [5]. They have used the artificial neural network (ANN) and the heuristic method (HM) as prediction methods. Our targets are more general (proteins, sugars, nucleic acids, etc.) and we chose Multiple Linear Regression (MLR) as well as Support Vector Regression (SVR), whose performance was reported to be better than that of HM [5]. Mihaleva et al. [6] proposed a method to predict Kovats retention index using both SVR and MLR. It selects features by using a genetic algorithm and successfully reduced a hit list by 41-60 %. However, their research target is Gas Chromatography/Mass Spectrometry (GC/MS) and deals with different sets of features. In addition, the method completely differs from ours in the way of combining SVR and MLR and selecting features. We also applied our system to E. coli metabolome analysis.
Methodology
Outline of metabolome analysis system
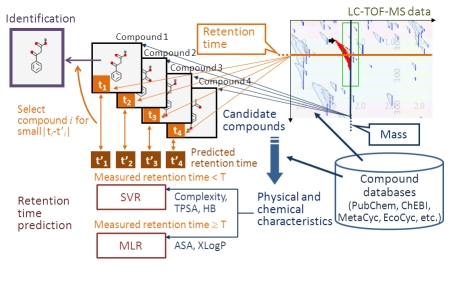
Figure 1 shows our metabolome analysis system. The system first searches for candidate compounds whose masses are equal to the mass measured by LC-TOF-MS from databases such as PubChem [7], ChEBI [8], MetaCyc [9], and EcoCyc [10]. Next, it predicts the retention times of these candidate compounds and selects the compounds whose measured retention times are most similar to the predicted retention times.
Figure 1.
Metabolome analysis system. The system first searches for candidate compounds whose masses are equal to the mass measured by LC-TOFMS from the compound databases. Next, it predicts the retention times of these candidate. When the measured retention time is less than the threshold T, SVR is used (a combination of Complexity, TPSA, and HB are used for input features) and when the measured retention time is larger than or equal to T, MLR is used (ASA and XLogP are used as independent variables). The compounds whose measured retention times are most similar to the predicted retention times are selected for identificatio
Material
The authors of Genaris, Inc. performed an LC-TOF-MS experiment for 150 compounds in the reference standards and used the data obtained from it. The experimental conditions are as follows: The ACQUITY UPLC chromatography system was used with the column ACQUITY UPLC HSS T3 2.1 mm×50 mm (Waters). Column temperature was 40 °C and flow rate was 0.4 ml/mm. The gradient condition was distilled water and acetonitrile (2% of acetonitrile for 1.5 minutes and 2-100% of acetonitrile for 1.5 to 8.25 minutes).
Feature extraction
For each of the above 150 compounds, atom additive calculation of octanol/water partition coefficient (XLogP) [11] approximate polar surface (Topological Polar Surface Area, TPSA), structural complexity index (Complexity), the number of Hydrogen Bond Acceptors, and Hydrogen Bond Donors (HB) were obtained from the PubChem database. These indexes represent various physical and chemical properties (hydrophobicity, electricity, stereo chemistry, etc.). In addition to these existing indexes, we calculated a solvent-accessible surface area (ASA) of each compound by using its 3D coordinates. We propose a hypothesis that the solvent-accessible surface of a compound to the direction of the chromatography column mainly affects the interaction between the column and the compound. We obtained 3D coordinates from the PubChem database and determined the direction that maximizes the interface area between the column and the compound.
Retention time prediction method
Our retention time prediction method uses a machine learning algorithm, Support Vector Regression (SVR) and a statistical method, Multiple Linear Regression (MLR). The former is an algorithm for creating regression functions of arbitrary type from a set of training data by using a support vector machine. We implemented the program using the LIBSVM library [12].
SVR and MLR are combined as follows. When the measured retention time of LC-TOF-MS is less than the threshold T, we use SVR. A radial basis function (RBF) is used as a kernel function and a combination of Complexity, TPSA, and HB is used for the input features of SVR. For retention time larger than or equal to T, we use MLR by using ASA and XLogP as independent variables. As for the threshold, we use a value of 1.5 minutes, as we will discuss in the next section.
Discussion
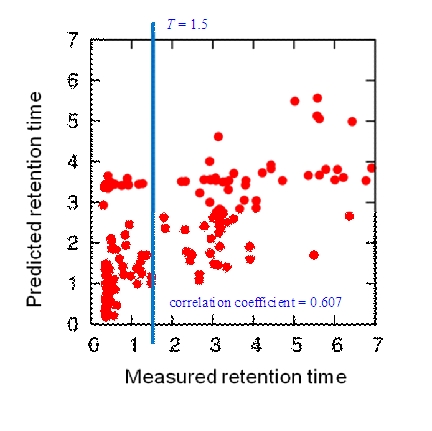
We examined various features for retention time prediction. Figure 2 shows the prediction results of a five-fold cross validation test when using SVR with an RBF kernel and a combination of three indexes: Complexity, TPSA, and XLogP. The Pearson correlation coefficient is 0.607 and is especially low for retention time of less than 1.5 minutes (0.170 for retention time ≫ 1.5 and 0.521 for retention time ≥ 1.5). In this range of retention time, the chromatography solvent is largely water and only hydrophilic compounds are eluted. We thus decided to use different methods whether the retention time is less than 1.5 minutes or not (threshold T in the previous section is defined as 1.5 minutes).
Figure 2.

Prediction performance of SVR. The figure shows correlation between the measured retention time and predicted retention time when SVR is used for all range of the retention time. The blue line indicates the threshold T.
For retention time ≫ 1.5 minutes, the interaction between compound and water is important. Therefore, in this case we used another index (i.e., HB) in place of XLogP. This combination (Complexity, TPSA, and HB) gave the best result (i.e., correlation coefficient = 0.714). However, for retention time ≥ 1.5 minutes, the correlation coefficient for the same combination of features was only 0.116. Therefore, in this case we used a linear kernel function instead of RBF, and obtained a good result (i.e., correlation coefficient = 0.824). This suggests that the retention time has a near-linear relationship to the above indexes except for cases of short retention time.
We further examined various combinations of indexes and proved that the best combination is ASA and XlogP, in which case the correlation coefficient was improved to 0.875. ASA and XLogP are directly related to the structure and hydrophobicity of compounds. Since these compound indexes and the hydrophobicity of the chromatography column have substantial influence on the interaction between the column and the compound, they are important for retention time prediction. As the retention time becomes short, the influence of the column's hydrophobicity decreases and the interaction between compound and solvent becomes more dominant
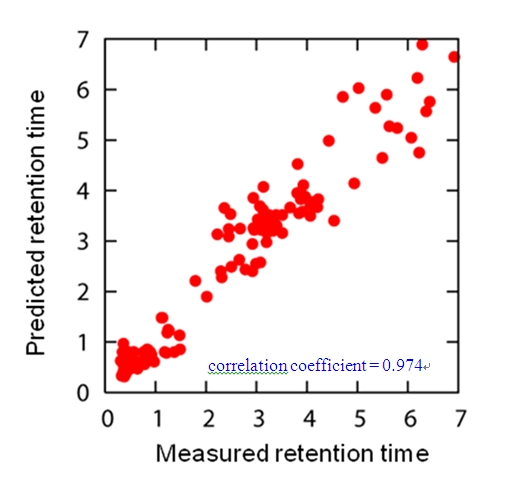
Since the retention time may have a near-linear relationship to ASA and XLogP for longer retention time, we also used MLR as a prediction method. It was found that MLR provided higher correlation (correlation coefficient = 0.896) than SVR (correlation coefficient = 0.875). Accordingly, we decided to combine SVR (for retention time of less than 1.5 minutes) and MLR (retention time of over 1.5 minutes). By using this combined method we obtained a strong correlation (correlation coefficient = 0.974) between measured and predicted retention times (Figure 3). This correlation value is high compared with the existing work [6] although the target of prediction is different (GC/MS).
Figure 3.

Prediction performance of the combined method This figure shows correlation between the measured retention time and predicted retention time when combining SVR (for retention time of less than 1.5 minutes) and MLR (retention time of over 1.5 minutes)
We then applied our prediction system to E. coli metabolome analysis, choosing a target compound (PubChemID 191) in the reference standards. Measurements taken with LC-TOF-MS showed that the target compound has mass of 267.0989 and retention time of 1.1338. Table 1 shows the results for candidate compounds obtained by mass-based database search. We predicted the retention time of each compound and this is also shown in the table. The table is sorted by the difference between the measured and predicted retention times. The fourth compound listed is the only one registered in the E. coli compound database EcoCyc and was successfully identified as the target compound. We also applied our metabolome analysis system to 22 other compounds in the reference standards and succeeded in narrowing more than ten candidates down to at most five compounds, including the target compound.
Conclusion
Our retention time prediction system achieved very high accuracy (i.e., correlation coefficient = 0.974) and was proven to be useful for identifying compounds that cannot be identified by precise mass alone. Since our system does not use reference standards it can be widely applied to compounds relevant to metabolomics. Using retention time prediction, it can also be used for predicting compound specifications such as extent of ionization with the electrospray ionization method. The method utilizes various properties of chromatography and its framework (Figure 1) is applicable to other metabolome analysis. To do so, however, parameters such as the threshold of retention time should be tuned to individual LCTOF-MS systems and experimental conditions.
Supplementary material
Footnotes
Citation:Shimizuet al, Bioinformation 5(6): 255- 258 (2010)
References
- 1.Lin CY, et al. J. Pestic. Sci. 2006;31:245. [Google Scholar]
- 2.Shinoda K, et al. J Proteome Res. 2006;5:3312. doi: 10.1021/pr0602038. [DOI] [PubMed] [Google Scholar]
- 3.Perlova TY, et al. Proteomics. 2010;10:3458. doi: 10.1002/pmic.200900837. [DOI] [PubMed] [Google Scholar]
- 4.Jalali-Heravi M, Kyani A. J. Chem. Inf. Comput. Sci. 2004;44:1328. doi: 10.1021/ci0342270. [DOI] [PubMed] [Google Scholar]
- 5.Luanet F, et al. Analytica Chimica Acta. 2005;537:101. [Google Scholar]
- 6.Mihaleva VV, et al. Bioinformatics. 2009;25:787. doi: 10.1093/bioinformatics/btp056. [DOI] [PubMed] [Google Scholar]
- 7. http://pubchem.ncbi.nlm.nih.gov/
- 8. http://www.ebi.ac.uk/chebi/
- 9. http://metacyc.org/
- 10. http://ecocyc.org/
- 11.Wang R, et al. Perspectives in Drug Discovery and Design. 2000;19:47. [Google Scholar]
- 12. http://www.csie.ntu.edu.tw/~cjlin/libsvm.
Associated Data
This section collects any data citations, data availability statements, or supplementary materials included in this article.


