A new ex vivo model for acute glaucoma was established in separated rat retinas. Under high pressure, in this model the observations suggested an alteration in glutamate metabolism, which may be responsible for excitotoxicity when exogenous glutamate is administered.
Abstract
Purpose.
A new experimental glaucoma model was developed by using an ex vivo rat retinal preparation to examine the effects of elevated hydrostatic pressure on retinal morphology and glutamine synthetase (GS) activity.
Methods.
Ex vivo rat retinas were exposed to elevated hydrostatic pressure for 24 hours in the presence of glutamate or glutamate receptor antagonists and examined histologically. GS activity was assessed by colorimetric assay.
Results.
Pressure elevation induced axonal swelling in the nerve fiber layer. Axonal swelling was prevented by a combination of non-N-methyl-d-aspartate (non-NMDA) receptor antagonist and an NMDA receptor antagonist, indicating that the damage results from activation of both types of glutamate receptor. When glial function was preserved, the typical changes induced by glutamate consisted of reversible Müller cell swelling resulting from excessive glial glutamate uptake. The irreversible Müller cell swelling in hyperbaric conditions may indicate that pressure disrupts glutamate metabolism. Indeed, elevated pressure inhibited GS activity. In addition, glutamate exposure after termination of pressure exposure exhibited apparent Müller cell swelling.
Conclusions.
These results suggest that the neural degeneration observed during pressure elevation is caused by impaired glial glutamate metabolism after uptake.
Glaucoma is a heterogeneous disorder caused by several distinct pathologic processes. Although the pathogenesis of glaucoma is not fully understood, it is believed that increased intraocular pressure (IOP) is a major contributor. Increased IOP may cause ocular ischemia, because the vascular perfusion pressure, defined as the difference between local arterial pressure and IOP, is decreased by elevated IOP. Thus, it has been hypothesized that excitotoxicity, which plays a key role in ischemic damage, may be involved in glaucomatous retinal degeneration.
Activation of glutamate receptors plays a key role in inducing excitotoxicity in the retina.1,2 However, the primary change produced by exogenously applied glutamate is a swelling of glial Müller cells.3 Under these conditions, neurons are not damaged. However, glutamate becomes excitotoxic to neurons when Müller glia are unable to metabolize the amino acid.4,5 This suggests that changes in glial function are important in retinal excitotoxicity. Several studies have shown that the expression of glutamine synthetase (GS), a key enzyme involved in glial glutamate metabolism,6 increases after pressure elevation,7–9 whereas others have reported decreases in GS activity and expression.10,11 Thus, it remains controversial whether elevated IOP alters glial cell glutamate metabolism as a potential mechanism of retinal excitotoxicity.
We used an ex vivo rat retinal preparation12 to examine histologically and biochemically whether elevated pressure disrupts glutamate metabolism. In addition, we examined whether elevated pressure alters glial fibrillary acidic protein (GFAP), an intermediate filament protein expressed in injured Müller glia,13,14 because GFAP is considered to be a pathologic marker of Müller cell stress.15 An increase in GFAP expression in Müller cells has recently been reported after the elevation of IOP.7,13,16–21
Materials and Methods
All experiments were performed in accordance with the guidelines of the ARVO Statement for the Use of Animals in Ophthalmic and Vision Research.
Retinal Segment Preparation
Retinal segments were prepared from approximately 30-day-old male Sprague-Dawley rats (Charles River Laboratories International Inc., Wilmington, MA), according to published methods.12 The eyes were carefully dissected from the orbits and placed in a holding device on the floor of an ice-cold Petri dish filled with chilled aCSF (artificial cerebrospinal fluid) medium containing (in mM): 124 NaCl, 5 KCl, 2 MgSO4, 2 CaCl2, 1.25 NaH2PO4, 22 NaHCO3, and 10 glucose. The holding device consisted of an inverted cap (inside diameter, 5 mm) removed from a 1.5-mL plastic vial. The cornea was excised circumferentially with microscissors and the lens and vitreous were removed. The empty eye cup (diameter, ∼5 mm) was placed on a flat cutting surface and immersed in ice-cold aCSF. With a no. 22 surgical scalpel blade, the eye cup was divided into four equal fan-shaped segments. The retina was carefully and gently detached from the sclera with a fine forceps and the scalpel blade. This detachment of the retina did not affect morphologic integrity during a 24-hour incubation. Each specimen was placed in a plastic dish that was 0.5 cm deep and 2.5 cm in diameter. The dish was slowly sunk with a guide wire to the bottom of a tall glass cylinder filled with aCSF. To examine the optic disc region, we cut some eye cups into a central eye cup segment approximately 2.0 mm in diameter. The 95% O2–5% CO2 gas mixture was delivered through PE90 plastic tubing that terminated 3 cm above the bottom of the cylinder (Fig. 1). The pH was maintained at 7.35 to 7.40, and in some experiments, phenol red was added to the medium to monitor changes in pH. Experiments were performed at 30°C.
Figure 1.
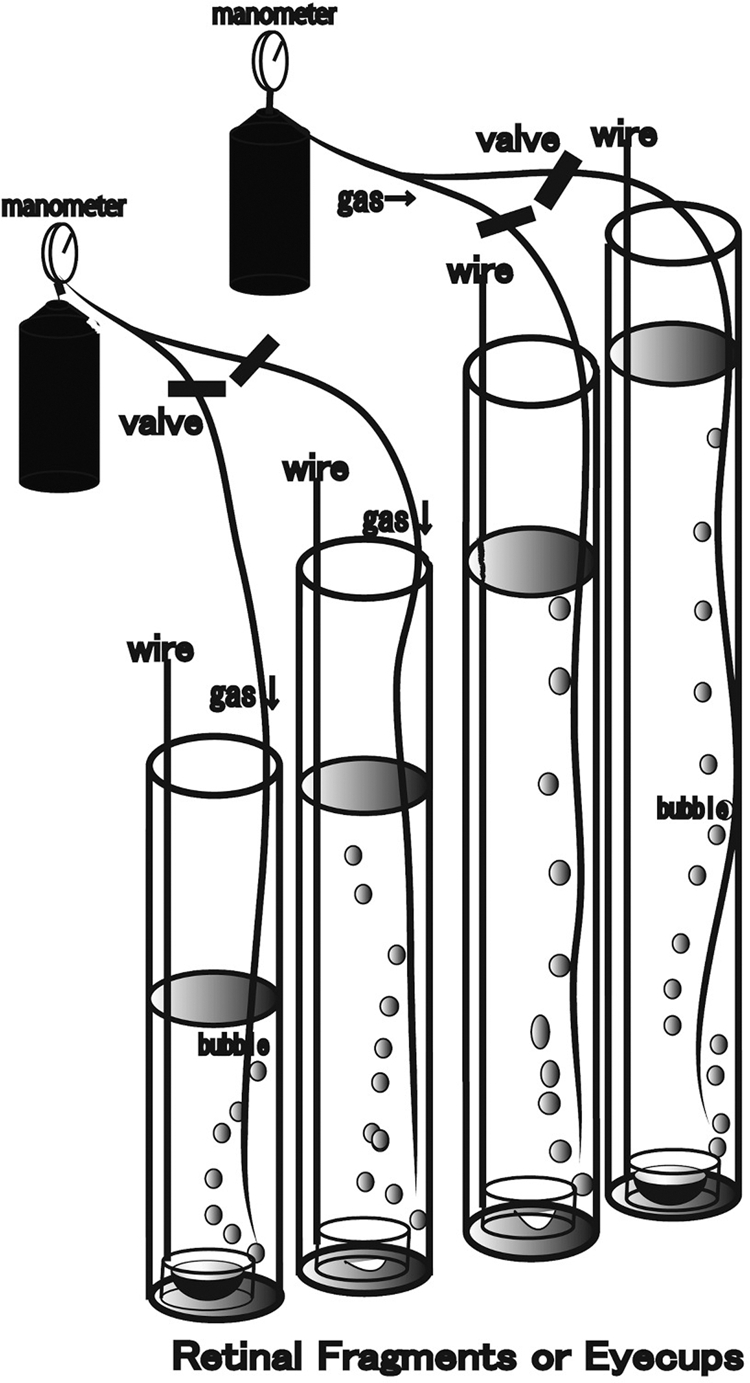
Diagram of the present experiments. Retinal segments or eye cups prepared from Sprague-Dawley rats were placed in plastic dishes that were 5 mm high and 2.5 cm in diameter. Each dish was suspended by a long stainless steel wire hooked through a hole in the lateral wall. With the wire, the specimen in the dish was slowly submerged to the bottom of a tall glass cylinder filled with aCSF at 30°C and left for 24 hours. The wire was fixed at the top of the cylinder after the dish was settled at the bottom of the cylinder. The diameter of the glass cylinder was 3 cm, and the height was 20, 50, 80, or 120 cm. Hydrostatic pressure at the bottom of the cylinder was calculated to be 10, 25, 50, or 75 mm Hg when aCSF was added to a height of 13.5, 33.7, 67.3, or 101.2 cm, respectively. The medium was constantly bubbled with 95% O2–5% CO2 throughout the experiments. The minimum gas pressure needed to drive gas through the PE90 plastic tubing was monitored before incubation. This minimum gas pressure reflects the pressure at the bottom of the open, tall cylinder. Glutamate, GYKI, or MK-801 was added to the aCSF during some experiments.
The pressure at the bottom of the incubation cylinder was calculated as P = ρgH (P, pressure; ρ, density of the aCSF; g, gravity; and H, height of the aCSF column). The depth of aCSF in the control column was adjusted to 13.5 cm to attain a pressure of 10 mm Hg. An IOP of 75 mm Hg, a pressure that can occur during a severe, acute glaucoma episode, was simulated by adjusting the CSF column height to 101.2 cm. Pressure-dependent changes in the retina were examined by incubating the specimens in the aCSF column with heights of 33.7 and 67.3 cm, which correspond to 25 and 50 mm Hg, respectively. In some experiments, glutamate (30 μM, 300 μM, and 1.0 mM) or glutamate receptor antagonists were added to the aCSF. In a previous study, typical Müller cell swelling was observed with 300 μM and 1.0 mM glutamate, although 30 μM glutamate did not induce remarkable changes in any layers of the retina. Based on these findings, we used glutamate concentrations of 30 μM, 300 μM, and 1.0 mM to examine excitotoxicity in the retina in the present study. A non-NMDA-type glutamate receptor antagonist, 100 μM GYKI 52446 (GYKI), and an NMDA type glutamate receptor antagonist, 10 μM dizocilpine (MK-801), were added to the aCSF starting 10 minutes before the introduction of pressure loading. The concentration of each antagonist was more than three times higher than the reported IC50s. Glutamate, MK-801, and GYKI were obtained from Sigma-Aldrich (St. Louis, MO).
The effects of hydrostatic pressure elevation, glutamate, and glutamate receptor antagonists on Müller cell swelling were determined by light and electron microscopy. To examine the reversibility of Müller cell swelling, we decreased the glutamate incubation period to 30 minutes. After that, the retinal segments were incubated in drug-free medium for 20 hours, with or without pressure elevation. Some retinas were exposed to pressure elevation for 20 hours after incubation with 1.0 mM glutamate for 30 minutes to examine the changes in glutamate uptake ability.
Light Microscopy
On completion of each experiment, the retinal segments were fixed in 1% paraformaldehyde and 1.5% glutaraldehyde in 0.1 M phosphate buffer overnight at 4°C. The fixed retinas were rinsed in 0.1 M phosphate buffer and placed in 1% buffered osmium tetroxide for 60 minutes. The retinas were dehydrated with alcohol, embedded in Epon 812 resin (TAAB Laboratories, Aldermaston, UK) and cut into 1-μm-thick sections for light microscopy. The tissue was then stained with methylene blue and azure II or toluidine blue and evaluated by light microscopy. In the present study, we examined the optic disc regions and the retinal segments taken from the middle part of the retina, approximately 1200 μm from the center of the optic disc.
Electron Microscopy
The retinal specimens were trimmed to a smaller size, and ultrathin sections (75 nm) were cut with a diamond knife and suspended over formvar-coated slot grids (1 × 2 mm opening). They were stained with uranyl acetate and lead citrate and viewed in a transmission electron microscope (H-7650, Hitachi High-Technologies Corp., Tokyo, Japan).
Data Analysis
For quantitative assessment of pressure-dependent changes of the nerve fiber layer thickness (NFLT) in the middle part of the retina, NFLT and total retinal thickness were measured at 30 different locations in light micrographs from each retinal block. When the retinas were incubated with glutamate in hyperbaric conditions, it sometimes became difficult to clearly identify the NFL at the level of light microscopic resolution. For quantitative assessment of the structural changes in NFL in these experimental conditions, NFLT was measured at 30 different locations in electron micrographs from each retinal block.
In the central retina, it became easy to distinguish the NFL from other structures by light microscopy. NFL thickness was analyzed according to the algorithms of optical coherence tomography22 as follows: The boundary of the optic disc was determined by the point at which the retinal pigment epithelium terminated at the scleral canal and served as a landmark. The disc diameter can be determined by measuring the distance between the disc boundaries (landmarks) on opposite sides of the disc. The NFLT and total retinal thickness can be measured by constructing a perpendicular to the line that defines the disc diameter from the landmarks.
Swollen axons, defined as having edematous axoplasm and shorter diameter greater than 1 μm, were counted in 30 electron micrographs of each specimen. The area of the NFL was measured with ImageJ 1.34 software (developed by Wayne Rasband, National Institutes of Health, Bethesda, MD; available at http://rsb.info.nih.gov/ij/index.html), and the density of the swollen axons was calculated per 100 μm of the NFL area.
The density of degenerated ganglion cells (GCs) was determined by counting 30 fields of 500-μm length at 30 different locations in light micrographs taken from the block of the middle retinal part.
The severity of neuronal damage was assessed in 30 fields of light micrographs from each middle retinal block by using a neuronal damage score (NDS).4 The NDS rates neuronal damage in the INL and IPL on a 0 to 4 scale, with 0 signifying no neuronal damage and four indicating very severe damage. Criteria used in establishing the degree of neuronal damage included the extent of cytoplasmic swelling in the IPL and the number of neurons in the INL showing signs of severe cytoplasmic swelling and coarse clumping of nuclear chromatin. Müller cell swelling was not counted. The highest NDS (4) was assigned when the IPL showed an apparent spongiform appearance due to dendritic swelling and when most somas in the INL showed severe cytoplasmic swelling and coarse clumping of nuclear chromatin. If the damage was to a lesser degree, a score of 3 was assigned. NDS 2 was assigned when somas in the INL were sporadically swollen. In NDS 1, damage did not fulfill the higher criteria, but the retinas differed from the control retinas (NDS 0). Fine dendritic swelling in a limited area of the IPL without damage in the INL was assigned NDS 2.
These morphometric parameters were assessed by three raters who remained unaware of the experimental condition. Before the study commenced, 12 samples of retinas incubated with various concentrations of kainate (0, 1, 10, 100, and 300 μM) were scaled by the raters, to determine the reliability of the scoring system. No significant differences were detected between the raters by one-way analysis of variance (one-way ANOVA) followed by the Tukey-Kramer test. On completion of data assessment, the significance of individual differences by the raters was evaluated with 10 randomly selected samples in each morphometric parameter, again. The data were double-checked and analyzed (Bioscience ver. 9.53, SPBS; Nankodo Publisher, Tokyo, Japan; StatView ver. 5; SAS Institute Inc., Cary, NC). Each parameter was compared with those of the control group by Mann-Whitney U test or Student's t-test. All analyses were two-sided and the results were considered statistically significant at P < 0.05.
Immunocytochemistry
For immunocytochemistry, specimens were fixed with 2% paraformaldehyde in 0.1 M phosphate-buffer for 2 hours at 4°C. They were then embedded in OCT compound (Sakura Global Holdings, Tokyo, Japan), and frozen with liquid nitrogen. The cryosections were incubated with anti-human GFAP antibody (Shima Laboratories Co., Tokyo, Japan). FITC-conjugated goat anti-rabbit IgG (Zymed Laboratories, Carlsbad, CA) was applied to the frozen sections as a secondary antibody. Binding sites of IgGs were detected by confocal laser scanning microscopy (LSM510 Axiovert200M; Carl Zeiss Meditec, Göttingen, Germany) imaging the localization of 4′,6-diamidino-2-phenylindole (DAPI; 405-nm laser line excitation; 420/480 emission filter) and FITC (488-nm laser line excitation; 505/530 emission filter). DAPI was used for nuclear staining. The images were captured with identical photomultiplier tube gain settings and processed (LSM-PC; Carl Zeiss Meditec, Inc., Foster City. CA), using the z-stack option. Images were reproduced for publication with image-management software (Photoshop 7.0; Adobe Systems Inc., Mountain View, CA).
GS Assay
GS catalyzes the reaction, glutamate + NH4+ + ATP → glutamine + ADP + Pi + H+, in the presence of Mn2+ or Mg2+. In the present study, inorganic phosphate released from ATP in the GS biosynthetic assay was detected colorimetrically.23
The retinas were recovered after incubation with pressure overload as just described, washed thoroughly with cold Hanks' buffer homogenized on ice in a solution containing 100 mM MOPS, 5 mM EDTA, and 200 mM sucrose (pH 7.0). After centrifugation (10,000g for 30 minutes at 4°C), the supernatant was kept at −70°C until assay. The protein concentration of retina samples was determined by the Bradford method (Bio-Rad ABC solution; Bio-Rad Laboratories, Hercules, CA) and serum γ-globulin as the standard.24 GS was assayed at optimum assay conditions, as described.25,26
Results
Pressure-Dependent Changes in the Peripheral Retina
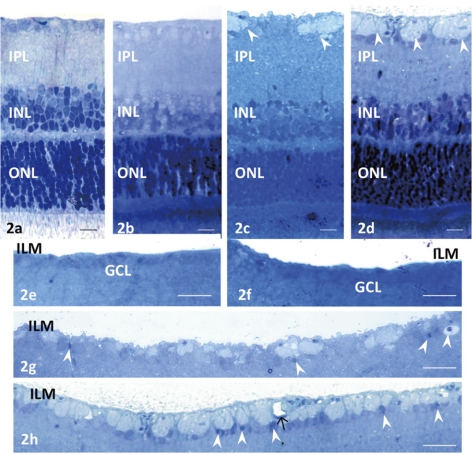
The pressure dependence of axonal swelling in the NFL was determined by obtaining retinal segments from the middle part of the retina and incubating them in aCSF for 24 hours at 10, 25, 50, or 75 mm Hg. The retinas incubated at 10 and 25 mm Hg exhibited a normal appearance (Figs. 2a, 2b, 2e, 2f). By contrast, pressure overload at 50 mm Hg led to axonal swelling in the NFL (Figs. 2c, 2g). The other retinal layers remained intact except the IPL, in which several small vacuoles were present. Pressure overload at 75 mm Hg increased the density and size of the swollen axons in the NFL (Fig. 2d, 2h), and small vacuoles were present in the IPL. A few GC nuclei became pyknotic and shrunken at 50 and 75 mm Hg (Figs. 2g, 2h).
Figure 2.
Light micrographs of pressure-dependent changes in the middle part of the retina. In retinas incubated at (a) 10 and (b) 25 mm Hg, no abnormal changes were detected in any layers. (c) Axonal swelling (arrowheads) was found in the NFL of a retina incubated at 50 mm Hg. Several small vacuoles were present in the IPL. The other retinal layers remained intact. (d) Prominent swelling of the optic nerve fibers (arrowheads) was observed in a retina incubated at 75 mm Hg. Several small vacuoles were present in the IPL. Retinal degeneration was not observed in other layers of the retina. Light micrographs of pressure-dependent changes in the NFL. In retinas incubated at (e) 10 and (f) 25 mm Hg, no remarkable changes were observed. (g) Axonal swelling was found in the NFL of a retina incubated at 50 mm Hg. Arrowheads: shrunken nuclei of GCs. (h) A retina incubated at 75 mm Hg exhibited remarkable swelling of the optic nerve fibers in the NFL. Arrowheads: shrunken GC nuclei; arrow: a capillary. Scale bar: (a–d) 10 μm; (e–h) 23 μm.
Glutamate-Dependent Changes in the Peripheral Retinas
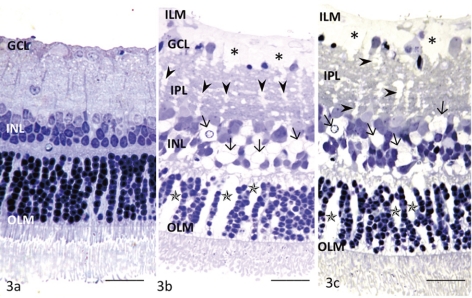
The concentration dependence of glutamate toxicity was determined by incubating retinal segments obtained from the middle part of the retina with various concentrations of glutamate for 24 hours at 10 mm Hg. Administration of 30 μM glutamate did not induce remarkable changes in any layers of the retina (Fig. 3a). Müller cell swelling was induced by 300 μM glutamate without detectable changes in the retinal neurons (Fig. 3b). Several GCs showed degeneration and shrinkage of the nuclei. The retinas exposed to 1.0 mM glutamate also showed Müller cell swelling along with nuclear pyknosis in the GC layer (GCL; Fig. 3c).
Figure 3.
Light micrographs of glutamate-dependent changes in the middle part of the retina. (a) No remarkable changes were induced by 30 μM glutamate in any layers of the retina incubated at 10 mm Hg. OLM, outer limiting membrane. (b) This retina exhibited Müller cell swelling beneath the ILM (*) induced by 300 μM glutamate at 10 mm Hg. The glial swelling was also observed in the IPL (arrowheads), INL (arrows), and ONL (*). (c) A retina exhibiting prominent Müller cell swelling beneath the ILM (*) induced by 1.0 mM glutamate at 10 mm Hg. Glial swelling is observed in the IPL (arrowheads), INL (arrows), and ONL (*). Scale bar, 15 μm.
Effects of Pressure on Glutamate-Induced Toxicity
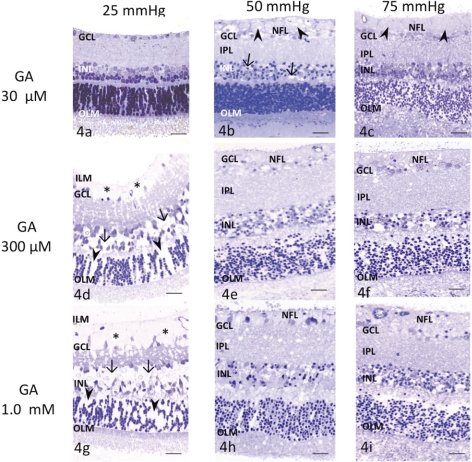
Administration of 30 μM glutamate did not induce remarkable changes in any layers of the retina at 25 mm Hg (Fig. 4a). Prominent axonal swelling was induced by 30 μM glutamate at 50 mm Hg (Fig. 4b), and several GCs showed degeneration and nuclear shrinkage. Dendritic swelling in the IPL and nuclear shrinkage in the INL were also observed. Retinas exposed to 30 μM glutamate at 75 mm Hg showed axonal swelling in the NFL along with excitotoxic neural damage, characterized by a spongiform appearance of the IPL and bull's-eye formation in the INL (Fig. 4c).
Figure 4.
Light micrographs of pressure- and glutamate-dependent changes in the middle part of the retina. OLM, outer limiting membrane. (a) Administration of 30 μM glutamate at 25 mm Hg induced no remarkable changes. (b) Administration of 30 μM glutamate (GA) at 50 mm Hg induced marked axonal swelling (arrowheads) in the NFL. Several GCs showed nuclear pyknosis. The retina exhibited a spongy appearance in the IPL and neural degeneration in the INL (arrows). (c) A retina exposed to 30 μM glutamate at 75 mm Hg showed axonal swelling (arrowheads) in the NFL, along with neural degeneration in the IPL, INL, and ONL. (d) Administration of 300 μM glutamate induced Müller cell swelling and pyknosis of the GCs at 25 mm Hg. Glial swelling was observed beneath the ILM (*), and in the INL (arrows) and ONL (arrowheads). (e, f) Administration of 300 μM glutamate induced excitotoxic neural damage, characterized by dendritic swelling in the IPL and bull's-eye formation in the INL at (e) 50 and (f) 75 mm Hg. The optic nerve fibers in the NFL were swollen and damaged and nuclei of GCs became pyknotic. (g) Retina exhibiting prominent Müller cell swelling beneath the ILM (*) induced by 1.0 mM glutamate at 25 mm Hg. Glial swelling was observed in the INL (arrows) and ONL (arrowheads). Administration of 1.0 mM glutamate induced excitotoxic neural damage, characterized by dendritic swelling in the IPL and bull's-eye formation in the INL at (h) 50 and (i) 75 mm Hg. The optic nerve fibers were swollen and damaged in the NFL. The GCL showed severe degeneration. Scale bar, 55 μm.
Administration of 300 μM glutamate induced pyknosis of GC nuclei at 25 mm Hg along with prominent Müller cell swelling (Fig. 4d). At 50 and 75 mm Hg, administration of 300 μM glutamate induced typical excitotoxic neural damage characterized by dendritic swelling in the IPL and bull's-eye formation in the INL, along with axonal swelling in the NFL (Figs. 4e, 4f).
Administration of 1.0 mM glutamate caused marked Müller cell swelling in the inner retina at 25 mm Hg (Fig. 4g). In addition, nuclei of the GCs developed a shrunken appearance. Administration of 1.0 mM, glutamate at 50 and 75 mm Hg induced excitotoxic neural damage, along with axonal swelling in the NFL (Figs. 4h, 4i). In addition, the optic nerve fibers and GCs showed severe damage.
Structural Changes Induced by Pressure Elevation and Glutamate in the Ganglion Cell Layer and Optic Disc Region
Middle Part of the Retina.
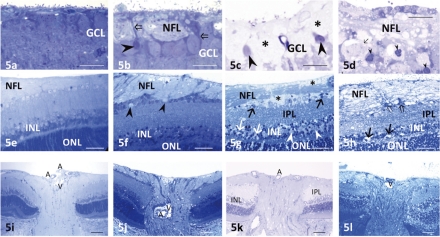
Compared with the control retinas (Fig. 5a), a few GC nuclei became pyknotic and shrunken, and marked axonal swelling was observed in the NFL in retinas at high pressure (Fig. 5b). After exposure to glutamate at control pressure, the GCs were surrounded by the swollen end feet of Müller cells (Fig. 5c). A few of the GC nuclei became pyknotic and shrunken. With the combination of high pressure and glutamate, the GCs became necrotic, and most exhibited nuclear chromatin condensation (Fig. 5d). Severe degeneration was induced in the NFL.
Figure 5.
Light micrographs of the GCL in the middle retinal segments. (a) A control retina incubated at 10 mm Hg. (b) Axonal swelling of the retinal GCs was observed after exposure to elevated hydrostatic pressure (75 mm Hg). A small number of GCs showed nuclear pyknosis (arrowhead). Open arrows indicate the process of a Müller cell surrounding the GCs. (c) Müller cell swelling (*) was induced by administration of 1.0 mM glutamate. Several GCs showed nuclear pyknosis (arrowheads). (d) The combination of 1.0 mM glutamate and 75 mm Hg pressure loading resulted in severe excitotoxicity. The NFL exhibits marked degeneration, and GCs show necrosis (arrow) or nuclear pyknosis (arrowheads). (e–h) Light micrographs in regions adjacent to the optic discs (the optic disc is usually situated to the left in each photograph). (e) A retina incubated at 10 mm Hg showing normal appearance. The NFL was prominent in the vicinity of the optic disc, but tapered off toward the periphery in the control retina. (f) Remarkable axonal swelling in the NFL was induced by pressure loading (75 mm Hg). Several GCs exhibited degeneration (arrowheads). No significant changes were observed in the remaining layers of the retina. (g) Administration of 1.0 mM glutamate induced Müller cell swelling (*) adjacent to the nerve fiber bundles in the NFL. GCs (arrows) are observed floating in swollen Müller cell. Black arrows: degenerated GCs. Excitotoxic changes characterized by bull's-eye formation (white arrows) in the INL and a spongiform appearance of synapses in the IPL were observed. White arrowheads: Müller cell swelling in the INL. (h) Excitotoxic degeneration characterized by bull's-eye formation (arrows) in the INL and Swiss cheese–pattern dendritic swelling in the IPL was induced by combining pressure loading (75 mm Hg) and glutamate (1.0 mM). The NFL and GCs (open arrows) were severely damaged. (i–l) Light micrographs of the optic discs. (i) A control retina incubated at 10 mm Hg. The rat optic nerve head has only rudimentary lamina cribrosa. Unmyelinated fibers run through the scleral canal, and converge into the optic nerve. A, central retinal artery; V, central retinal vein. (j) After pressure loading (75 mm Hg), the axons in the optic nerve head were swollen. (k) Administration of 1.0 mM glutamate-induced neural degeneration in the IPL and INL. (l) A combination of pressure loading (75 mm Hg) and glutamate (1.0 mM) induced severe degeneration in the NFL and excitotoxic degeneration in the remaining layers of the retina. Scale bar: (a–d) 12 μm; (e–h) 35 μm; (i–l) 65 μm.
Central Retina around the Optic Disc.
Control retinas showed a normal appearance in the vicinity of the optic disc (Fig. 5e). The NFL adjacent to the optic disc was prominently thick but exhibited a gradual decrease in thickness toward the peripheral retina. High pressure (75 mm Hg) induced remarkable axonal swelling in the optic disc region (Fig. 5f), and several GC nuclei showed degeneration. The remaining layers in the retina showed no remarkable changes. Administration of 1.0 mM glutamate caused swelling of the Müller glia surrounding the optic nerve fiber bundles in the vicinity of the optic disc (Fig. 5g). Some excitotoxic degeneration, characterized by bull's-eye formation in the INL and a spongiform appearance in the IPL, was noted, but the changes were not dramatic. Ganglion cells appeared to be floating in the swollen end-feet of Müller cells. The combination of high pressure and glutamate induced severe excitotoxic retinal degeneration, and optic nerve fibers also showed severe degeneration (Fig. 5h).
Optic Disc Area.
In control retinas, the lamina cribrosa of the optic disc was rudimentary (Fig. 5i). The axons of the GCs organized into bundles and extended to the optic nerve through the scleral canal. At high pressure (75 mm Hg), axonal swelling in the optic disc led to histologic evidence of disc edema (Fig. 5j). Administration of glutamate (1.0 mM) induced neuronal degeneration in the IPL and the INL (Fig. 5k). Combination of high pressure and glutamate induced excitotoxic degeneration, and optic nerve fibers exhibited severe degeneration (Fig. 5l).
Involvement of Glutamate Receptors in Axonal Swelling Induced by Pressure Elevation
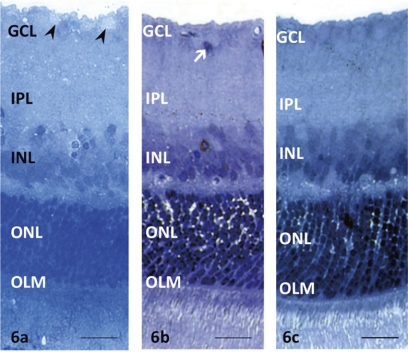
To determine whether the axonal swelling induced by pressure elevation resulted from the activation of glutamate receptors, we administered GYKI, a non-NMDA receptor antagonist, and MK-801, an NMDA receptor antagonist, alone or in combination, to retinas exposed to high pressure (75 mm Hg) for 24 hours. GYKI partially attenuated the axonal swelling and significantly reduced the number of swollen axons (Fig. 6a). In contrast, MK-801-treated retinas showed substantial neuroprotection against high pressure, but failed to protect the GC nuclei (Fig. 6b), many of which showed pyknosis or nuclear shrinkage. GYKI and MK-801 combined provided nearly complete neuroprotection (Fig. 6c).
Figure 6.
Light micrographs of middle retinal segments treated with glutamate receptor antagonists. (a) Retinal segments exposed to elevated pressure (75 mm Hg) and treated with 100 μM GYKI alone had partial axonal swelling (arrowheads) in the NFL. OLM outer limiting membrane. (b) MK-801 (10 μM) alone substantially prevented axonal swelling, but pyknotic GC nuclei remained (arrow). No remarkable changes were observed in other layers of the retina. (c) A combination of GYKI and MK-801 produced almost complete neuroprotection against the effects of pressure loading (75 mm Hg). Scale bar, 15 μm.
Reversibility of Glutamate-Induced Müller Cell Swelling
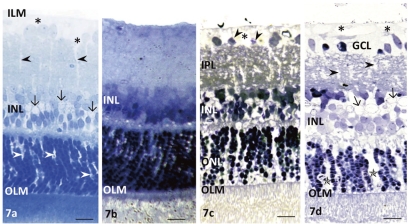
To examine the reversibility of Müller cell swelling, we shortened the incubation period with glutamate to 30 minutes. After that time, Müller cell swelling was apparent in the end feet in the GCL and in glial nuclei of the INL (Fig. 7a). The swelling was reversed by subsequent incubation in drug-free medium for 20 hours at 30°C without pressure elevation (Fig. 7b). In contrast, the reversibility of glutamate-mediated Müller cell swelling was inhibited by subsequent incubation in the drug-free medium for 20 hours under high-pressure loading (75 mm Hg; Fig. 7c). Retinal segments exposed to high pressure for 20 hours and then incubation with 1.0 mM glutamate for 30 minutes showed apparent swelling of the end feet of the Müller cells in the GCL and in glial nuclei in the INL (Fig. 7d).
Figure 7.
Reversibility of glutamate-mediated Müller cell swelling. (a) Glutamate (1.0 mM) administered at normal pressure for 30 minutes induced swelling of the Müller cell end feet (*) in the GC layer and in the nuclei (arrows). Black arrowheads and arrows: swelling of Müller cell bodies and nuclei, respectively. There was swelling of Müller cell bodies in the outer nuclear layer (white arrowheads). OLM, outer limiting membrane. (b) Müller cell swelling induced by 1.0 mM glutamate was not present 20 hours after removal of glutamate from the medium. OLM, outer limiting membrane. (c) The reversal of Müller cell swelling during incubation in glutamate-free medium was prevented by elevated pressure (75 mm Hg) for 20 hours. (*) Swelling of the Müller cell end feet. There was swelling of Müller cell bodies in the IPL, INL, and ONL. Arrowheads: the degenerated or pyknotic GC nuclei. OLM, outer limiting membrane. (d) Incubation with 1.0 mM glutamate after pressure loading (75 mm Hg) for 20 hours induced apparent swelling of the Müller cell end feet (*) in the GCL. Black arrowheads and arrows: the swelling of the Müller cell bodies and nuclei, respectively. There was a remarkable swelling of the Müller cell bodies in the ONL (*). Arrowheads: degenerated or pyknotic GC nuclei. OLM, outer limiting membrane. Scale bar, 15 μm.
Ultrastructural Investigation by Electron Microscopy
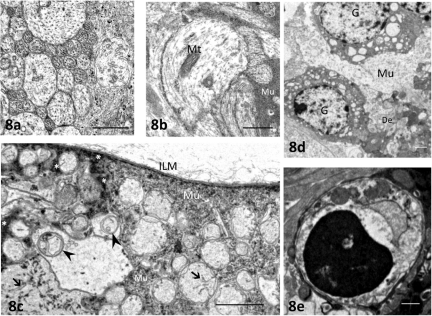
Compared with control retinas incubated at 10 mm Hg (Fig. 8a), electron microscopy revealed degeneration and substantial swelling of axons after exposure to high pressure (75 mm Hg; Fig. 8b). In addition, the combination of high pressure and glutamate (1.0 mM) resulted in disruption of the GC axonal membranes (Fig. 8c) and marked accumulation of membranous structures or electron-dense materials in the swollen axons. The cytoplasm of the Müller cells became edematous, and electron-dense materials were deposited in some parts of the cytoplasm. The combination of high pressure and glutamate also induced an increase in the number of necrotic GCs (Fig. 8d), with chromatin condensation at the edge of the nucleus, and apoptotic bodies (Fig. 8e).
Figure 8.
Electron micrographs of the NFL and GCL. (a) Control NFLs contained numerous axons of various sizes. Each axon contained neurofilaments and microtubules. (b) After exposure to high pressure (75 mm Hg) for 24 hours, numerous axons in the NFL were swollen. Mt, mitochondrion; Mu, cytoplasm of the Müller cell. (c) After exposure to high pressure (75 mm Hg) and glutamate (1.0 mM), there were degenerated organelles (arrowheads) and filamentous structures (arrows) in the swollen axons. Electron-dense materials (*) or granular structures are distributed in the cytoplasm of Müller cell (Mu). (d) After exposure to high pressure (75 mm Hg) and glutamate (1.0 mM), ganglion cells (G) became necrotic, as indicated by the abundant presence of vacuoles in the cytoplasm. De, degenerated dendrites; Mu, edematous cytoplasm of the Müller cell. (e) Some GCs had condensed nuclear chromatin and cytoplasmic shrinkage. Scale bar: (a, b) 0.5 μm; (c–e) 2 μm.
Quantitative Analysis of the Structural Changes
A quantitative assessment of the pressure-dependent structural changes is summarized in Table 1. The NFLT in retinas incubated at higher pressure (50 or 75 mm Hg) was significantly increased compared with that in the control retinas (incubated at 10 mm Hg). Similarly, the density of swollen axons and damaged GCs and NDS ratings were significantly increased at higher pressures. Pressure overload at 75 mm Hg, compared with 50 mm Hg, increased the NFLT, the densities of the swollen axons, and the damaged GCs and NDS (P = 0.01). There were no significant differences in these parameters at 10 and 25 mm Hg (P = 0.87).
Table 1.
Pressure-Dependent Changes in NFLT or a Percentage of NFLT to Total Retinal Thickness, Densities of Swollen Axons (Ax), and Damaged GCs and NDS
| Condition (n) | NFLT ± SE (μm) [P] | NFLT ± SE (%) [P] | Ax ± SE (n) [P] | GC ± SE (n) [P] | NDS ± SE (n) [P] |
|---|---|---|---|---|---|
| 10 mm Hg (5) | 2.4 ± 1.3 [−] | 1.5 ± 0.6 [−] | 0.2 ± 0.5 [−] | 0.5 ± 0.2 [−] | 0.1 ± 0.1 [−] |
| 25 mm Hg (5) | 2.6 ± 1.2 [0.92] | 1.7 ± 0.7 [0.96] | 0.3 ± 0.7 [0.98] | 0.6 ± 0.4 [0.89] | 0.2 ± 0.1 [0.93] |
| 50 mm Hg (5) | 7.9 ± 4.2 [0.002]* | 5.8 ± 1.7 [0.002]* | 6.5 ± 4.6 [<0.001]* | 7.5 ± 2.8 [0.002]* | 0.8 ± 0.3 [0.010]* |
| 75 mm Hg (7) | 12.8 ± 3.7 [<0.001]* | 9.2 ± 2.6 [<0.001]* | 13.5 ± 4.3 [<0.001]* | 8.8 ± 3.6 [0.002]* | 0.9 ± 0.4 [0.009]* |
The density of swollen axons was counted per 100 μm2 of the NFL. The density of damaged GCs was counted per 500 μm of retina. Ps were calculated vs. the control (10 mm Hg) by Mann-Whitney U test.
Statistical significance was set at P < 0.05.
The quantitative assessment of the structural changes induced by high pressure (75 mm Hg) and/or administration of 1.0 mM glutamate is summarized in Table 2. The NFLT after exposure to high pressure alone or after a combination of high pressure and 1.0 mM glutamate was significantly increased compared with that in the control retinas, whereas glutamate alone did not increase NFLT in the middle and central retina. Similarly, the densities of swollen axons and damaged GCs and the NDS were significantly increased after exposure to high pressure or a combination of glutamate and high pressure. The density of damaged GCs also increased after the administration of glutamate.
Table 2.
Effects of Pressure Elevation to 75 mm Hg and 1.0 mM GA on NFLT or a Percentage of NFLT to Total Retinal Thickness, Density of Swollen Axons (Ax), and Damaged GCs and NDS
| Condition (n) | Middle NFLT ± SE (μm) [P] NFLT ± SE (%) [P] | Central NFLT ± SE (μm) [P] NFLT ± SE (%) [P] | Middle Ax ± SE [P] | Middle GC ± SE [P] | Whole Retina NDS ± SE [P] |
|---|---|---|---|---|---|
| Control (5) | 2.6 ± 0.8 [−] | 13.5 ± 2.6 [−] | 0.9 ± 0.5 [−] | 0.1 ± 0.5 [−] | 0.2 ± 0.1 [−] |
| 1.4 ± 0.5 [−] | 6.1 ± 1.2 [−] | ||||
| Pressure (5) | 13.9 ± 4.7 [<0.001]* | 22.9 ± 4.4 [<0.001]* | 11.2 ± 2.5 [<0.001]* | 9.7 ± 5.6 [<0.001]* | 1.0 ± 0.5 [0.002]* |
| 9.0 ± 2.4 [<0.001]* | 9.3 ± 1.6 [0.002]* | ||||
| GA (5) | 2.7 ± 0.9 [0.96] | 12.9 ± 2.0 [0.82] | 1.3 ± 0.7 [0.99] | 10.0 ± 1.5 [<0.001]* | 0.4 ± 0.4 [0.29] |
| 1.5 ± 0.7 [−] | 5.8 ± 2.2 [0.93] | ||||
| Pressure + GA (7) | 15.4 ± 3.5 [<0.001]* | 25.3 ± 8.9 [<0.001]* | 38.3 ± 6.3 [<0.001]* | 20.1 ± 5.6 [<0.001]* | 3.6 ± 0.5 [<0.001]* |
| 9.8 ± 3.4 [<0.001]* | 11.3 ± 5.4 [0.002]* |
Axon and GC counts and calculation of probabilities are as described in Table 1. GA, glutamate.
Statistical significance was set at P <0.05.
Quantitative assessment of the structural changes in the presence of the glutamate receptor antagonists GYKI and MK-801 is summarized in Table 3. The NFLT in the retinas treated with GYKI alone was significantly greater than in the control retinas. Similarly, the density of swollen axons and the NDS were significantly increased after treatment with GYKI alone compared with that in the control retinas. The density of the damaged GCs was greater in the retinas treated with GYKI alone or MK-801 alone compared with those in the control retinas. By contrast, there were no significant differences in these parameters compared with those in the control in retinas treated with a combination of GYKI and MK-801.
Table 3.
Effects of the Glutamate Receptor Antagonists GYKI and MK-801 on NFLT or a Percentage of NFLT to Total Retinal Thickness, Density of Swollen Axons (Ax), and Damaged GCs and NDS in the Middle Retina
| Condition (n) | NFLT ± SE (μm) [P] | NFLT ± SE (%) [P] | Ax ± SE (n) [P] | GC ± SE (n) [P] | NDS ± SE (n) [P] |
|---|---|---|---|---|---|
| Control (5) | 3.4 ± 1.8 [−] | 2.1 ± 1.3% [−] | 0.6 ± 0.4 [−] | 0.6 ± 0.5 [−] | 0.3 ± 0.2 [−] |
| GYKI alone (6) | 7.8 ± 3.7 [0.032]* | 4.2 ± 1.6 [0.034]* | 6.5 ± 3.8 [0.005]* | 2.5 ± 1.6 [0.045]* | 0.7 ± 0.3 [0.043]* |
| MK-801 (5) | 2.7 ± 0.9 [0.91] | 1.2 ± 0.7 [0.88] | 0.3 ± 0.7 [0.89] | 2.3 ± 1.2 [0.034]* | 0.6 ± 0.4 [0.39] |
| GYKI + MK-801 (7) | 2.4 ± 0.5 [0.98] | 1.8 ± 0.6 [0.79] | 0.2 ± 0.5 [0.98] | 0.3 ± 0.6 [0.84] | 0.3 ± 0.3 [0.85] |
Axon and GC counts and calculation of probabilities are as described in Table 1. GA, glutamate.
Statistical significance was set at P < 0.05.
To confirm the reproducibility of data assessment, we evaluated the significance of individual differences in the raters by one-way ANOVA followed by the Tukey-Kramer test. For example, there was no significant difference in the NFLT at 10 mm Hg between three raters (27 df, P > 0.05 by one-way ANOVA). As a result, there were no significant individual differences between the raters for each morphometric parameter.
GFAP Immunoreactivity
GFAP was expressed by the end feet of the Müller cells in the retinas incubated at pressures of 10 mm Hg (Fig. 9a) and 25 mm Hg (Fig. 9b). The Müller cells expressed GFAP in the inner retina after exposure to higher pressure (50 mm Hg) for 24 hours (Fig. 9c), and GFAP expression markedly increased after incubation at 75 mm Hg (Fig. 9d). After exposure to 1.0 mM glutamate alone, expression was confined in the vicinity of the end feet of the Müller cells (Fig. 9e). The combination of high pressure (75 mm Hg) and 1.0 mM glutamate induced extensive Müller cell GFAP expression, even extending into the inner retina (Fig. 9f).
Figure 9.
Immunofluorescent localization of GFAP by confocal microscopy. Nuclei in the GCL, INL, and ONL were counterstained with DAPI. (a) GFAP expression was restricted to the end feet of Müller cells (arrow) in a control retina (10 mm Hg). (b) The retina incubated at 25 mm Hg showed positive fluorescence only in the end feet of the Müller cells (arrow). (c) A retina incubated at 50 mm Hg showed positive fluorescence (arrowheads) throughout the Müller cell body along with the end feet of Müller cells (arrow). (d) At 75 mm Hg, prominent GFAP expression was observed throughout the Müller cell body (arrowheads) along with the end feet of the Müller cells (arrow). (e) After administration of 1.0 mM glutamate, GFAP expression was restricted to the vicinity of the Müller cell end feet (arrowheads). (f) Müller cells expressed prominent immunolabeling for GFAP throughout the length of the cell body (arrowheads) along with the end feet of the Müller cells after a combination of pressure loading (75 mm Hg) and 1.0 mM glutamate. Scale bar, 20 μm.
GS Activity
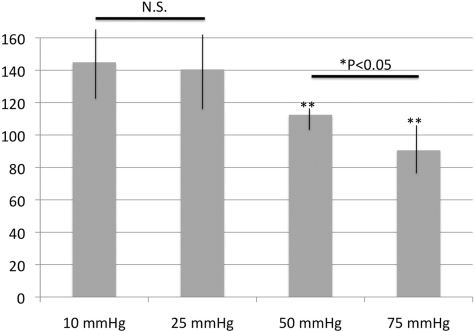
A colorimetric enzyme assay showed GS activity to be 144 ± 29, 140 ± 23, 112 ± 17, and 92 ± 25 U/mg protein at 10, 25, 50, and 75 mm Hg, respectively (Fig. 10). There were no significant differences in GS activity between pressures of 10 and 25 mm Hg. GS activity was significantly reduced at 50 and 75 mm Hg compared with that at 10 mm Hg. In addition, there was a significant reduction of GS activity at 75 mm Hg compared with that at 50 mm Hg.
Figure 10.
GS activity in retinal homogenates incubated at various pressures for 24 hours. There were no statistically significant changes in GS activity at 10 and 25 mm Hg. GS activity was significantly reduced after exposure to 50 or 75 mm Hg compared with that at 10 mm Hg. There was also a significant reduction of GS activity at 75 mm Hg compared with that at 50 mm Hg (P = 0.014, *P < 0.05 by Mann-Whitney U test). For these studies, we examined 10 control and 10 pressure-loaded retinal samples. NS, no significant difference. **P < 0.001 by Mann-Whitney U test versus control retina (incubated at 10 mm Hg).
Discussion
In the present study, we developed a new ex vivo experimental model for acute glaucoma that involves incubating rat retinal segments under hydrostatic pressure at the bottom of a deep cylinder. Although this system produced reliable results, we noted several limitations in the model. First, critical survival factors supplied from the bloodstream or axonal transport were not provided to the retinal segments. Thus, the incubation period had to be time limited. Second, the hydrostatic pressure used did not precisely simulate the pressure changes observed in glaucoma. Pressure was exerted on the submerged retinal segments from all directions. In contrast, the intact retina, as a membranous tissue, receives pressure from only one direction. Furthermore, interpretation of the damage was complicated because separation of the pigment layer during dissection may cause a situation similar to retinal detachment and because optic nerve transection during dissection may induce additional damage. Despite these limitations, we believe that our ex vivo experimental model is beneficial for addressing questions about mechanisms contributing to glaucoma. The advantages of this model include the higher degree of control over experimental variables and better preservation of neuron–neuron and neuron–glial interactions than is possible in dissociated cell preparations.
Of interest in the present study is the finding that axonal swelling of the GCs was induced in a pressure-dependent manner. The retinas incubated in control pressure exhibited normal appearance, whereas axonal swelling became more prominent as pressure increased. In the central nervous system, activation of neuronal glutamate receptors induces swelling of cell bodies and dendrites27–30 and also produces Na+-dependent blebs in acutely isolated hippocampal neurons.31 This swelling is caused by the influx of Na+ and Ca2+ and the passive redistribution of chloride and water across neuronal membranes.29,32 Similar events occurring in axons could contribute to the findings observed in this study. Because a combination of the glutamate receptor antagonists GYKI and MK-801 attenuated the axonal swelling, we hypothesize that glutamate-mediated excitotoxicity contributes to the development of axonal swelling in hyperbaric conditions. The partial attenuation of the axonal swelling by GYKI alone may be explained by a smaller contribution of non-NMDA receptors to pressure-induced retinal damage and may also reflect the predominant distribution of NMDA receptors in GCs.33
It has been reported that presynaptically released glutamate may reach levels of 1.0 mM in the synaptic cleft.34 We have shown that, in normal conditions, 1.0 mM glutamate induces significant changes in the retina as a result of Müller cell uptake of glutamate along with sodium ions. However, this Müller cell swelling is reversible after glutamate washout, and neurons are not damaged. Higher concentrations of glutamate may induce neuronal damage,12 and concentrations below 100 μM produce few changes in either Müller cells or neurons. In the present study, we observed that 30 μM glutamate did not induce remarkable changes in any layers of the retina at the lower pressures (10 or 25 mm Hg). However, it became excitotoxic at elevated pressures (50 or 75 mm Hg). Because 30 μM glutamate is usually nontoxic, these results suggest that intrinsic glutamate induces excitotoxicity under hyperbaric conditions.
Glutamate concentration may rise significantly in pathologic conditions such as glaucoma. When glutamate levels are persistently elevated, Müller cell swelling is an indicator of Müller cell function as manifested by glutamate transport. The present study showed that initial changes induced by excessive glutamate (300 μM or 1.0 mM) at normal pressure consisted of reversible Müller cell swelling. Under these conditions, neurons are not damaged; rather, the swelling appears to be a result of protecting neurons from glutamate toxicity.35 However, glutamate did not induce typical Müller cell swelling at higher hydrostatic pressures (50 or 75 mm Hg) in the present study. If Müller cell swelling is an indicator of glial function, higher pressure may suppress the neuroprotective function of the Müller cells against glutamate and induce glutamate-mediated excitotoxicity.
Prior studies indicate that Müller cell swelling is associated with the uptake of glutamate and sodium, and the passive redistribution of chloride and water through the astrocyte-specific transporter GLAST.5 After being taken up by the Müller cells, glutamate is rapidly converted to glutamine by the enzyme GS. GS activity in turn influences the rate of glutamate uptake by the Müller cells,36 and the rapid conversion of glutamate to glutamine causes a strong driving force for glutamate uptake in the Müller cells. Thus, when GS activity is diminished, it is likely that glutamate uptake by the Müller cells will be reduced and typical Müller cell swelling in the presence of elevated glutamate will be depressed. Consistent with this, we observed a significant decrease in GS activity along with inhibition of typical Müller cell swelling at higher incubation pressures (50 and 75 mm Hg). Based on these findings, we speculate that high pressure impairs glutamate metabolism primarily by inhibiting GS, thus reducing glutamate uptake by the Müller glia and resulting in glutamate-mediated excitotoxicity. A previous report demonstrating a decline in GS immunoreactivity in Müller cells in a canine model of glaucoma is consistent with this notion.11
As has been reported,37 Müller cell swelling is reversible if glutamate is converted to glutamine via GS, as the inhibition of GS disrupts the reversibility. However, Müller cell swelling was irreversible in hyperbaric conditions. These results are consistent with the results of the GS enzyme assay, which revealed a significant decrease in GS activity at higher pressures.
In our study, it was difficult to determine whether inhibition of Müller cell swelling in hyperbaric conditions was primarily caused by impairment of glutamate uptake or was secondary to GS inhibition. We had observed in previous work that inhibition of glutamate uptake without adding exogenous glutamate leads to severe excitotoxic degeneration.5,37 To examine these questions histologically, we incubated ex vivo rat retinal segments that were exposed to elevated hydrostatic pressure with 1.0 mM glutamate at normal pressure for short periods. In this protocol, Müller cell swelling was apparent, indicating that glial glutamate uptake is preserved after pressure loading. Based on these findings, we speculate that high pressure impairs glutamate metabolism but not glutamate uptake.
The present study also demonstrated pressure-dependent changes in GFAP expression in Müller cells. GFAP was expressed by the end feet of Müller cells in retinas incubated at lower pressures (10 or 25 mm Hg), whereas GFAP expression markedly increased after exposure to higher pressures (50 or 75 mm Hg). These findings correlate well with results from the GS enzyme assay in which we observed a significant decrease in GS activity at higher pressures. Although the precise role of GFAP expression in the pathogenesis of glaucoma is still unclear,7 GFAP expression suggests that Müller cell dysfunction induced by pressure elevation influences neuron–glia interactions via changes in glutamate metabolism and an imbalance of intra- and extracellular ionic homeostasis.
Acknowledgments
The authors thank Yoko Hayami, Sanae Takaseki, and Yumi Hirata for technical support on the rating of the morphologic findings.
Footnotes
Supported in part by National Institute of Health Grant MH077791, Neuroscience Blueprint Core Grant NS57105, and the Bantly Foundation.
Disclosure: M. Ishikawa, None; T. Yoshitomi, None; C.F. Zorumski, None; Y. Izumi, None
References
- 1. Lucas DR, Newhouse JP. The toxic effect of sodium L-glutamate on the inner layers of the retina. Arch Ophthalmol. 1957;58:193–201 [DOI] [PubMed] [Google Scholar]
- 2. Olney JW. Glutamate-induced retinal degeneration in neonatal mice: electron microscopy of the acutely evolving lesion. J Neurophathol Exp Neurol. 1969;28:455–474 [DOI] [PubMed] [Google Scholar]
- 3. Casper DS, Trelstad RL, Reif-Lehrer L. Glutamate-induced cellular injury in isolated chick embryo retina: Müller cell localization of initial effects. J Comp Neurol. 1982;209:79–90 [DOI] [PubMed] [Google Scholar]
- 4. Izumi Y, Kirby CO, Benz AM, Olney JW, Zorumski CF. Swelling of Müller cells induced by AP3 and glutamate transport substrates in rat retina. Glia. 1996;17:285–293 [DOI] [PubMed] [Google Scholar]
- 5. Izumi Y, Kirby CO, Benz AM, Olney JW, Zorumski CF. Müller cell swelling, glutamate uptake and excitotoxic neurodegeneration in the isolated rat retina. Glia. 1999;25:379–389 [PubMed] [Google Scholar]
- 6. Gorovits R, Avidan N, Avisar N, Shaked I, Vardimon L. Glutamine synthetase protects against neuronal degeneration in injured retinal tissue. Proc Natl Acad Sci USA. 1997;94:7024–7029 [DOI] [PMC free article] [PubMed] [Google Scholar]
- 7. Woldemussie E, Wijono M, Ruiz G. Müller cell response to laser-induced increase in intraocular pressure in rats. Glia. 2004;47:109–119 [DOI] [PubMed] [Google Scholar]
- 8. Shen F, Chen B, Danias J, et al. Glutamate-induced glutamine synthetase expression in retinal Müller cells after short-term ocular hypertension in the rat. Invest Ophthalmol Vis Sci. 2004;45(9):3107–3111 [DOI] [PubMed] [Google Scholar]
- 9. Zhang S, Wang H, Lu Q, et al. Detection of early neuron degeneration and accompanying glial responses in the visual pathway in a rat model of acute intraocular hypertension. Brain Res. 2009;1303:131–143 [DOI] [PubMed] [Google Scholar]
- 10. Moreno MC, Sande P, Marcos HA, et al. Effect of glaucoma on the retinal glutamate/glutamine cycle activity. FASEB J. 2005. 19:1161–1162 [DOI] [PubMed] [Google Scholar]
- 11. Chen C-H, Alyahya K, Gionfriddo JR, Dubielzig RR, Madl JE. Loss of glutamate synthetase immunoreactivity from the retina in canine primary glaucoma. Vet Ophthalmol. 2008;11:150–157 [DOI] [PubMed] [Google Scholar]
- 12. Izumi Y, Benz AM, Kirby CO, et al. An ex vivo rat retinal preparation for excitotoxicity studies. J Neurosci Methods. 1995;60:219–225 [DOI] [PubMed] [Google Scholar]
- 13. Ahmed F, Brown KM, Stephan DA, et al. Microarray analysis of changes in mRNA levels in the rat retina after experimental elevation of intraocular pressure. Invest Ophthalmol Vis Sci. 2004;45:1247–1258 [DOI] [PubMed] [Google Scholar]
- 14. Bringmann A, Pannicke T, Grosche J, et al. Müller cells in the healthy and diseased retina. Prog Retin Eye Res. 2006;25:397–424 [DOI] [PubMed] [Google Scholar]
- 15. Bringmann A, Iandiev I, Pannicke T, et al. Cellular signaling and factors involved in Müller cell gliosis: neuroprotective and detrimental effects. Prog Retin Eye Res. 2009;28:423–451 [DOI] [PubMed] [Google Scholar]
- 16. Kim IB, Kim KY, Joo CK, et al. Reaction of Müller cells after increased intraocular pressure in the rat retina. Exp Brain Res. 1998;121:419–424 [DOI] [PubMed] [Google Scholar]
- 17. Hernandez MR, Agapova OA, Yang P, et al. Differential gene expression inastrocytes from human normal and glaucomatous optic nerve head analyzed by cDNA microarray. Glia. 2002;38:45–64 [DOI] [PubMed] [Google Scholar]
- 18. Wang L, Cioffi GA, Cull G, Dong J, Fortune B. Immunohistologic evidence for retinal glial cell changes in human glaucoma. Invest Ophthalmol Vis Sci. 2002;43:1088–1094 [PubMed] [Google Scholar]
- 19. Lam TT, Kwong JMK, Tso MOM. Early glial responses after acute elevated intraocular pressure in rats. Invest Ophthalmol Vis Sci. 2003;44:638–645 [DOI] [PubMed] [Google Scholar]
- 20. Naskar R, Thanos S. Retinal gene profiling in a hereditary rodent model of elevated intraocular pressure. Mol Vis. 2006;12:1199–1210 [PubMed] [Google Scholar]
- 21. Steele MR, Inman DM, Calkins DJ, Horner PJ, Vetter ML. Microarray analysis of retinal gene expression in the DBA/2J model of glaucoma. Invest Ophthalmol Vis Sci. 2006;47:977–985 [DOI] [PubMed] [Google Scholar]
- 22. Schuman JS, Wollstein G, Farra T, et al. Comparison of optic nerve head measurements obtained by optical coherence tomography and confocal scanning laser ophthalmoscopy. Am J Ophthalmol. 2003;135:504–512 [DOI] [PubMed] [Google Scholar]
- 23. Gawronski JD, Benson DR. Microtiter assay for glutamine synthetase biosynthetic activity using inorganic phosphate detection. Anal Biochem. 2004;327:114–118 [DOI] [PubMed] [Google Scholar]
- 24. Kingdon HS, Hubbard JS, Stadtman ER. Regulation of glutamine synthesis. XI. The nature and implications of a lag phase in the Escherichia coli glutamine synthetase reaction. Biochemstry. 1968;7:2136–2142 [DOI] [PubMed] [Google Scholar]
- 25. Izumi Y, Hammerman SB, Kirby CO, et al. Involvement of glutamate in ischemic neurodegeneration in isolated retina. Vis Neurosci. 2003;20:97–107 [DOI] [PubMed] [Google Scholar]
- 26. Woolfolk CA, Shapiro B, Stadtman ER. Regulation of glutamine synthetase. 1. Purification and properties of glutamine synthetase from Escherichia coli. Arch Biochem Biophys. 1966;116:177–192 [DOI] [PubMed] [Google Scholar]
- 27. Olney JW, Fuller T, de Gubareff T. Acute dendrotoxic changes in the hippocampus of kainate treated rats. Brain Res. 1979;176:91–100 [DOI] [PubMed] [Google Scholar]
- 28. Sloviter RS, Dempster DW. “Epileptic” brain damage is replicated qualitatively in the rat hippocampus by central injection of glutamate or aspartate but not by GABA or acetylcholine. Brain Res Bull. 1985;15:39–60 [DOI] [PubMed] [Google Scholar]
- 29. Dessi F, Charriaut-Marlangue C, Ben-Ari Y. Glutamate-induced neuronal death in cerebellar culture is mediated by two distinct components: a sodium-chloride component and a calcium component. Brain Res. 1994;650:49–55 [DOI] [PubMed] [Google Scholar]
- 30. Peterson C, Neal JH, Cotman CW. Development of N-methyl-D-aspartate excitotoxicity in cultured hippocampal neurons. Brain Res Dev Brain Res. 1989;48:187–195 [DOI] [PubMed] [Google Scholar]
- 31. Friedman JE, Haddad GG. Major Differences in Ca2+i response to anoxia between neonatal and adult rat CA1 neurons: role of Ca2+0 and Na+0. J Neurosci. 1993;13:63–72 [DOI] [PMC free article] [PubMed] [Google Scholar]
- 32. Rothman SM. The neurotoxicity of excitatory amino acids is produced by passive chloride influx. J Neurosci. 1985;5:1483–1489 [DOI] [PMC free article] [PubMed] [Google Scholar]
- 33. Krisnamoorthy RR, Agarwal P, Prasanna G, et al. Characterization of a transformed rat retinal ganglion cell line. Mol Brain Res. 2001;86:1–12 [DOI] [PubMed] [Google Scholar]
- 34. Clements JD, Lester RA, Tong G, Jahr CE, Westbrook GL. The time corse of glutamate in the synaptic cleft. Science. 1992;258:1498–1501 [DOI] [PubMed] [Google Scholar]
- 35. Rosenberg PA, Amin S, Letner M. Glutamate uptake disguises neurotoxic potency of glutamate agonists in cerebral cortex in dissociated cell culture. J Neurosci. 1992;12:56–61 [DOI] [PMC free article] [PubMed] [Google Scholar]
- 36. Rauen T, Taylor WR, Kuhlbrodt K, Wiessner M. High-affinity glutamate transporters in the rat retina: a major role of the glial glutamate transporter GLAST-1 in transmitter clearance. Cell Tissue Res. 1998;291:19–31 [DOI] [PubMed] [Google Scholar]
- 37. Izumi Y, Matsukawa M, Benz AM, et al. Role of ammonia in reversal of glutamate-mediated Müller cell swelling in the rat retina. Glia. 2004;48:44–50 [DOI] [PubMed] [Google Scholar]


