The reproducibility of mouse retinal thickness measurements, obtained with volumetric spectral-domain optical coherence tomography (SD-OCT) was evaluated. Good reproducibility may make SD-OCT valuable for further studies in mice.
Abstract
Purpose.
To test the reproducibility of spectral-domain optical coherence tomography (SD-OCT) total retinal thickness (TRT) measurements in mice.
Methods.
C57Bl/6 mice were anesthetized, and three repeated volumetric images were acquired in both eyes with SD-OCT (250 A-scans × 250 frames × 1024 samplings), centered on the optic nerve head (ONH). The mice were repositioned between scans. TRT was automatically measured within a sampling band of retinal thickness with radii of 55 to 70 pixels, centered on the ONH by using custom segmentation software. The first volumetric image acquired in a given eye was used to register the remaining two SD-OCT images by manually aligning the en face images with respect to rotation and linear translation. Linear mixed-effects models were fitted to global and quadrant thicknesses, taking into account the clustering between eyes, to assess imprecision (measurement reproducibility).
Results.
Twenty-six eyes of 13 adult mice (age 13 weeks) were imaged. The mean global TRT across all eyes was 298.21 μm, with a mouse heterogeneity standard deviation (SD) of 4.88 μm (coefficient of variation [CV] = 0.016), an eye SD of 3.32 μm (CV = 0.011), and a device-related imprecision SD of 2.33 μm (CV = 0.008). The superior quadrant had the thickest mean TRT measurement (310.38 μm) and the highest (worst) imprecision SD (3.13 μm; CV = 0.010), and the inferior quadrant had the thinnest mean TRT (291.55 μm). The quadrant with the lowest (best) imprecision SD was in the nasal one (2.06 μm; CV = 0.007).
Conclusions.
Good reproducibility was observed for SD-OCT retinal thickness measurements in mice. SD-OCT may be useful for in vivo longitudinal studies in mice.
Optical coherence tomography (OCT) permits rapid, noninvasive, in vivo quantification of retinal structures. In humans, retinal thickness and retinal nerve fiber layer thickness measurements obtained with OCT have been shown to be reproducible,1–10 and this has made OCT valuable for cross-sectional and longitudinal studies.11–13
In mice, time-domain OCT has been used to obtain cross-sectional images of the retina in vivo.14–16 Spectral-domain (SD)-OCT, which has faster scanning rates and higher axial resolution, allows the acquisition of detailed three-dimensional (3-D) volumetric scans in mice.17–25 Although SD-OCT acquires volumetric information in mice, thickness measurements obtained post hoc were often based on single cross sections.19,23
In considering the use of SD-OCT for the longitudinal follow-up of mouse models of retinal diseases, however, a consistent method for acquiring 3-D data must be developed. The goal of this study was to evaluate the reproducibility of a SD-OCT method of measuring total retinal thickness (TRT) in mice.
Methods
This experiment was approved by the University of Pittsburgh's Institutional Animal Care and Use Committee and adhered to the ARVO Statement for the Use of Animals in Ophthalmic and Vision Research.
Animals
Healthy adult male C57Bl/6 mice (Jackson Laboratory, Bar Harbor, ME) were used in the study. The mice were maintained in the University of Pittsburgh Animal Facility in a 12-hour light/dark cycle and had free access to water and standard laboratory feed.
SD-OCT Imaging
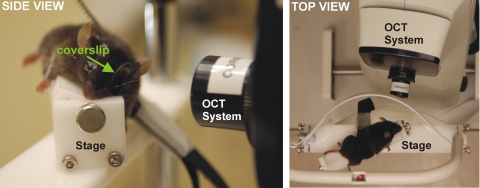
The mice were anesthetized with an intraperitoneal injection of ketamine (80 mg/kg; Ketaject; Phoenix Pharmaceuticals, St. Joseph, MO) and xylazine (5 mg/kg; Xyla-ject; Phoenix Pharmaceuticals), to prevent large movements during SD-OCT image acquisition. Both pupils were dilated with a topically applied drop of tropicamide (1%; Falcon Pharmaceuticals, Fort Worth, TX). To neutralize corneal optical power and focus the SD-OCT beam onto the retina, we applied a thin glass coverslip to the cornea and used hydroxymethylcellulose ophthalmic demulcent solution (Goniosol 2.5%; Akorn, Buffalo Grove, IL) to preserve corneal hydration and couple the coverslip to the cornea. The mice were secured on a custom stage (Fig. 1), which allowed free rotation, to align the eye for imaging of the optic nerve head (ONH).
Figure 1.
Side (left) and top (right) views of the stage used for alignment of the mouse for SD-OCT imaging of the ONH. A coverslip was used to account for the steep curvature of the mouse cornea.
Three repeated volumetric images, centered on the ONH, were acquired in both eyes with SD-OCT (Bioptigen, Inc., Durham, NC). All SD-OCT images consisted of 250 averaged A-scans (each A-scan was an average of four A-scans), 250 frames, and 1024 samplings in depth. These parameters correspond to a volume of approximately 1.5 × 1.5 × 2.0 mm at the surface of the coverslip. The mice were repositioned between scans by rotating the stage (when switching between left and right eyes) or removing the mouse from the stage for complete repositioning (when returning to same eye). Care was taken to ensure that all three scans were acquired before the mice developed reversible cataract. Images were acquired within 20 minutes after anesthesia was administered.
SD-OCT Image Analysis: Manual Alignment
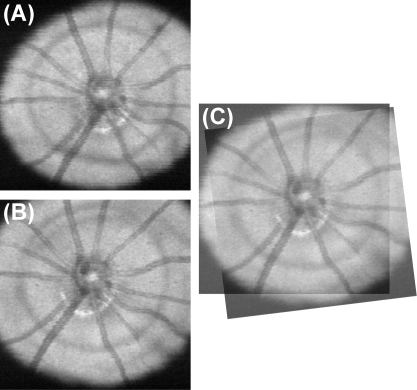
Repositioning the mouse between scans resulted in variability in the location and orientation of the ONH. We manually aligned the SD-OCT en face images after acquisition (Fig. 2) to compensate for the variability in orientation. The first SD-OCT en face image acquired in a given eye was used as an alignment reference for subsequent images, and the coordinates of rotation and translation for each scan relative to the reference were used to align the thickness measurements.
Figure 2.
Manual alignment of two SD-OCT en face images. (A) Reference SD-OCT en face image and (B) subsequent SD-OCT en face image. (C) Scan registered to the reference.
SD-OCT Image Analysis: Automated Segmentation
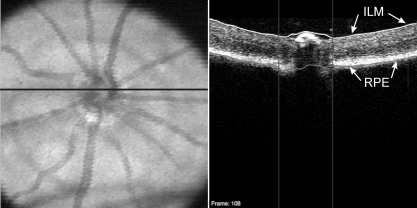
The ONH margin for each eye was manually located by one experienced operator (MG) on each OCT en face image. The geometric center of the ONH margin was then used as a center point for subsequent analysis. TRT was automatically measured within a sampling band of retinal thickness with an inner radius of 55 pixels and an outer radius of 70 pixels, centered on the ONH, by using custom segmentation software to detect the internal limiting membrane and retinal pigment epithelium (Fig. 3).26 This sampling band was chosen to avoid regions within the optic nerve and areas of vignetting, as automated segmentation tends to be less reliable in those regions. After the sampling band thickness information was obtained, the scans were rotated and translated on the basis of the coordinates obtained from manual image alignment. These aligned thickness measurements were used to assess reproducibility. It should be noted that alignment was completely independent of thickness measurements.
Figure 3.
SD-OCT en face image (left) with the black line indicating the location of the OCT B-scan (right). The B-scan demonstrates automated segmentation of the ILM (white line) and RPE (gray line) to obtain measurements. Vertical lines: disc margin.
SD-OCT Image Analysis: Quality Criteria
SD-OCT en face images were checked to ensure that there was consistent image quality across the scan and that there were no areas of shadowing from media opacities within the TRT sampling band, as it could affect thickness measurements. The eyes were excluded if the TRT segmentation algorithm failed at any location inside the sampling band. Algorithm failure was defined as a clear disruption of the border, either the inner limiting membrane (ILM) or RPE, for more than five consecutive A-scans within the sampling band. If any one of the three scans per eye had to be excluded, both eyes of the mouse were excluded from the analysis.
Statistical Analysis
Linear mixed-effects models were fitted to global and quadrant TRTs, taking into account the clustering between eyes, to assess measurement reproducibility. Imprecision (as measured by the residual standard deviation [SD]), and corresponding 95% confidence intervals were computed. All analysis was conducted with R Language and Environment for Statistical Computing program (http://www.R-project. org).27 An α level of 0.05 was used as the cutoff for statistical significance.
The mixed-effects model for TRT (yijk) for mouse i, eye k nested within mouse i, and replicate k is:
where α represents the cohort mean TRT, ai is the random intercept for mouse i, assumed to be normally distributed with a mean of 0 and SD σm [ai ∼ N(0,σm2)]; bij is a random intercept for eye j nested within mouse i [bij ∼ N(0,σe2)]; and εijk is a normally distributed random error [εijk ∼ N(0,σ2)]. The standard deviations σm and σe represent the variability of the thickness measurements coming from the cohort of mice (heterogeneity across mice and eye, respectively), whereas the error SD represents the imprecision coming from the device. This device-related imprecision includes errors coming from segmentation algorithm performance as well as manual alignment of SD-OCT en face images.
Results
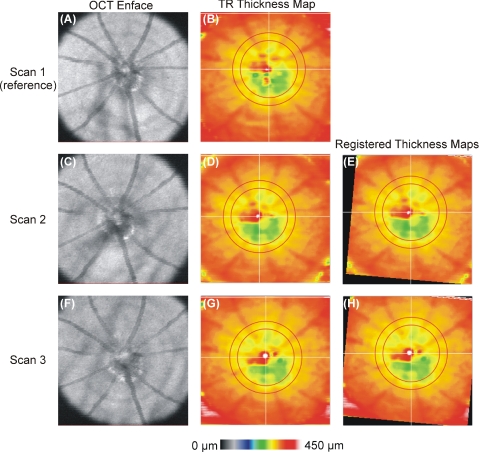
Thirty eyes of 15 healthy adult male mice, age 13 weeks, were imaged. Two eyes were excluded due to segmentation algorithm failure: one at the level of the RPE and one at the ILM. The contralateral eyes of those two mice were also excluded. In total, 26 eyes of 13 healthy adult male mice were included. Figure 4 shows an example of the alignment of TRT maps relative to reference.
Figure 4.
maps aligned to a single reference scan. (A, C, F) OCT en face images; (B, D, G) TRT thickness map with sampling region indicated as the region between red concentric circles. (E, H) TRT maps registered to the reference.
Mean global TRT across all eyes was 298.21 μm (Table 1), with a mouse heterogeneity SD of 4.88 μm (CV = 0.016) and an eye SD of 3.32 μm (CV = 0.011). The device-related global imprecision SD was 2.33 μm (CV = 0.008). The superior quadrant showed the thickest TRT measurements (310.38 μm, mouse heterogeneity SD, 6.09 μm [CV = 0.020], eye SD 6.98 μm [CV = 0.022]), whereas the inferior quadrant was the thinnest (291.55 μm, mouse heterogeneity SD, 6.02 μm [CV = 0.021], eye heterogeneity SD, 8.13 μm [CV = 0.028]). The highest (worst) quadrant imprecision SD was in the superior quadrant (3.13 μm; CV = 0.010) and the lowest (best) was in the nasal quadrant (2.06 μm; CV = 0.007).
Table 1.
Estimates of Mixed-Effect Model Parameters and CV for Global and Sectoral TRT
| Sector | Estimated Mean (α) | Estimated SD |
Imprecision SD |
||||
|---|---|---|---|---|---|---|---|
| Mouse |
Eye |
||||||
| σm | CV | σe | CV | SD* (σ) | CV | ||
| Global | 298.21 | 4.88 | 0.016 | 3.32 | 0.011 | 2.33 | 0.008 |
| Temporal | 294.37 | 6.17 | 0.021 | 4.80 | 0.016 | 3.05 | 0.010 |
| Superior | 310.38 | 6.09 | 0.020 | 6.98 | 0.022 | 3.13 | 0.010 |
| Nasal | 296.52 | 4.61 | 0.016 | 6.08 | 0.021 | 2.06 | 0.007 |
| Inferior | 291.55 | 6.02 | 0.021 | 8.13 | 0.028 | 3.09 | 0.011 |
All estimates are in micrometers except for CV, which is unitless.
Device reproducibility measurement.
Discussion
In this study, we were able to demonstrate good intrasession reproducibility of SD-OCT TRT measurements in mice that were obtained with automated retinal segmentation software. This study lays the foundation for future work monitoring retinal changes in mice over time. The global imprecision estimates were 2.33 μm. Hence, a TRT difference between two observations from the same eye of the same mouse of at least 6.46 μm (2.33 μm · 1.96 · √2; 2.17% of the mean TRT; 3.31 pixels) would be necessary to conclude, with 95% confidence, that the difference was due to an actual structural change as opposed to variability inherent in the device.
Although the superior quadrant showed the worst quadrant imprecision SD (3.13 μm), the superior CV (0.010) was actually slightly better than that of the inferior quadrant (CV = 0.011). This discrepancy is attributable to the differences in thickness within those quadrants: the superior quadrant had the thickest mean measurements, whereas the mean inferior quadrant measurements were the thinnest (310.38 μm vs. 291.55 μm respectively). Overall, the CV was similar for the superior, inferior, and temporal quadrants, but was lower in the nasal quadrant (CV = 0.007).
Our study was designed to evaluate intrasession reproducibility, as the mice were only anesthetized once and repeatedly scanned in one session. In multiple studies of OCT imaging, this source of variability was observed to be the main one.28,29 Intersession variability has been shown to add minimal variability and was therefore not the focus of this study.28
Our TRT measurements are thicker than those reported by Horio et al.14 They reported only temporal retinal thickness from a single A-scan at a distance of 1 to 2 disc diameters from the temporal margin of the optic disc. This distance was farther from the disc center than we measured and therefore can be expected to show a lesser retinal thickness. In addition, since their measurement was based on a single A-scan, there may have been wide variability in their measurements. They also used a lower resolution OCT system as well as a different strain (BALB/c) of older (16 weeks) mice, all of which may explain the observed deviation. Li et al.15 showed retinal thickness measurements of 200 to 250 μm in C57Bl/6 mice. Their measurements were based on single cross sections, and they used a lower resolution OCT system. Ruggeri et al.18 measured retinal thickness with SD-OCT and reported an average thickness of 202 μm. This average was based on all points outside of a 0.5-mm-diameter region covering the ONH, whereas our sampling location was within a band with a diameter of 55 to 70 pixels. We chose this sampling region to ensure that we were sampling outside the ONH region and not extending into a region where there could be vignetting of the image from the pupil. Compared to our sampling region, their average included thinner regions of the retina, which may explain the difference in global measurements. In addition, differences in measurements due to different devices with different segmentation algorithms may partially explain this discrepancy. These dissimilarities may also explain the slight differences in our measurements compared with those reported by Kim et al.,19 Huber et al.,23 Fischer et al.,24 and Cebulla et al.25
Our observation of slightly thinner TRT measurements inferiorly was unexpected. One reason for this finding may be that the orientation of the eye during scanning is not the true orientation of the mouse, since the mouse was rotated on a stage during acquisition, to allow for focusing on the ONH. The rotation may have led to variability of the exact quadrant boundary locations across eyes. This limitation is inherent in our method of obtaining images centered on the ONH by rotating the mouse on a stage.
Another limitation is that manual labeling of the optic disc margin is necessary to obtain the geometric center of the disc. It is possible, however, that automated detection of the ONH (and ONH center) may be available in the future, similar that currently used for detection in human eyes.30 In addition, we used manual registration of en face images to account for rotational and translational eye position differences from scan to scan. This process accounts for shifts that occurred between scans, because our stage allowed for rotation and translation of the eye to center the image on the ONH, and accounts for x- and y-scan location differences. A stage that would allow for more consistent alignment of mice between scans may eliminate this step. It may also be possible to use automated registration based on blood vessel segmentation in en face images to replace the manual component of the analysis. Future studies investigating this possibility are necessary.
We have shown that SD-OCT allows reproducible 3D scanning of tissue structure in vivo that is minimally invasive. As a result, SD-OCT has the potential to reduce the number of mice needed in studies of diseases that affect retinal structure by allowing the same mice to be consistently observed from session to session. Therefore, longitudinal studies monitoring one population of mice are possible, as opposed to the current approach of cross-sectional analysis with a subset of mice at multiple time points. This method should allow researchers to better observe the structural manifestations of disease over time.
Footnotes
Presented in part at the 2010 annual meeting of the International Society for Imaging in the Eye, Fort Lauderdale, Florida, May 2010.
Supported in part by National Institutes of Health Grants T32-EY017271, R21-EY019092, R01-EY013178, and P30-EY008098 (Bethesda, MD); the Eye and Ear Foundation (Pittsburgh, PA); and Research to Prevent Blindness (New York, NY).
Disclosure: M.L. Gabriele, None; H. Ishikawa, P; J.S. Schuman, P; R.A. Bilonick, None; J. Kim, None; L. Kagemann, None; G. Wollstein, Carl Zeiss Meditec, Optovue (F), P.
References
- 1. Baumann M, Gentile RC, Liebmann JM, Ritch R. Reproducibility of retinal thickness measurements in normal eyes using optical coherence tomography. Ophthalmic Surg Lasers. 1998;29:280–285 [PubMed] [Google Scholar]
- 2. Blumenthal EZ, Williams JM, Weinreb RN, Girkin CA, Berry CC, Zangwill LM. Reproducibility of nerve fiber layer thickness measurements by use of optical coherence tomography. Ophthalmology. 2000;107:2278–2282 [DOI] [PubMed] [Google Scholar]
- 3. Massin P, Vicaut E, Haouchine B, Erginay A, Paques M, Gaudric A. Reproducibility of retinal mapping using optical coherence tomography. Arch Ophthalmol. 2001;119:1135–1142 [DOI] [PubMed] [Google Scholar]
- 4. Paunescu LA, Schuman JS, Price LL, et al. Reproducibility of nerve fiber thickness, macular thickness, and optic nerve head measurements using StratusOCT. Invest Ophthalmol Vis Sci. 2004;45:1716–1724 [DOI] [PMC free article] [PubMed] [Google Scholar]
- 5. Gurses-Ozden R, Teng C, Vessani R, Zafar S, Liebmann JM, Ritch R. Macular and retinal nerve fiber layer thickness measurement reproducibility using optical coherence tomography (OCT-3). J Glaucoma. 2004;13:238–244 [DOI] [PubMed] [Google Scholar]
- 6. Budenz DL, Chang RT, Huang X, Knighton RW, Tielsch JM. Reproducibility of retinal nerve fiber thickness measurements using the stratus OCT in normal and glaucomatous eyes. Invest Ophthalmol Vis Sci. 2005;46:2440–2443 [DOI] [PubMed] [Google Scholar]
- 7. Kim JS, Ishikawa H, Sung KR, et al. Retinal nerve fibre layer thickness measurement reproducibility improved with spectral domain optical coherence tomography. Br J Ophthalmol. 2009;93:1057–1063 [DOI] [PMC free article] [PubMed] [Google Scholar]
- 8. Gonzalez-Garcia AO, Vizzeri G, Bowd C, Medeiros FA, Zangwill LM, Weinreb RN. Reproducibility of RTVue retinal nerve fiber layer thickness and optic disc measurements and agreement with Stratus optical coherence tomography measurements. Am J Ophthalmol. 2009;147:1067–1074, 1074, e1061 [DOI] [PMC free article] [PubMed] [Google Scholar]
- 9. Kiernan DF, Hariprasad SM, Chin EK, Kiernan CL, Rago J, Mieler WF. Prospective comparison of cirrus and stratus optical coherence tomography for quantifying retinal thickness. Am J Ophthalmol. 2009;147:267–275 e262 [DOI] [PubMed] [Google Scholar]
- 10. Kiernan DF, Mieler WF, Hariprasad SM. Spectral-domain optical coherence tomography: a comparison of modern high-resolution retinal imaging systems. Am J Ophthalmol. 2010;149:18–31 [DOI] [PubMed] [Google Scholar]
- 11. Wollstein G, Schuman JS, Price LL, et al. Optical coherence tomography longitudinal evaluation of retinal nerve fiber layer thickness in glaucoma. Arch Ophthalmol. 2005;123:464–470 [DOI] [PMC free article] [PubMed] [Google Scholar]
- 12. Leung CK, Cheung CY, Lin D, Pang CP, Lam DS, Weinreb RN. Longitudinal variability of optic disc and retinal nerve fiber layer measurements. Invest Ophthalmol Vis Sci. 2008;49:4886–4892 [DOI] [PubMed] [Google Scholar]
- 13. Lalezary M, Medeiros FA, Weinreb RN, et al. Baseline optical coherence tomography predicts the development of glaucomatous change in glaucoma suspects. Am J Ophthalmol. 2006;142:576–582 [DOI] [PubMed] [Google Scholar]
- 14. Horio N, Kachi S, Hori K, et al. Progressive change of optical coherence tomography scans in retinal degeneration slow mice. Arch Ophthalmol. 2001;119:1329–1332 [DOI] [PubMed] [Google Scholar]
- 15. Li Q, Timmers AM, Hunter K, et al. Noninvasive imaging by optical coherence tomography to monitor retinal degeneration in the mouse. Invest Ophthalmol Vis Sci. 2001;42:2981–2989 [PubMed] [Google Scholar]
- 16. Kocaoglu OP, Uhlhorn SR, Hernandez E, et al. Simultaneous fundus imaging and optical coherence tomography of the mouse retina. Invest Ophthalmol Vis Sci. 2007;48:1283–1289 [DOI] [PubMed] [Google Scholar]
- 17. Srinivasan VJ, Ko TH, Wojtkowski M, et al. Noninvasive volumetric imaging and morphometry of the rodent retina with high-speed, ultrahigh-resolution optical coherence tomography. Invest Ophthalmol Vis Sci. 2006;47:5522–5528 [DOI] [PMC free article] [PubMed] [Google Scholar]
- 18. Ruggeri M, Wehbe H, Jiao S, et al. In vivo three-dimensional high-resolution imaging of rodent retina with spectral-domain optical coherence tomography. Invest Ophthalmol Vis Sci. 2007;48:1808–1814 [DOI] [PubMed] [Google Scholar]
- 19. Kim KH, Puoris'haag M, Maguluri GN, et al. Monitoring mouse retinal degeneration with high-resolution spectral-domain optical coherence tomography. J Vis. 2008;8:17 11–11 [DOI] [PubMed] [Google Scholar]
- 20. Fingler J, Readhead C, Schwartz DM, Fraser SE. Phase-contrast OCT imaging of transverse flows in the mouse retina and choroid. Invest Ophthalmol Vis Sci. 2008;49:5055–5059 [DOI] [PubMed] [Google Scholar]
- 21. Xu J, Molday LL, Molday RS, Sarunic MV. In vivo imaging of the mouse model of X-linked juvenile retinoschisis with Fourier domain optical coherence tomography. Invest Ophthalmol Vis Sci. 2009;50:2989–2993 [DOI] [PMC free article] [PubMed] [Google Scholar]
- 22. Ruggeri M, Tsechpenakis G, Jiao S, et al. Retinal tumor imaging and volume quantification in mouse model using spectral-domain optical coherence tomography. Opt Express. 2009;17:4074–4083 [DOI] [PMC free article] [PubMed] [Google Scholar]
- 23. Huber G, Beck SC, Grimm C, et al. Spectral domain optical coherence tomography in mouse models of retinal degeneration. Invest Ophthalmol Vis Sci. 2009;50:5888–5895 [DOI] [PMC free article] [PubMed] [Google Scholar]
- 24. Fischer MD, Huber G, Beck SC, et al. Noninvasive, in vivo assessment of mouse retinal structure using optical coherence tomography. PLoS One. 2009;4:e7507. [DOI] [PMC free article] [PubMed] [Google Scholar]
- 25. Cebulla CM, Ruggeri M, Murray TG, Feuer WJ, Hernandez E. Spectral domain optical coherence tomography in a murine retinal detachment model. Exp Eye Res. 2010;90:521–527 [DOI] [PMC free article] [PubMed] [Google Scholar]
- 26. Ishikawa H, Stein DM, Wollstein G, Beaton S, Fujimoto JG, Schuman JS. Macular segmentation with optical coherence tomography. Invest Ophthalmol Vis Sci. 2005;46:2012–2017 [DOI] [PMC free article] [PubMed] [Google Scholar]
- 27. R Development Core Team R: A Language and Environment for Statistical Computing. Available at: http://wwwR-projectorg Accessed February 1, 2010
- 28. Kagemann L, Mumcuoglu T, Wollstein G, et al. Sources of longitudinal variability in optical coherence tomography nerve-fibre layer measurements. Br J Ophthalmol. 2008;92:806–809 [DOI] [PMC free article] [PubMed] [Google Scholar]
- 29. Carpineto P, Ciancaglini M, Zuppardi E, Falconio G, Doronzo E, Mastropasqua L. Reliability of nerve fiber layer thickness measurements using optical coherence tomography in normal and glaucomatous eyes. Ophthalmology. 2003;110:190–195 [DOI] [PubMed] [Google Scholar]
- 30. Xu J, Ishikawa H, Wollstein G, et al. Automated assessment of the optic nerve head on stereo disc photographs. Invest Ophthalmol Vis Sci. 2008;49:2512–2517 [DOI] [PMC free article] [PubMed] [Google Scholar]


