

Abstract
An intrinsic uncertainty in particle mass sensing with the suspended microchannel resonator results from variation in a particle's position near the free end of the resonator. To circumvent this error we employ the second flexural bending mode. This mode exhibits additional frequency peaks while particles pass over the antinode, a point where the frequency shift is insensitive to the lateral position of the particle. We measure polystyrene beads with the first and second modes and confirm that the second mode sensing provides a narrower mass histogram. For 3 μm diameter beads, second mode sensing at the antinode improves the coefficient of variation in buoyant mass from 1.76% to 1.05% for population measurements and from 1.40% to 0.53% for a single trapped particle.
INTRODUCTION
Recent development of the suspended microchannel resonator (SMR) has enabled novel label-free biological sensing applications with unprecedented mass resolution (∼1 fg in a 1 Hz bandwidth).1 The SMR is a microfluidic device that improves mass resolution by putting liquid samples inside a vacuum-packaged resonator. When a particle flows through the resonator's microchannel, the resonance frequency shift is position-dependent, with the maximum frequency shift occurring when the particle is at the SMR tip. Since the microchannel width is designed to accommodate a range of particle sizes and reduce clogging, the particle flow path near the tip of the SMR is uncertain [Fig. 1a] and reduces the precision of the mass measurement. This position-dependent error can broaden the measured mass histogram of a population of particles and introduce additional uncertainty during single particle trapping.2 This error was briefly addressed in our previous work,1 but there has been little effort to quantify the position-dependent error experimentally and explore methods that reduce this error. In this paper, we quantify position-dependent error inherent in particle mass sensing with the SMR and show that by utilizing higher order flexural bending modes the position-dependent error can be eliminated in existing SMR structures without sacrificing throughput.
Figure 1.

(a) A particle in the SMR may transit anywhere between the inner and outer channel wall. A particle that makes a U-turn near the inner wall (dashed green line) causes a smaller frequency shift than if it turns near the outer wall (solid red line). For the second flexural bending mode, there are three peaks in the frequency shift measured during a single particle transit (one at the free end and two at the antinode). Letters “L” and “R” indicate left and right hand side of the microchannel in which the corresponding antinode peaks occur. (b) Mode shapes and resonance frequency shifts of the first and second flexural bending modes upon point mass loading on a cantilever as a function of the position of the added mass normalized by the cantilever length.
THEORY
When a point mass is deposited on a vibrating cantilever, the resulting change in resonance frequency depends strongly on the location of the added mass.3, 4 From the Euler–Bernoulli beam equation, displacement at a position normalized by the cantilever length is given by
| (1) |
where x is the position from the clamped base, l is the cantilever length, An is the tip oscillation amplitude, and λn is the eigenvalue for the nth flexural bending modes; 1.8751 and 4.6941 are eigenvalues for the first and second bending modes, respectively.5 By applying Eq. 1 to the Rayleigh–Ritz theorem, which equates the time averaged kinetic energy and strain energy at resonance, the relative resonance frequency shift of a cantilever with added mass Δm is estimated by
| (2) |
where An = 1 (normalized mode shape), f is the resonance frequency, and meff is the effective mass of the unloaded cantilever.6 Figure 1b shows the mode shapes and relative resonance frequency shifts for the first and second flexural bending modes when a mass is added at various positions along the cantilever. Both flexural bending modes exhibit a global maximum frequency shift at the tip. The second mode exhibits an antinode which corresponds to local maximum displacements and generates local maximum frequency shifts when a minuscule mass is added on the cantilever.
As shown in Fig. 1a, a particle flowing through the embedded microchannel of the SMR can travel along random paths. In the most extreme case, the particle can be positioned at the inner or outer edge of the microchannel. Since Δm∕meff in Eq. 2 is much less than unity, the maximum position-dependent error is estimated by
| (3) |
where the subscripts i, o, and m denote the particle positions at the inner edge, the outer edge, and the midpoint of the channel, respectively. This error in first-mode tip sensing is ∼11% for a 210 μm (devices #1 and 2) and ∼5.4% for a 406 μm (devices #4 and 5) long SMR. In second-mode sensing this error is irrelevant because the frequency shifts measured at the antinode are nearly insensitive to the lateral position of the particle in the channel [Fig. 1a]. Therefore, mass sensing at the antinode is mostly limited by the system frequency resolution. Whereas the system noise level is an absolute uncertainty and determines the minimum detectable mass, the position error determines the resolution at which particles having similar buoyant masses can be differentiated. This error is proportional to particle buoyant mass and inversely related to particle size. Thus, depending on the particle's properties, the uncertainty may not be negligible compared to the system frequency resolution.
EXPERIMENTAL
To date, only the fundamental mode of the SMR has been utilized and higher vibration modes have yet to be explored in order to address position-dependent error and discover other potential improvements. For solid conventional microcantilevers it has been shown that performance in a viscous medium improves by operating at higher modes because quality factors increase.7 However, this is not always the case for SMRs because the mechanisms that give rise to viscous loss are different.8 The quality factors of the second mode are significantly lower than those of the first mode when the SMRs are filled with water (Fig. 2 and Table 1). Figure 2 also shows that the second mode signal to background ratio (SBR) is lower than that of the first mode and is significantly reduced (or curve offset is noticeably increased) when the second mode resonance frequency is well above 1 MHz. For example, the SBR for the second mode of the type 2 device (f2 ∼ 2.3 MHz) is only ∼4 dB, which is two orders of magnitude lower than that for the first mode (∼150 dB). As a consequence, type 2 device could not be operated in feedback in the second mode. The reduced quality factor and SBR result in a lower mass resolution, and thus there is a trade-off between mass resolution and precision that should be considered in every application of higher mode sensing. In the current system, if the second mode resonance frequency is below 1 MHz, then the device should be operated in second mode; otherwise, the reduced second mode mass resolution makes first mode preferable.
Figure 2.

Normalized amplitude vs normalized frequency near the first and second bending modes for each SMR-type filled with water. For comparison, cantilever microchannel cross-section and resonance frequencies for the first and second mode are specified for each device. If the normalized frequency response exhibits a high offset (low signal to background ratio), then it is more difficult to drive the sensor in closed loop. For second mode operation, Devices 2 and 3 have a high offset and it was not possible to use closed loop operation.
Table 1.
Dimensions [length (l), width (w), thickness (t), channel width (wc), channel height (hc), and dimensions related to wall thicknesses (a) and (b)] and resonant characteristics of five SMRs. Resonance frequency (f), quality factor (Q), and minimum detectable mass (δm) are measured with each SMR filled with water. Type 2 and 3 devices cannot be operated in feedback with the second mode.
| Device type |
||||||
|---|---|---|---|---|---|---|
| Dimensions andcharacteristics | 1 | 2 | 3 | 4 | 5a | |
| l (μm) | 210 | 210 | 321 | 406 | 406 | 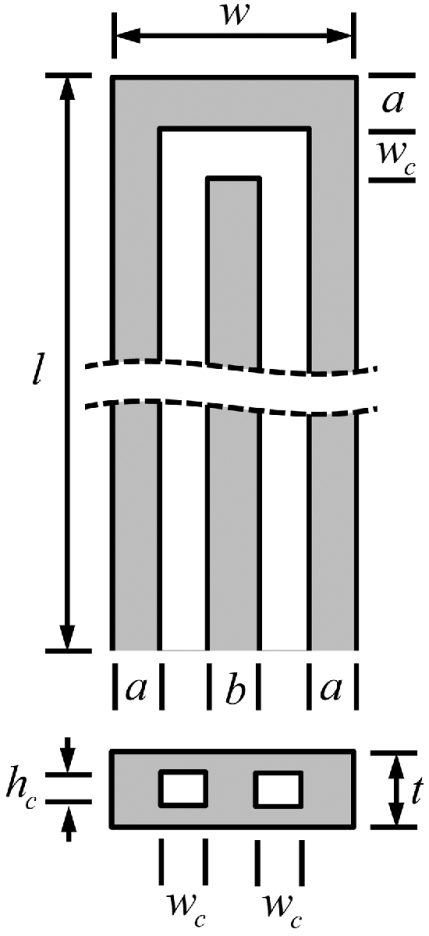 |
| w (μm) | 33 | 33 | 57 | 28.5 | 28.5 | |
| t (μm) | 7 | 12 | 19 | 7 | 12 | |
| wc (μm) | 8 | 8 | 20 | 7.9 | 7.9 | |
| hc (μm) | 3 | 8 | 15 | 3 | 8 | |
| a (μm) | 6 | 6 | 6 | 3.9 | 3.9 | |
| b (μm) | 5 | 5 | 5 | 4.9 | 4.9 | |
| f1 (kHz) | 209.9 | 384 | 231 | 54.7 | 93.2 | |
| Q1 | 12,064 | 5,880 | 2,270 | 23,447 | 10,742 | |
| f2 (kHz) | 1297.5 | 2311 | 1396 | 340.2 | 578.7 | |
| Q2 | 4,798 | 1,760 | 810 | 9,080 | 3,023 | |
| δm1,1 kHz (fg) | 10.2 | 14.1 | 113.7 | 90.8 | 48 | |
| δm2a,1 kHz (fg) | 37.7 | … | … | 30.5 | 35 | |
Mainly used throughout this work unless otherwise mentioned.
We operated the SMR in feedback in the first and second modes and found that feedback was not stable for higher order modes. This may be due to the increased stiffness as the mode number rises.9 To select a vibration mode for feedback operation, the optical lever needs to be realigned and the phase in the feedback circuit is adjusted accordingly. A bandpass filter inserted between the photodetector and feedback circuitry helps to reduce noise originating from other modes. In a 1 kHz bandwidth, frequency noises were 0.439 and 0.142 ppm for the first and second modes, respectively. While SMRs used in this work exhibit lower frequency noise in the second mode than in the first mode, this is not a universal characteristic. Three out of five SMR designs allow feedback operation in both the first and second modes, but only two out of the three designs exhibit better mass resolution in the second mode operation compared with the first mode (Table 1). This indicates that there are preferable designs for higher mode operations and the structures used in this work may not be optimal.
Perfectly monodispersed particles would be ideal for evaluating the performance of second mode sensing because particle size dispersity may overshadow position-dependent error in population measurements. Typical coefficients of variations (CVs) of commercially available NIST size standard beads are 1%–2% in diameter, which are comparable to the position-dependent error. We therefore used a dynamic single particle trapping method where we alternated the pressure between the SMR bypass channels to maintain a single particle in the suspended microchannel for repeated measurements.2 Figure 3 shows resonance frequency shifts of the first and second modes as a nominally 4.17 μm diameter polystyrene bead (Bangs Laboratories) repeatedly transits the suspended microchannel. First mode sensing (f1) exhibits one peak near the tip. In second mode sensing (f2) two side peaks occur at the antinode in the left or right channel and a greater center peak occurs when the particle is near the tip. Mass CVs measured by single particle trapping are 0.49% for first mode tip sensing (f1,t) and 0.27% for second mode antinode sensing (f2,a) (∼45% improvement with f2,a). The improvement in antinode sensing is mostly attributed to the effective elimination of position-dependent error. For a fixed channel dimension, further improvement with f2,a relative to f1,t will be observed when the cantilever is shortened and a smaller particle is measured. For example, when a single 1.9 μm diameter polystyrene bead (Bangs Laboratories) is dynamically trapped in a device only 210 μm long (device #1), measured CVs are 2.57% and 0.89% for f1,t and f2,a, respectively (∼65% improvement with f2,a).
Figure 3.

Frequency shift vs time for a nominally 4.17 μm diameter polystyrene bead that is repeatedly measured. Gray unfilled circles show raw data sampled at 2 kHz, and black (first mode) and red (second mode) solid lines show data smoothed with the Savitzky–Golay filter (n = 12, third order).
We next measured populations of 3, 4, and 5 μm diameter polystyrene beads (Thermo Scientific) and trapped single particles drawn from the same populations to measure the advantage of second mode sensing for monodisperse samples. Figure 4 shows histograms of the relative frequency shift for f1,t, f2,t, and f2,a with 3 μm diameter beads. For both population and trapping measurements, the second mode antinode sensing measurement with the left and right antinode peaks averaged offers the lowest CV (f2,a(avg)). During single particle trapping, tip-sensing distributions are wider than theoretical position error because of system noise and the smoothing filter's effect on different peak shapes. Contribution of the smoothing filter's effect is more pronounced in tip sensing than in antinode sensing because of the sharper peak shape at the tip. Relative systematic uncertainty may be reduced with a higher signal-to-noise ratio (SNR) and is directly observed in the antinode-sensing measurement, which is free of position-dependent error. Although the CV improves for larger particles because of decreased position-dependent error, the dominant parameter is the SNR, which improves the CV for all modes of measurement (Table 2). Improved SNR with the second mode may help to generate the narrower histogram in f2,t as compared to f1,t for both population and single particle trapping by minimizing additional uncertainty during data processing and particles may experience some vibration mediated focusing that is not present in the first mode. Nevertheless, CVs obtained with any SMR sensing mode are better than manufacturer's specifications (Table 2).10 The SMR's minimum detectable monodispersity in diameter ranges from 0.18% to 0.05% with second mode antinode sensing.
Figure 4.

Histograms of relative resonance frequency shifts (Δf∕Δfavg) to compare measurement precision across different operation modes. Data shown for nominally 3 μm diameter polystyrene particles (population; top) and repeated measurements of a single particle drawn from the same population (single particle trap; bottom). Subscripts 1 and 2 denote mode number and subscripts t and a denote tip and antinode, respectively. Measured histograms for a single trapped particle are not affected by the size variation observed in populations, but are wider than or comparable to the theoretical position-dependent error (given by two vertical dashed lines) because of system frequency noise and the filter's smoothing effect during data processing. For both population and trapping measurements, the second mode sensing at the antinode generates the narrowest histogram when frequency shifts at the antinode in the left and right channel are averaged (i.e., the f2,a (avg) exhibits the lowest CV and therefore best measurement precision).
Table 2.
A summary of the first and second flexural mode sensing characteristics for population and trapping measurements with 3, 4, and 5 μm diameter polystyrene beads for which the manufacturer-reported diameter CVs are 1.1%, 1.0%, and 1.0%, respectively. Buoyant mass CVs are ∼3-fold that of diameter CVs.
| Particle diameter |
|||
|---|---|---|---|
| Buoyant mass CV (%) forpopulation (trapping) | 3 μm | 4 μm | 5 μm |
| Δf1,t | 1.76 (1.40) | 1.72 (0.63) | 1.87 (0.43) |
| Δf2,t | 1.45 (0.99) | 1.33 (0.50) | 1.41 (0.38) |
| Δf2,a | 1.24 (0.70) | 1.22 (0.34) | 1.39 (0.23) |
| Δf2,a (avg) | 1.05 (0.53) | 1.19 (0.23) | 1.38 (0.14) |
CONCLUSION
This paper reports several promising characteristics of the higher eigenmode operation of suspended microchannel resonators for flowthrough mass sensing. Existing SMR devices can be operated at their second flexural bending modes to achieve high precision mass sensing and, in some cases, provide improved mass resolution. By eliminating position-dependent error, second mode antinode sensing can lower the minimum detectable size dispersity in particle samples and potentially reduce the time required for measuring single cell growth rates with dynamic trapping.2 Further improvements are expected via design optimization for geometrical dimensions and more efficient excitation11 and detection.
ACKNOWLEDGEMENTS
Funding was provided by an Institute of Collaborative Biotechnologies Grant (DAAD1903D0004) from the U.S. Army Research Office and EUREKA (R01GM085457) from the U.S. National Institutes of Health.
REFERENCES
- Burg T. P., Godin M., Knudsen S. M., Shen W., Carlson G., Foster J. S., Babcock K., and Manalis S. R., Nature 446(7139), 1066 (2007). 10.1038/nature05741 [DOI] [PubMed] [Google Scholar]
- Godin M., Delgado F. F., Son S., Grover W. H., Bryan A. K., Tzur A., Jorgensen P., Payer K., Grossman A. D., Kirschner M. W., and Manalis S. R., Nat. Methods 7(5), 387 (2010). 10.1038/nmeth.1452 [DOI] [PMC free article] [PubMed] [Google Scholar]
- Dohn S., Sandberg R., Svendsen W., and Boisen A., Appl. Phys. Lett. 86(23), 233501 (2005). 10.1063/1.1948521 [DOI] [Google Scholar]
- Waggoner P. S. and Craighead H. G., J. Appl. Phys. 105(5), 054306 (2009). 10.1063/1.3079793 [DOI] [Google Scholar]
- Cleland A. N., Foundations of Nanomechanics: From Solid-State Theory to Device Applications (Springer, Berlin, 2003). [Google Scholar]
- Dohn S., Svendsen W., Boisen A., and Hansen O., Rev. Sci. Instrum. 78, 103303 (2007). 10.1063/1.2804074 [DOI] [PubMed] [Google Scholar]
- Braun T., Ghatkesar M. K., Backmann N., Grange W., Boulanger P., Letellier L., Lang H. P., Bietsch A., Gerber C., and Hegner M., Nat. Nanotechnol. 4(3), 179 (2009). 10.1038/nnano.2008.398 [DOI] [PubMed] [Google Scholar]
- Burg T. P., Sader J. E., and Manalis S. R., Phys. Rev. Lett. 102, 228103 (2009). 10.1103/PhysRevLett.102.228103 [DOI] [PubMed] [Google Scholar]
- Tseytlin Y. M., Rev. Sci. Instrum. 76, 115101 (2005). 10.1063/1.2115207 [DOI] [Google Scholar]
- See http://www.thermo.com/com/cda/products/all_products/0,1061,10136016,00.html.
- Jin D. Z., Li X. X., Liu J., Zuo G. M., Wang Y. L., Liu M., and Yu H. T., J. Micromech. Microeng. 16(5), 1017 (2006). 10.1088/0960-1317/16/5/019 [DOI] [Google Scholar]