Abstract
Purpose: To develop a method to reconstruct an interior region-of-interest (ROI) image with sufficient accuracy that uses differentiated backprojection (DBP) projection onto convex sets (POCS) [H. Kudo et al., “Tiny a priori knowledge solves the interior problem in computed tomography,” Phys. Med. Biol. 53, 2207–2231 (2008)] and a tiny knowledge that there exists a nearly piecewise constant subregion.
Methods: The proposed method first employs filtered backprojection to reconstruct an image on which a tiny region P with a small variation in the pixel values is identified inside the ROI. Total variation minimization [H. Yu and G. Wang, “Compressed sensing based interior tomography,” Phys. Med. Biol. 54, 2791–2805 (2009); W. Han et al., “A general total variation minimization theorem for compressed sensing based interior tomography,” Int. J. Biomed. Imaging 2009, Article 125871 (2009)] is then employed to obtain pixel values in the subregion P, which serve as a priori knowledge in the next step. Finally, DBP-POCS is performed to reconstruct f(x,y) inside the ROI. Clinical data and the reconstructed image obtained by an x-ray computed tomography system (SOMATOM Definition; Siemens Healthcare) were used to validate the proposed method. The detector covers an object with a diameter of ∼500 mm. The projection data were truncated either moderately to limit the detector coverage to ∅350 mm of the object or severely to cover ∅199 mm. Images were reconstructed using the proposed method.
Results: The proposed method provided ROI images with correct pixel values in all areas except near the edge of the ROI. The coefficient of variation, i.e., the root mean square error divided by the mean pixel values, was less than 2.0% or 4.5% with the moderate or severe truncation cases, respectively, except near the boundary of the ROI.
Conclusions: The proposed method allows for reconstructing interior ROI images with sufficient accuracy with a tiny knowledge that there exists a nearly piecewise constant subregion.
Keywords: computed tomography, image reconstruction, interior region-of-interest
INTRODUCTION
When an object f(x,y) is scanned with a detector that has coverage that is smaller than the whole object, exact reconstruction of a region-of-interest (ROI) inside the object, where all lines that pass through the ROI are measured, would be beneficial. This situation occurs with diagnostic x-ray computed tomography (CT) systems that scan large patients, with C-arm cone-beam CT systems for interventional radiology and radiation oncology, with PET∕CT and SPECT∕CT systems and with single photon counting CT systems that have a limited detector speed.
Two methods have been developed that exactly solve the interior ROI reconstruction from truncated projection data in CT, but under restricted (probably impractical) conditions. It has been shown in Refs. 1, 4, 5 that with a small amount of a priori knowledge about the object f(x,y), i.e., f(x,y) is known on a small subregion P located inside the ROI, the interior ROI can be accurately reconstructed using differentiated backprojection (DBP) projection onto convex sets (POCS).6 Often in clinical cases, however, such a priori knowledge is not available, except for knowledge about the air in the bronchi or in the stomach.
It has also been proposed in Ref. 2 and proven in Ref. 3 that if the ROI is piecewise constant, the total-variation minimization (TV-min) method can solve the interior ROI problem exactly. However, images reconstructed by TV-min can look like patchy paintings, unnatural and different from images reconstructed by filtered backprojection (FBP), which radiologists are more familiar with and have been trained to review and interpret.
In this study, we propose to develop and validate an approximate algorithm to reconstruct an interior ROI image with sufficient accuracy that uses DBP-POCS and a tiny knowledge that there exists a nearly piecewise constant subregion. This paper concerns two-dimensional image reconstruction; the extension to three dimensions will be discussed in Sec. 5. Clinical x-ray CT data were used in the evaluation.
The structure of this paper is as follows: In Sec. 2, we present the proposed algorithm. In Sec. 3, we outline the evaluation methods. Results are presented in Sec. 4. In Sec. 5, relevant issues are discussed.
THE PROPOSED ALGORITHM
Kudo et al.1 empirically showed that imperfect a priori knowledge, e.g., merely the mean value of f(x,y) within P, was sufficient for reconstruction of ROI images with accuracy comparable to those reconstructed with f(x,y). We wish to obtain such imperfect but sufficient a priori knowledge using TV-min. The proposed algorithm sequentially performs the five steps shown below. The strategy was to identify a relatively flat small subregion P using FBP in steps 1 and 2, to obtain pixel values in P using TV-min in steps 3 and 4, and finally to reconstruct the ROI image using DBP-POCS with a priori knowledge of pixel values in P in step 5. To improve the robustness of the TV-min method, we used the virtual water support (discussed below) in step 3 for the initial estimate, and the golden ratio (or golden angle) for the angular distribution of projections7 in ordered-subset simultaneous arithmetic reconstruction technique (OS-SART) in step 4.
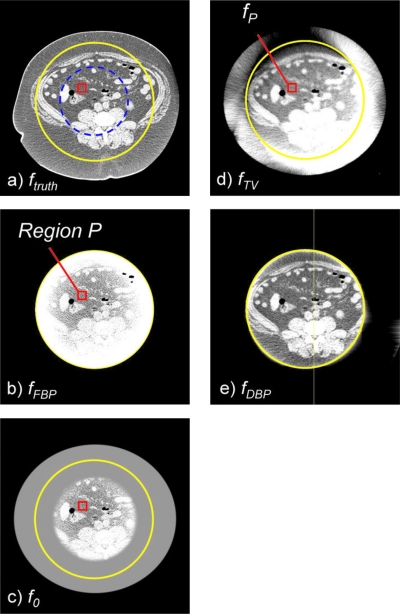
Step 1. We perform FBP to reconstruct an image, fFBP(x,y) [Fig. 1b], from the truncated projection data. The image suffers from cupping artifacts caused by the data truncation; however, the quality is sufficient for step 2.
Figure 1.
(a) The image reconstructed by the CT scanner, ftruth. A solid circle indicates the ∅350 mm ROI covered by the moderately truncated detector; a dashed circle indicates the ∅199 mm ROI covered by the severely truncated detector. A rectangle indicates a priori region P (21 mm×21 mm). [(b)–(e)] Images generated in steps 1–5 with the moderately truncated detector. Window width and level of images are 0.05 and 0.17 cm−1 or 300 and 0 HU. The image reconstructed by the proposed method, fDBP, showed very little bias throughout the ROI except near the edge of the ROI, while the image appeared very similar to that reconstructed by the CT scanner, ftruth.
Step 2. We manually identify a small subregion, P, inside the interior ROI, where the variation in the pixel values is small [see Fig. 1b].
Step 3. We generate an image, f0(x,y), by embedding fFBP(x,y) into an on-centered, elliptical water support [Fig. 1c].
Step 4. We employ TV-min2, i.e., minimize the l1 norm of the gradient image under the projection data constraint, utilizing f0(x,y) obtained in step 3 as the initial estimate,
| (1) |
where H is the system matrix and g is the truncated, measured projection data. From the reconstructed image, fTV(x,y) [Fig. 1d], pixel values of the subregion P, fP(x,y), are obtained.
Step 5. We set the initial image to zeros and perform DBP-POCS to reconstruct the final image, fDBP(x,y) [Fig. 1e], from the truncated, measured projections and the small amount of a priori knowledge about subregion image, fP(x,y).
In the following, we provide a high level pseudocode of the proposed five-step algorithm and additional explanation about steps 3–5. Further details of steps 4 and 5 including pseudocodes can be found in Refs. 2, 1, respectively.
-
(1)
Do FBP g→fFBP (step 1)
-
(2)
Identify a subregion P in fFBP (step 2)
-
(3)
Do virtual water support: fFBP→f0 (step 3)
-
(4)
Do TV-min: g, f0→fTV; fP(x,y)≔fTV(x,y) for (x,y) in P (step 4, Ref. 2)
-
(5)
Do DBP-POCS: g, fP→fDBP (step 5, Ref. 1).
In step 3, the major and minor axes of the ellipse were determined as follows. From the maximum line integral value of each of the two projection data sets obtained at 0° and 90°, and , the corresponding water-equivalent path lengths of the ellipse are calculated as , where μw is the linear attenuation coefficient of water at a given energy, 0.18 cm−1, θ=0° and 90°, and a, 0<a≤1, is a scaling parameter. The transition from fFBP(x,y) to water and from water to zero is smoothened as follows: f0(x,y)=(1−w(x,y))×finside(x,y)+w(x,y)×foutside(x,y) with w(x,y)=0 if , w(x,y)=1 if , and w(x,y)=3t2−2t3 and t=(b1−1)∕(b1−b2) otherwise.
In step 4, the TV-min alternates the following two steps: (1) An update of the image by using OS-SART to enforce the data fidelity constraint and (2) the steepest decent steps in order to minimize the TV of the image.2 The pseudocode is available in Ref. 2. Projections are chosen using a constant angular interval of 137.5078°, based on the golden angle, to derive a quasiuniform angular distribution within a subset and nonsystematic, interlaced angular samplings between subsets.7 The angle of the first projection of the first subset is randomized for every iteration.
In step 5, differentiated projections are calculated using Katsevich’s original scheme,8 i.e., differentiating the adjacent parallel rays, which are backprojected onto the image space to reconstruct a Hilbert transformed object image. A truncated Hilbert inverse transform is then performed using the POCS-2 algorithm of Ref. 1 to reconstruct two intermediate images, followed by a shift-variant weighted summation of the two images described as follows. Let xps, xpe, yps, and ype be the x and y coordinates of the four corners of the rectangular subregion P. First, the truncated Hilbert inverse transform is performed along the y axis to reconstruct a subset of the ROI, fy(x,y), using fP(x,y), x∊[xps,xpe], y∊[yps,ype], as a prior. The pixel values of subregion P are then over-ridden by performing the Hilbert inverse transform after the iteration is completed, and thus, a potential subtle discontinuity at the boundary of the subregion P can be avoided. Then, the entire ROI image,fyx(x,y), is reconstructed using the truncated Hilbert inverse transform along the x axis using fy(x,y), x∊[xps,xpe], as a prior. The pixel values of fy(x,y) are replaced by those obtained via the Hilbert inverse transform. Similarly, we perform POCS-2 twice, first along the x axis and then along the y axis, to obtain fxy(x,y). Finally, a weighted summation is applied to obtain the final image fDBP(x,y)=(1−w(x,y))×fxy(x,y)+w(x,y)×fyx(x,y) with w(x,y)=0 if 0≤t≤cos φ2, , w(x,y)=1 if cos φ1≤t≤1, and w(x,y)=3s2−2s3 with s=(t−cos φ2)∕(cos φ1−cos φ2). We will discuss the reason for this shift-variant weight in Sec. 5.
EVALUATION METHODS
We evaluated the performance of the proposed method using clinical CT data obtained using a commercial x-ray CT system (SOMATOM Definition; Siemens Healthcare, Forchheim, Germany). The original detector, with 672 channels, covered a circular field of view with a diameter of 503 mm. We truncated the projection data either moderately to limit the detector coverage to ∅350 mm with 460 channels or severely to limit the detector coverage to ∅199 mm with 258 channels. The abdomen of a 59-yr-old male patient was scanned utilizing a circular, step-and-shoot scanning mode with the following settings: 1152 projections per rotation, a gantry rotation speed of 500 ms∕rotation, a tube current of 570 mA, and a tube voltage of 140 kV. The projection data (line integrals) and image data were archived and the evaluation was performed off-line. The image reconstructed by the scanner, ftruth(x,y), shown in Fig. 1a was used as the gold standard after the unit of pixel values was converted to the linear attenuation coefficient using μw=0.18 cm−1.
Parameters and settings used in this study were as follows. In step 1, the Shepp–Logan filter was used and the image f(x,y) had a matrix size of 640×640 with a pixel size of 1 mm×1 mm. In step 2, the specified small subregion P had a size of 21 mm×21 mm centered at (−34.5 mm, 34.5 mm). In step 3, the scaling parameter a was 0.9, and the ellipse and the smoothing range were defined for both moderate and severe truncations by the following parameters: rx1=258.0 mm, rx2=268.8 mm, ry1=237.9 mm, and ry2=247.9 mm. The parameters for the transition from fFBP(x,y) to water were as follows: rx1=ry1=105.0 mm and rx2=ry2=115.0 mm for the moderately truncated data and rx1=ry1=55.0 mm and rx2=ry2=75.0 mm for the severely truncated data. In step 4, projections were split into 55 subsets; there were 21 projections in each subset except the last subset, which had 18 projections. The number of global iterations was 10, resulting in a total of 550 image updates for the OS-SART part. The other parameters were identical to those described in Ref. 2. The distance-driven forward and backprojectors9 were used. In step 5, the object support (t=±1 in Ref. 2) was assumed to be an on-center circle with a diameter of 600 mm. The parameters for the weighted sum were φ1=30° and φ2=60°, which were chosen to divide a 90° range into equally sized three regions. The iteration of POCS-2 was terminated when the iterations reached a predetermined number for each filtering line, which is the number of pixels within the ROI along the line.
Prior to the following analyses of results, a 5×5 boxcar filter was applied to the images to decrease the noise. A root mean square error (RMSE), as a function of the distance from the isocenter, was calculated between a target image and the gold standard image, ftruth. A RMSE at a radius r was then calculated from image pixels within a donut-shaped region at r with a width of 3 mm.
EVALUATION RESULTS
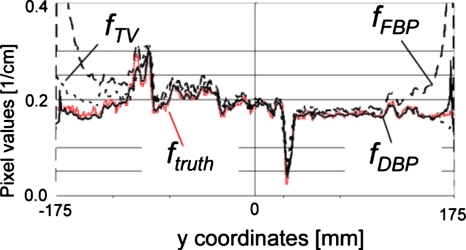
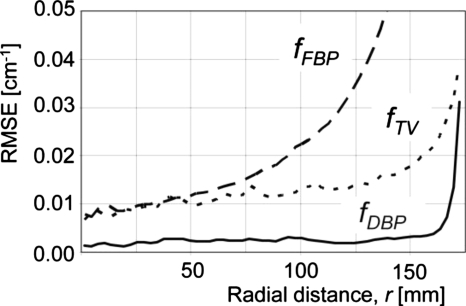
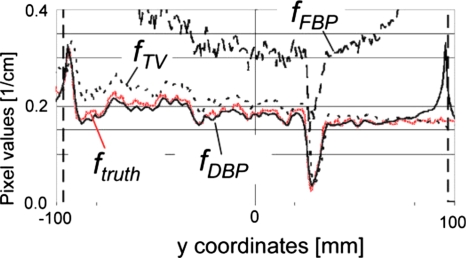
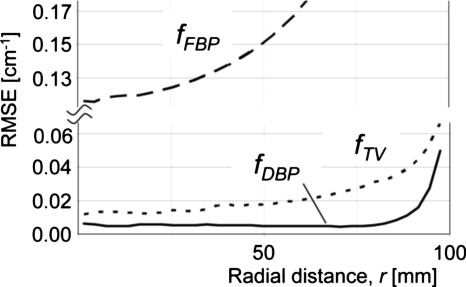
Results for the moderate truncation are shown in Figs. 123. fFBP suffered from cupping artifacts near the edge of the ROI [Fig. 1b], while the bias near the isocenter was as small as that of fTV (Figs. 23). We could easily identify a region with a relatively small pixel value variation for the subregion P. fTV had pixel values very close to the truth (Figs. 23), and the RMSE values remained small for a much larger region than they did for fFBP. However, the image fTV appeared somewhat patchy and apparently different from ftruth. Notice that images are presented with a narrow window width; the bias that resulted in bright or dark pixel values near the bottom or top of fTV [Fig. 1d], respectively, was not too large, as can be seen in Fig. 2. The TV-min method, fTV, provided accuracy sufficient to obtain a prior for the DBP-POCS algorithm, while even the filtered backprojection, fFBP, may be sufficient at this level of truncation if a region with a small pixel value variation can be found near the isocenter. The proposed method provided the image with correct pixel values throughout the entire ROI except near the edge of the ROI (see Figs. 23); the subjective impression of the image was very similar to that of the gold standard image. Difference images from ftruth generally presented the same results as in Fig. 3 and, thus, are not shown. The coefficient of variation (COV), i.e., the ratio of the RMSE to the mean of pixel values presented in percentages, was less than 2.0% for distances up to 160 mm and 7.8% for distances up to 170 mm. Considering that the moderately truncated detector covered a radius of 175 mm, the COV values were sufficiently small within the entire ROI, except near the edge.
Figure 2.
Vertical profiles of images shown in Fig. 1 along x=27 mm.
Figure 3.
RMSE values of images shown in Fig. 1 as a function of radial distances from the isocenter.
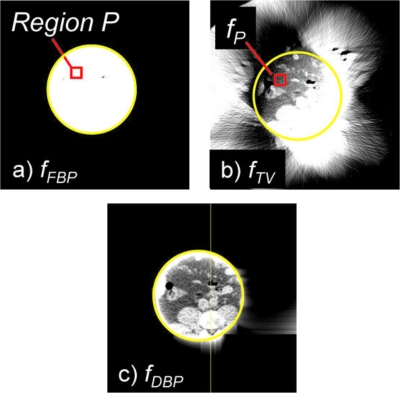
Results with the severe truncation are shown in Figs. 456. There were significant amounts of cupping artifacts and bias in fFBP even near the isocenter (Figs. 56). In this case, filtered backprojection was not sufficient to obtain a priori knowledge of the object, P. With adjustments of the window level, however, we could confirm that the subregion P had a relatively small pixel value variation. Again, the fDBP provided correct pixel values throughout the entire ROI except for at the very edge of the ROI (Figs. 56), and the appearance of the image was similar to that of the gold standard image. The COV was less than 4.5% for distances up to 86 mm and 8.6% for distances up to 92 mm, while the detector covered a radius of 100 mm. With a given significant amount of truncation [see Fig. 1a], the achieved accuracy was considered satisfactory.
Figure 4.
Images generated in steps 1, 4, and 5 with the severely truncated detector. A solid yellow circle indicates the ∅199 mm ROI. Window width and level of images are 0.05 and 0.17 cm−1 or 300 and 0 HU.
Figure 5.
Vertical profiles of images shown in Fig. 4 along x=27 mm.
Figure 6.
RMSE values of images shown in Fig. 4 as a function of radial distances from the isocenter.
DISCUSSION AND CONCLUSION
We have proposed and validated the five-step method that sequentially performs FBP, TV-min, and DBP-POCS to reconstruct the ROI image. When the object f(x,y) is not piecewise constant, the prior knowledge of the object on which TV-min is based is inaccurate. It is then not guaranteed that TV-min will converge into a solution that approximates an arbitrary object with piecewise constant functions in a least-squares sense, especially with the presence of noise. Images reconstructed by DBP-POCS using imperfect a priori knowledge obtained from images reconstructed by TV-min are not exact because of the imperfect prior. Nevertheless, the experimental results demonstrate that the proposed method reconstructs interior ROI images of clinical CT data with sufficient accuracy even though noise was present in the projection. To the best of our knowledge, this was the first time either the TV-min method or the DBP method was evaluated using clinical CT projection data.
The most challenging of the five steps is the TV-min process (step 4). The balance of the two alternating parts, the TV-min part and the data fidelity constraint part, is critical to obtaining reasonable results. After we attempted other implementations with no success, we concluded that to make step 4 robust, it is critical to use OS-SART—which slows down the convergence and makes updated images not projection angular dependent—and to perform the TV-min step after every image update. We applied the parameters used in Ref. 2 to two significantly different degrees of truncation and obtained good results. Sidky and Pan10 proposed a method to adaptively balance the strength of the two alternating parts, which worked well with the incomplete data set obtained from a circular cone-beam scan. Adapting their approach to the interior ROI reconstruction may be necessary to handle various clinical data with different conditions.
The DBP-POCS step should improve in terms of filtering directions and discontinuities across filtering lines. We used two sets of the two-step filtering, one for x→y and the other for y→x, and used a shift-variant weighted summation of the two intermediate images. This approach was easy to implement and allowed us to avoid filtering with few image pixels within the ROI but was computationally expensive. Filtering along polar directions will improve the efficiency.
Subtle discontinuities were observed across filtering lines in the reconstructed images. Potential causes include noise and inconsistency (e.g., beam-hardening effect) in the projection data and a suboptimal termination of the iteration. The data constraint step (projection P4) of POCS-2 uses a projection obtained along the filtering line. Although we employed a weighted summation of adjacent discrete projection rays, the interpolated projection values were not consistent from one filtering line to another, which may be the cause of the discontinuity. The iteration of POCS-2 was terminated suboptimally when the number of iterations reached a predetermined number. We observed that the convergence speed of POCS-2 varied strongly, depending on various factors such as the number of pixels within the ROI, the number of pixels within the a priori region P, and the mass and the profile of the truncated and measured parts of the object. We used the number of pixels within the ROI along the filtering line as the number of iterations, which produced fewer discontinuities than did a fixed number of iterations. Other approaches to enforce continuity across filtering lines may be necessary as well.
The criteria on how to select the small subregion P remain an open question. Various factors, including the size, the location, and the degree of pixel value variations as well as those of ROI and truncated data, seem to have different effects on TV-min and DBP-POCS. For example, a subregion with a larger pixel value variation, which yields Hilbert transformed data with more distinct profiles, seems to work better with DBP-POCS than that with a smaller variation does. In contrast, a subregion with a larger pixel value variation is not piecewise constant, thus, violates the assumption TV-min method uses. The properties of the two methods need to be further investigated to clarify the effects. Once the selection criteria have been established empirically or theoretically, one should develop an automatic scheme to identify subregion P in step 2. The optimal parameter settings and the accuracy of the resulting images may depend on the abovementioned various factors as well as the rest of ROI and truncated data. Our preliminary experiments (not shown) indicated that the accuracy of images might degrade significantly when the subregions were too small (e.g., 5 mm×5 mm); however, more systematic, thorough assessments of each factor are necessary to better understand and establish the criteria on the selection of the small subregion.
We focused on the accuracy of the pixel value and, in so doing, did not present the results of the spatial resolution or the noise present in images in this paper. We did not observe a noticeable difference between the results for FBP and DBP-POCS even with subtraction images because the pixel size was as large as 1 mm. One can improve the spatial resolution of DBP-POCS images comparable to that of FBP images using a newly developed method to calculate differentiated projections.8 We shall leave these to future studies.
The extension to three-dimensional image reconstruction from cone-beam projections may not be trivial, depending on the scan orbit. The DBP-POCS method in step 5 requires that a filtering line connects two points on the orbit. It is thus straightforward to apply the proposed method to orbits that satisfy the requirement such as a helical scan or a circle-plus scan. For other orbits that do not satisfy the requirement such as a circular scan, one could neglect the cone angle11 at the expense of cone-beam artifacts.
ACKNOWLEDGMENTS
The authors thank Elliot K. Fishman, M.D., for providing the clinical CT data and Michel Defrise, Ph.D., for drawing our attention to Ref. 3. This work was supported in part by NIH Grant No. R01 HL087918.
References
- Kudo H., Courdurier M., Noo F., and Defrise M., “Tiny a priori knowledge solves the interior problem in computed tomography,” Phys. Med. Biol. 53, 2207–2231 (2008). 10.1088/0031-9155/53/9/001 [DOI] [PubMed] [Google Scholar]
- Yu H. and Wang G., “Compressed sensing based interior tomography,” Phys. Med. Biol. 54, 2791–2805 (2009). 10.1088/0031-9155/54/9/014 [DOI] [PMC free article] [PubMed] [Google Scholar]
- Han W., Yu H. and Wang G., “A general total variation minimization theorem for compressed sensing based interior tomography,” Int. J. Biomed. Imaging 2009, Article 125871 (2009). 10.1155/2009/125871 [DOI] [PMC free article] [PubMed] [Google Scholar]
- Courdurier M., Noo F., Defrise M., and Kudo H., “Solving the interior problem of computed tomography using a priori knowledge,” Inverse Probl. 24, 065001 (2008). 10.1088/0266-5611/24/6/065001 [DOI] [PMC free article] [PubMed] [Google Scholar]
- Ye Y., Yu H., Wei Y. and Wang G., “A general local reconstruction approach based on a truncated Hilbert transform,” Int. J. Biomed. Imaging 2007, Article 63634 (2007). 10.1155/2007/63634 [DOI] [PMC free article] [PubMed] [Google Scholar]
- Defrise M., Noo F., Clackdoyle R., and Kudo H., “Truncated Hilbert transform and image reconstruction from limited tomographic data,” Inverse Probl. 22, 1037–1053 (2006). 10.1088/0266-5611/22/3/019 [DOI] [Google Scholar]
- Winkelmann S., Schaeffter T., Koehler T., Eggers H., and Doessel O., “An optimal radial profile order based on the golden ratio for time-resolved MRI,” IEEE Trans. Med. Imaging 26, 68–76 (2007). 10.1109/TMI.2006.885337 [DOI] [PubMed] [Google Scholar]
- Noo F., Hoppe S., Dennerlein F., Lauritsch G., and Hornegger J., “A new scheme for view-dependent data differentiation in fan-beam and cone-beam computed tomography,” Phys. Med. Biol. 52, 5393–5414 (2007). 10.1088/0031-9155/52/17/020 [DOI] [PubMed] [Google Scholar]
- Man B. D. and Basu S., “Distance-driven projection and backprojection in three dimensions,” Phys. Med. Biol. 49, 2463–2475 (2004). 10.1088/0031-9155/49/11/024 [DOI] [PubMed] [Google Scholar]
- Sidky E. Y. and Pan X., “Image reconstruction in circular cone-beam computed tomography by constrained, total-variation minimization,” Phys. Med. Biol. 53, 4777–4807 (2008). 10.1088/0031-9155/53/17/021 [DOI] [PMC free article] [PubMed] [Google Scholar]
- Pan X., Xia D., Zou Y., and Yu L., “A unified analysis of FBP-based algorithms in helical cone-beam and circular cone-and fan-beam scans,” Phys. Med. Biol. 49, 4349–4369 (2004). 10.1088/0031-9155/49/18/011 [DOI] [PubMed] [Google Scholar]


