

Abstract
Fluorescent-magnetic-biotargeting multifunctional nanobioprobes (FMBMNs) have attracted great attention in recent years due to their increasing, important applications in biomedical research, clinical diagnosis, and biomedicine. We have previously developed such nanobioprobes for the detection and isolation of a single kind of tumor cells. Detection and isolation of multiple tumor markers or tumor cells from complex samples sensitively and with high efficiency is critical for the early diagnosis of tumors, especially malignant tumors or cancers, which will improve clinical diagnosis outcomes and help to select effective treatment approaches. Here, we expanded the application of the monoclonal antibody (mAb)-coupled FMBMNs for multiplexed assays. Multiple types of cancer cells, such as leukemia cells and prostate cancer cells, were detected and collected from mixed samples within 25 minutes by using a magnet and an ordinary fluorescence microscope. The capture efficiencies of mAb-coupled FMBMNs for the above mentioned two types of cells were 96% and 97% respectively. Furthermore, by using the mAb-coupled FMBMNs, specific and sensitive detection and rapid separation of a small number of spiked leukemia cells and prostate cancer cells in a large population of cultured normal cells (about 0.01% were tumor cells) were achieved simply and inexpensively without any sample pretreatment before cell analysis. Therefore, mAb-coupled multicolour FMBMNs may be used for very sensitive detection and rapid isolation of multiple cancer cells in biomedical research and medical diagnostics.
Keywords: tumor, cancer, quantum dot, magnetic, multifunctional nanoparticle, multifunctional nanosphere, multifunctional nanobioprobe
In recent several years, many different kinds of multifunctional nanomaterials have been synthesized. The opitcal-magnetic bifunctional Au-Fe3O4/Au-Co or Ag-Fe3O4 nanoparticles synthesized by several different research groups with different methods have wide applications in biological and chemical research such as protein separation/detection,1,2 DNA sensors,3 magnetic resonance imaging and photothermic therapy, 4,5 clinical immunoassay, 6 pathogens detection,7 catalyzing reaction8 and so on. Jinwoo Cheon et al. have synthesized biocompatible heterostructured FePt-Au nanoparticles for multimodal biological detection.9 Besides the magnetic-optical bifunctional nanoparticles mentioned above, the fabrication of fluorescent-magnetic bifunctional nanoparticles composed of quantum dots and magnetic nanoparticles has also attracted extensive attention. By means of encapsulation, direct reaction, and inorganic synthesis, fluorescent-magnetic bifunctional nanoparticles with different structures have been prepared successfully and most of them have also been successfully applied in the fields of multimodal imaging, cell labeling and separation, intracellular spatial control, drug delivery and so on. 10-34 Of interest is that Wilson et al. conducted a multiplexed protein detection based on the fluorescent-magnetic nanoparticles, 24 the first multiplex assay with the fluorescent-magnetic nanoparticles.
In the last few decades, cancers have become one of the major human diseases that ultimately result in the death. Accurate, sensitive and rapid diagnosis techniques for cancers and the facile collection/isolation techniques for cancer cells are of critical importance for investigation, prevention, and treatment of cancer. An ideal diagnosis and collection/isolation technique depends on two ingredients. One is the advancement in the investigation of the molecule mechanisms of cancer at the genetic and molecular level, such as determining biomarkers associated with a specific cancer. The other is the development of the techniques that are more accurate, more sensitive and less time-consuming. Current diagnosis techniques for cancers include the analysis of immunophenotyping by pathological section 35,36 or flow cytometry,37-39 microarray,40, 41, PCR, 42-44 karyotyping 45, 46 and aptamer based recognition.47, 48 Each of those techniques has its own limits and advantages. The flow cytometry technique based on immunophenotypic analysis is accurate but costly. The microarray analysis could detect multiplex samples at a time, but its result is less reliable compared to other methods. PCR-based method has proven to be a highly sensitive diagnostic technique for cell identification, but this method is time-consuming and tends to give false-negative results, especially when the low-level signals are expected in the cells. Therefore, developing rapid, economical, high effective diagnosis techniques for cancer is still an urgent unmet need. As to the cell collection or isolation techniques, magnetic nanoparticles-based cell collection has been used frequently in recent years, replacing the costly flow cytometry and traditional centrifugation. As an alternative to micrometer magnetic beads-based selection, 49, 50 the small size and increased relative surface area of nanoparticles provide enhanced extraction capabilities.51-53
Several groups have detected and isolated cancer cells using the fluorescent-magnetic nanoparticles based on receptor-ligand interaction.13, 14, 22, 25, 33, 54, 55 However, only one kind of cancer cells/sample was analyzed in these studies. Tan et al. have successfully used aptamer-conjugated magnetic nanoparticles and aptamer-conjugated fluorescent nanoparticles to collect and detect multiple cancer cells from one sample sequentially,56 offering a potential for multiple cancer cells assay. However, two different kinds of nanoparticles had to be prepared separately.
We have previously described avidin-conjugated fluorescent-magnetic-biotargeting multifunctional nanoparticles for visual recognition and rapid isolation of apoptotic cell, which used high-affinity biotinylated annexin V for signal recognition.23 Here, we have developed monoclonal antibody (mAb)-coupled fluorescent-magnetic-biotargeting multifunctional nanobioprobes (FMBMNs) protocols to perform detection and extraction of multiple types of cancer cell targets from complex samples via the high-affinity between antigens and antibodies. As the model systems, we used leukemia cells (Jurkat T), prostate cancer cells (LNCaP), Red blood cells, human lung fibroblast (MRC-5), and the mixtures of the above mentioned cells. As specific cell markers, we used CD3 (cluster of differentiation 3) for Jurkat T cells, 57, 58 and prostate-specific membrane antigen (PSMA) for prostate cancer cells. 59, 60 We demonstrated that the mAb-coupled FMBMNs have the capability to identify and isolate multiple target cells from complex mixtures effectively, raising the possibility of using such an approach in clinical applications.
Results and Discussion
Characterization of the mAb-coupled FMBMNs
We first validate the quality of the fluorescent-magnetic bifunctional nanoparticles by analyzing their physical properties such as the size and specific magnetization and etc. (see Figure S1, S2 and S3 in Supporting Information). We then fabricated different mAb-coupled FMBMNs by coupling the corresponding mAbs to the bifunctional nanoparticles by using an indirect conjugation method based on the high affinity between biotin and avidin, and the interaction between the primary antibody and second antibody, as shown in Figure 1A. In such a design, the mAbs were immobilized on the surface of the fluorescent-magnetic bifunctional nanoparticles (Figure 1A). Figure 1B and Figure 1C shows the fluorescence microscope images of mAb-coupled nanobiobrobes. Both the anti-CD3 mAb-coupled nanobiobriobes (Figure 1B) and anti-PSMA mAb-coupled nanobioprobes (Figure 1C) were clearly monodispersed and retained the expected fluorescence.
Figure 1.

(A) Schematic drawing of a mAb-coupled FMBMN. Fuorescent-magnetic bifunctional nanoparticles were covalently coupled with avidin. They were then coated with biotinylated goat anti-mouse IgG (Fc specific) via the biotin-avidin interaction. Mouse monoclonal antibody (mAb) was then attached to the nanoprticles via the binding to the goat antibody. (B, C) Fluorescence microscopic images of anti-CD3 mAb-coupled red nanobioprobes (B) and anti-PSMA mAb-coupled yellow nanobioprobes (C). Here each fluorescent dot came from single mAb-coupled FMBMN containing multiple QDs.
In the preparation of mAb-coupled nanobioprobes, the biotinylated goat anti-mouse IgG (Fc specific, note that antibodies consist of two parts—Fab and Fc. 61 Of these two parts, the Fab segment is the functional domain which recognizes the antigen specifically and Fc is a structural domain) was used to ensure that the Fab segment of anti-CD3 mAbs or anti-PSMA mAbs was on the surface of the nanoparticles, which avails to recognize the target cells and enhances the isolation efficiency. We subsequently confirmed that the mAbs on the nanoparticles could specifically interact with FITC labeled goat anti-mouse Fab fragments (Fab specific), as demonstrated for the anti-CD3 mAb-coupled nanobioprobes shown as Figure 2. Analysis of the FITC fluorescence clearly showed the binding of FITC labeled goat anti-mouse Fab fragments (Fab specific) to the anti-CD3 mAb-coupled red nanobioprobes (Figure 2B and Figure 2C), indicating that the bioactivity of the anti-CD3 mAbs was preserved during the coupling process. As a negative control, no FITC fluorescence was detected when anti-CD3 mAb-free nanoparticles were incubated with FITC labeled goat anti-mouse Fab fragments (Fab specific) (Figure 2D), or when anti-CD3 mAb-coupled red nanobioprobes were incubated with FITC labeled goat anti-mouse Fab fragments (Fc specific) (Figure 2E). The bioactivity and specificity of anti-PSMA mAb-coupled nanobioprobes were similarly confirmed (data not shown).
Figure 2.

Target specificity of the anti-CD3 mAb-coupled red FMBMNs. (A) Schematic drawing of antibody recognition. The nanobioprobes as prepared in Figure 1 were incubated with FITC labeled goat anti-mouse Fab fragment (Fab specific). The FITC labeled goat antibody will bind specifically to the nanobioprobe, enabling it to produce green fluorescence under UV due to the FITC. (B, C, D, E) Fluorescent images of anti-CD3 mAb-coupled red FMBMNs incubated with FITC labeled goat anti-mouse antibodies. The FITC labeled goat anti-mouse antibodies bound to mouse anti-CD3 antibodies on the nanobioprobes. Under UV, the FITC produced the green fluorescence (B). Note that there was also red fluorescence form the nanobioprobes. In some nanobioprobes, the red fluorescence was sufficiently strong to produce an overall yellow color for these nanobioprobes. (C) After photobleaching the FITC from the nanobioprobes in (B), only the red fluorescence from the nanobioprobes was detected. (D) and (E) Control experiments: only red fluorescence from the QDs in the nanoparticles was detected when bifunctional nanoparticles (i.e., without attaching the anti-CD3 mAbs) incubating with FITC labeled goat anti-mouse Fab fragment (Fab specific) (D) or when anti-CD3 mAb-coupled nanobioprobes incubated with FITC labeled anti-mouse Fab fragment (Fc specific) (E). Here each fluorescent dot (in C, D and E) came from single mAb-coupled FMBMN containing multiple QDs.
Detection of multiple types of target cancer cell with mAb-coupled FMBMNs
To confirm the mAb-coupled nanobioprobes have the capabilities of recognizing the target cells, the anti-CD3 mAb-coupled nanobioprobes and anti-PSMA mAb-coupled nanobioprobes were incubated with cell samples as mentioned in Materials and Methods. For specificity test, the LNCaP cells and Red blood cells were used as the controls for Jurkat T cells experiment with the anti-CD3 mAb-coupled nanobioprobes, while the Jurkat T cells and Red blood cells were used as the controls for LNCaP cells experiment with the anti-PSMA mAb-coupled nanobioprobes as diagramed in Figure 3. Because the target cancer cells had been stained with fluorescent dyes and the mAb-coupled nanobioprobes contained fluorescent quantum dots, they could be visualized by their different fluorescence when excited under a lamp-house after the experiment. If green fluorescence of nucleoclus and red fluorescence on the surface of cell appeared simultaneously, we would conclude that the Jurkat T cell was recognized by the anti-CD3 mAb-coupled nanobioprobes. Similarly, if blue and yellow fluorescence appeared simultaneously, we would conclude that the LNCaP cell was detected by the anti-PSMA mAb-coupled nanobioprobes.
Figure 3.

Schematic drawing of the recognition of specific cancer cells by nanobioprobes. (A) Two types of nanobioprobes coated with anti-CD3 or anti-PSMA mAb recognize Jurkat T cells or LNCaP cells, respectively. (B) Magnetic isolation of cancer cells bound by nanobioprobes. (C) Fluorescent imaging of target cancer cells under a fluorescence microscope. When the a mixture of the two types of cancer cells in A were bound by their respective nanobioprobes, they can be distinguished under UV due to different colors of the attached nanobioprobes.
After incubating the labeled cells with the nanobioprobes, the mixtures were subjected to magnetic separation (see Figure S4A in Supporting Information for the magnetic field strength used). Fluorescent microscopic images of the precipitate were then taken. Figure 4 shows the results of a representative experiment in which the anti-CD3 mAb-coupled nanobioprobes (with red fluorescence emission) and Jurkat T cells were analyzed. The bright-field image revealed nanobioprobes bound to the cell surface (Figure 4A) while the strong red fluorescence (form the anti-CD3 mAb-coupled nanobioprobes) on the surface of the cells and green fluorescence (from the SYTO 13 dye) inside the cells demonstrated the detection of the nanobioprobes to the cells (Figure 4B). In contrast, when the anti-CD3 mAb-coupled nanobioprobes were incubated with LNCaP cells (Figure 4D and Figure 4E) and Red blood cells (Figure 4F and Figure 4G), only nanobioprobes (Figure 4D and Figure 4F) and red fluorescence (from the nanobioprobes in Figure 4E and Figure 4G) were observed under the fluorescence microscope. Thus, the anti-CD3 mAb-coupled nanobioprobes specifically targeted the Jurkat T cells.
Figure 4.

Fluorescent microscopic images of cells incubated with anti-CD3 mAb-coupled FMBMNs followed by isolation with a magnet. (A) bright-field image of Jurkat T cells bound with nanobioprobes. (B) Fluorescent field: green fluorescence from SYTO 13 in the nuclei and red fluorescence from the nanobioprobes bound to the cells. (C) Merged photo of (A) and (B). (D, E) LNCaP cells and (F, G) Red blood cells after incubation with anti-CD3 mAb-coupled FMBMNs and isolation with a magnet: no cells were isolated and only the nanobioprobes were present in both the bright-field (D, F) and fluorescent field (E, G).
Similarly, when the anti-PSMA mAb-coupled nanobioprobes (with yellow fluorescence emission) and LNCaP cells were used for test, the nanobioprobes bound to cell surface were observed in the bright-field (Figure 5A) and yellow fluorescence (from the anti-PSAM mAb-coupled nanobioprobes) on the cell surface and blue fluorescence (from Hochest 33342) inside the cell were observed (Figure 5B), indicating the binding of the nanobioprobes to the LNCaP cells. On the other hand, when the anti-PSMA mAb-coupled nanobioprobes were incubated with Jurkat T cells (Figure 5D and Figure 5E) and Red blood cells (Figure 5F and Figure 5G), only nanobioprobes (Figure 5D and Figure 5F) and yellow fluorescence (from the nanobioprobes in Figure 5E and Figure 5G) were observed under fluorescence microscope, indicating the lack of binding of the nanobioprobes to these two cell types. Thus, the anti-PSMA mAb-coupled FMBMNs can specifically recognize the LNCaP cells.
Figure 5.

Fluorescent microscopic images of cells incubated with anti-PSMA mAb-coupled FMBMNs and followed by isolation with a magnet. (A) bright-field image of LNCaP cell bound with nanobioprobes. (B, C) Fluorescent field: yellow fluorescence from nanobioprobes (B) blue fluorescence from Hochest 33342 in the nuclei (C). (D, E) Jurkat T cells and (F, G) Red blood cells after incubation with anti-PSMA mAb-coupled FMBMNs and isolation with a magnet: no cells were isolated and only the nanobioprobes were present in both the bright-field (D, F) and fluorescent field (E, G).
Isolation of multiple types of target cancer cell with mAb-coupled FMBMNs
Having shown the expected binding, we next test the ability of these mAb-coupled nanobioprobes to isolate target cells from cell mixtures by first creating artificially mixed samples of Jurkat T, LNCaP and Red blood cells. The samples were prepared by mixing approximately 2×10⁵ target cells (Jurkat T cells or LNCaP cells) and 106 control cells (Red blood cells), and then analyzed by using the respective mAb-coupled nanobioprobes. The mixtures were then analyzed according to the procedure shown in Figure 3B. After incubation and magnetic separation as described in the Materials and Methods section, the magnetic precipitate and supernatants were imaged under the fluorescence microscope. As shown in Figure 6, when samples containing 2×10⁵ Jurkat T cells labeled with SYTO 13 and 106 Red blood cells were treated with anti-CD3 mAb-coupled nanobioprobes, the isolated cells had the nanobioprobes bound to Jurkat T cell surface as observed in the bright-field (Figure 6A), and had red fluorescence (from anti-CD3 mAb-coupled nanobioprobes) on the cell surface and green fluorescence (from SYTO 13) inside the cell (Figure 6B), indicating that the isolated Jurkat T cells had anti-CD3 mAb-coupled nanobioprobes bound to the surface. On the other hand, the supernatants had smaller cells (compared with Jurkat T cells) in the bright-field (Figure 6C) and very few green fluorescent spot in the fluorescence field (Figure 6D). Thus, the smaller, Red blood cells were not bound by the nanobioprobes and thus left in the supernatant while very few Jurkat T cells (with green fluorescence) were present in the supernatant.
Figure 6.

Fluorescent microscopic images of cells after incubation with mAb-coupled FMBMNs. (A) Bright-field and (B) fluorescent field images of Jurkat T cells captured from the mixture of Jurkat T cells and Red blood cells by the anti-CD3 mAb-coupled nanobioprobes in the magnetic precipitate. Note that the Jurkat T cells were labeled green in the nuclei. (C) Bright-field and (D) fluorescence field of cells in the supernatant. Note that few Jurkat T cells (green nuclei) remained. (E) Bright-field and (F) fluorescent field of LNCaP cells captured from the mixture of LNCaP cells and Red blood cells by the anti-PSMA mAbcoupled nanobioprobes in the magnetic precipitate. Note that the LNCaP cells were labeled blue in the nuclei. (G) Bright-field and (H) fluorescent field of cells in the supernatant. Few LNCaP cells (blue nuclei) remained.
Similarly, when 2×10⁵ LNCaP cells labeled with Hochest 33342 and 106 Red blood cells were mixed and treated with anti-PSMA mAb-couple nanobioprobes, the magnetic precipitate showed cells with nanobioprobes bound to the cell surface in the bright-field (Figure 6E), and yellow fluorescence (from PSMA mAb-coupled nanoparticles) on the cell surface and blue fluorescence (from Hochest 33342) inside the cell in the fluorescence filed (Figure 6F). The supernatants again contained the smaller cells (compared with LNCaP cells) as shown in the bright-field (Figure 6G) and few blue fluorescence spot in the fluorescence field (Figure 6H). Here again, the smaller, Red blood cells were not bound by the nanobioprobes and thus left in the supernatant while very few with LNCaP cells (with blue fluorescence) were present in the supernatant.
The efficiency of the mAb-coupled FMBMNs to capture the target cancer cells
The above studies clearly demonstrated that both kinds of mAb-coupled nanobioprobes could specifically detect and isolate their target cells. To investigate whether they could be used for effective capture of the target cells, we next analyzed the effect of the incubation time and the amount of nanobioprobes on the efficiency of the mAb-coupled nanobioprobes to capture the target cells. The numbers of each type cells before and after capturing with mAb-coupled nanobioprobes were determined with a hemocytometer to calculate the efficiency of the mAb-coupled nanobioprobes to capture the target cancer cells as described in the Materials and Methods, and the results were shown in Figure 7. The capture efficiency of about 80% was found to be independent of the incubation time of 15 min or longer when using anti-CD3 mAb-coupled nanobioprobes with the concentration of 1.5×10¹⁰ nanobioprobes/mL on samples containing 2×10⁵ Jurkat T cells per milliliter (Figure 7A). However, the capture efficiency increased with increasing concentration of nanobioprobe until the latter reached 6.0×10¹⁰nanobioprobes/mL where about 96% of target cancer cells were captured. Subsequently, the capture efficiency remained constant with increasing concentration of nanobioprobes from 6.0×10¹⁰ nanobioprobes/mL up to 9.0×10¹⁰ nanobioprobes/mL (Figure 7B). Thus, under the experimental conditions, 15 min incubation was sufficient for the anti-CD3 mAb-coupled nanobioprobes to bind to the target Jurkat T cells and 6.0×10¹⁰ nanobioprobes were sufficient for magnetic separation 96% target Jurkat T cells from the sample with 2×10⁵ Jurkat T cells in 1 mL of buffer. Similar results were obtained with LNCaP cells as shown in Figure 7. The capture efficiency was about 77% when the anti-PSMA mAb-coupled nanobioprobes with concentration of 1.5×10¹⁰ nanobioprobes/mL incubated with 2×10⁵ LNCaP cells/mL for 15 min or longer (Figure 7A), while the capture efficiency kept a constant about 97% when 6.0×10¹⁰ or more nanoparticles incubated with 2×10⁵ LNCaP cells for 15 min in 1 mL of buffer. All the results demonstrated that both types of target cancer cells could be captured with high capture efficiency, which will be helpful for the biomedical research.
Figure 7.
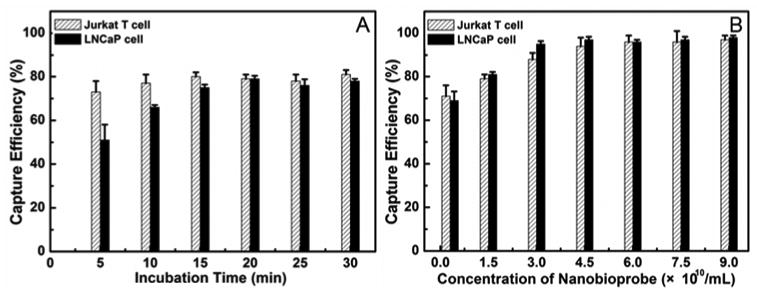
Capture efficiency of mAb-coupled FMBMNs for cell samples (containing 2×10⁵ Jurkat T cells or 2×10⁵ LNCaP cells in 1 mL of reaction buffer) against the incubation time (A) and the concentration of nanobioprobes (B). In Figure 7A, 1.5×10¹⁰ nanobioprobes were used and the incubation time was 15 min in Figure 7B.
Sensitivity and specificity of the mAb-coupled FMBMNs to detect and isolate rare target cancer cells in a mixed sample
During the early stages of cancer development, there are only a few cancer cells within a large number of normal cells in tissues or blood. As early detection of cancer cells is critical for the preventing disease progression and treatment, we were interested in determining if the mAb-coupled nanobioprobes could detect rare cancer cells mixed in a large population of normal cells. First, we prepared several samples by mixing different numbers of stained target cancer cells (Jurkat T or LNCaP) with 106 normal cells (the human lung fibroblasts, MRC-5 cells) and then employed the mAb-coupled nanobioprobes to detect the target cancer cells as described in Materials and Methods. The results in Figure 8(A, B and C) showed that Jurkat T cells were isolated and detected from a mixed sample containing only 102 Jurkat T cells but 106 MRC-5 cells, demonstrating that the anti-CD3 mAb-coupled nanobioprobes could discriminate cancer cells against a background of ten thousand fold normal cells. Similarly, LNCaP cells could be isolated and detected without any normal cell contamination from a sample containing 102 LNCaP cells and 106 MRC-5 cells by using the anti-PSMA mAb-coupled nanobioprobes Figure 8(D, E and F). On the other hand, when the target cell concentration was reduced by 10 fold, i.e., with only 10 target cancer cells (Jurkat T or LNCaP) mixed with 106 MRC-5 cells, there were only nanobioprobes but no cells present after incubating the cells with the nanobioprobes and magnetic isolation (data not shown) Thus, under our experimental conditions, the nanobioprobes could specifically detect and isolate target cells at concentrations as low as 0.01%, suggesting the possibility of such nanobioprobles for clinical applications in early detection of cancer cells.
Figure 8.

Confocal images of Jurkat T cell (A, B, C) and LNCaP cell (D, E, F) isolated from a large population of MRC-5 cells with anti-CD3 mAb-coupled FMBMNs or anti-PSMA mAb-coupled FMBMNs. (A, D: bright field; B, E: fluorescent field; C, F: merge of A and B).
Conclusion
We have previously successfully employed folate or avidin-conjugated FMBMNs to detect and isolate a single kind of target cells (cancer cells and apoptotic cells) from analytical samples.14, 23, 25 Herein, we demonstrated that, by using the mAb-coupled FMBMNs, two different types of tumor cells (leukemia cells and prostate cancer cells) have been successfully detected and extracted from complex samples containing both normal cells and the target cancer cells. The capture efficiencies of the mAb-coupled nanobioprobes for the above mentioned cancer cells were about 96% and 97% respectively under our experimental conditions. We further showed that the mAb-coupled FMBMNs, with the help of a magnet and a fluorescence microscope, could very sensitively detect and isolate target tumor cells at concentrations as low as 0.01% in mixed cell samples within 25 min. To the best of our knowledge, this is the first successful model where the FMBMNs were used for detection and isolation of multiple types of cells. Such a simple, sensitive, efficient, and fast yet low-cost approach offers a potentially very powerful means for detection of multiple cancer cells at early stages.
Experimental Section
Materials
Avidin, biotinylated goat anti-mouse IgG polyclonal antibody (Fc specific), fluorescein isothiocyanate (FITC) labeled goat anti-mouse Fab fragments (Fab specific), FITC labeled goat anti-mouse Fab fragments (Fc specific) and poly-Lysine were purchased from Sigma-Aldrich. Mouse anti-human anti-CD3 monoclonal antibody (mAb), mouse anti-human anti-PSMA monoclonal antibody (mAb), nucleic acid stain SYTO13, Hochest 33342 were obtained from Invitrogen Corp. Jurkat T cells (human peripheral blood leukemia T cell), LNCaP cells (human prostate cancer cell) and MRC-5 cells (human lung fibroblast) were purchased from China Type Culture Collection and human blood samples pretreated with anticoagulant from Renmin Hospital of Wuhan University. All the media used for cell culture were obtained from Gibco Corp. All other chemical reagents were purchased from Shanghai Chemical Reagent Company. Magnetic scaffold (magnetic particle concentrator) was purchased from Promega (USA)
Preparation of avidin-conjugated fluorescent-magnetic multifunctional nanoparticles
The avidin-conjugated fluorescent-magnetic nanoparticles were prepared as described.23 Briefly, core/shell CdSe/ZnS quantum dots (QDs) were first synthesized in organic phase.14 Nano-γ-Fe2O3 particles and hydrazine treated poly(styrene/acrylamide) nanospheres were prepared as previously described.23 A 2-mL suspension of the hydrazine-treated poly(styrene/acrylamide) copolymer nanospheres, CdSe/ZnS QDs (3.0 mg), and nano-γ- Fe2O3 particles (2.0 mg) were mixed and swelled in a chloroform/butanol solvent (5:95 by volume) and then ultrasonicated for 60 min. The mixture was centrifuged for 5 min at 2790g followed by washing for 3 times with butanol to produce the fluorescent-magnetic bifunctional nanoparticles. Then avidin-coupled fluorescent-magnetic multifunctional nanoparticles were obtained by incubating aldehyde-containing avidin (2.8 mg/mL, 240 μL) with fluorescent-magnetic bifunctional nanoparticles (2.4 mL of a 20.0-mg/mL suspension) for 6 h at room temperature in the dark after the mixture diluted to 3.0 mL. The final products were washed 5 times with phosphate buffer saline (PBS, 0.1 mol/L, pH 6.8), and then stored at 4 °C in PBS (0.1 mol/L, pH 6.8).
Preparation of monoclonal antibody (mAb)-coupled FMBMNs
The avidin-conjugated red or yellow (color of luminescence) fluorescent-magnetic bifunctional nanoparticles (20 mg/mL, 200 μL) were first incubated with biotinylated goat anti-mouse Fc specific polyclonal antibody (2 mg/mL, 200 μL) for 30 min at 4 °C, followed by washing with 1×PBS (137 mmol/L NaCl, 2.7 mmol/L KCl, 10 mmol/L Na2HPO4, 1.8 mmol/L KH2PO4, pH 7.4) for three times by centrifuging at 15000g/5min to remove the superfluous non-specific adsorbent antibodies. Then the biotinylated goat anti-mouse antibody coupled red or yellow color fluorescent-magnetic multifunctional nanoparticles were incubated with mouse anti-human anti-CD3 mAb or mouse anti-human anti-PSMA mAb, respectively, for 60 min 4 °C. After washing with 1×PBS for three times by centrifuging at 15000g/5min to remove the superfluous non-specific adsorbent mAbs, the concentration of products was determined as described before. 62 The products were stored at 4 °C before use.
Validating the bioactivity of the mAb-coupled FMBMNs
The bioactivity of the mAb-coupled FMBMNs was detected according to a published procedure.11 Briefly, the mAb-coupled FMBMNs (0.2 mL, with concentration of 10×1010 nanobioprobes/mL in 0.1 mol/L pH 7.2 PBS) were incubated with FITC labeled goat anti-mouse antibody (Fc specific) for 60 min at 4 °C with gentle shaking, followed by washing ten times with PBS to remove the unbound FITC labeled goat anti-mouse antibody. The final products were analyzed using a fluorescence microscope (Nikon Eclipse TE2000-U inverted fluorescence microscope). To eliminate the effect of non-specific absorption, a control experiment was carried out as above except that the mAb-coupled fluorescent-magnetic multifunctional nanoparticles were replaced with biotinylated goat anti-mouse Fc specific polyclonal antibody conjugated fluorescent-magnetic nanoparticles.
Cell culture and dyeing
Jurkat T cells (human peripheral blood leukemia T cell) and MRC-5 cells (human lung fibroblast) were grown in 1640 medium with 10% fetal bovine serum, 100 U/mL penicillin G sodium, and 0.1 mgm/L streptomycin sulfate. LNCaP cells (human prostate cancer cell) were cultured in F12 medium with 10% fetal bovine serum, 100 U/mL penicillin G sodium, and 0.1 mg/mL streptomycin sulfate. Red blood cells (RBCs) were obtained from a healthy volunteer. The cell density was determined using a hemocytometer, prior to any all experiments. After dispersing in cell media buffer and subsequent centrifugation at 1000g/5 min for three times, the cells were finally dispersed in 1 mL of cold 1×PBS. During all experiments, the cells were kept in an ice bath at 4 °C.
Detection and isolation of cancer cells with mAb-coupled FMBMNs
To demonstrate the capabilities of the mAb-coupled FMBMNs for the detection and isolation of cancer cells, Jurkat T cells (2×10⁵) and LNCaP cells (2×10⁵) were used as target cells, and normal Red blood cells (106) were used as control cells. Jurkat T cells stained with nucleic acid dye SYTO13 (with a final concentration of 50 nmol/L) mixed with anti-CD3 mAb-coupled FMBMNs (1.5×10¹⁰ nanobioprobes) were suspended in 1 mL of cold 1×PBS, and then incubated for 15 min. The target cancer cells bound by the mAb-coupled FMBMNs were precipitated with a magnet and then imaged with the aid of a fluorescence microscope. To demonstrate the nanobioprobes' selectivity, we carried out a control experiment as outlined above except that we used LNCaP cells and Red blood cells. Similarly, LNCaP cells were firstly stained with nucleic acid dye Hochest 33342 (with a final concentration of 10 mg/L), and then detected with anti-PSMA mAb-coupled FMBMNs according to the above procedure. To show the nanobioprobes have the ability to isolate the target cancer cells from the complex sample, we mixed the nanobioprobes with an artificial sample containing 2×10⁵ cancer cells and 106 Red blood cells. After magnetic separation, the precipitate and supernatants were imaged under a fluorescence microscope respectively.
Measurement of efficiency of mAb-coupled FMBMNs to capture target cancer cell
Magnetic separation was performed by adding the specified mAb-coupled FMBMNs to each 1 mL of sample (containing 2×10⁵ cancer cells) as described in the above procedures. First, a given concentration of nanobioprobes (1.5×10¹⁰ nanobioprobes/mL) were incubated with the cell samples for 5, 10, 15, 20, 25 and 30 min respectively to investigate the effect of incubation time on capture efficiency. Then a series of different concertration (0.3×10¹⁰, 1.5×10¹⁰, 3×10¹⁰, 4.5×10¹⁰, 6×10¹⁰, 7.5×10¹⁰ and 9×10¹⁰ nanobioprobes/mL) of nanobioprobes were incubated with the cell samples for 15 min respectively. Then, a magnetic field produced by a magnet was introduced to the sample tubes, and after 2 min the target cells were precipitated at the tube wall while the supernatants were collected using a pipet. All the supernatants were put together, diluted with 1.0 mL of buffer and subsequently counted with a hemocytometer. After magnetic separation, the number of each type cells before and after isolation with mAb-coupled nanobioprobes was determined with a hemocytometer to calculate the efficiency of the mAb-coupled nanobioprobes to capture the target cancer cells.
Determining the sensitivity for detecting and isolating rare target cancer cells
A PDMS (Polydimethylsiloxane) chip with a hole 1 cm in diameter was stuck on the surface of a glass slide (Figure S5 in supporting information). After blocking with 1% bovine serum albumin (BSA), cell recognition and isolation experiment was performed in the hole described as follows. First, SYTO 13-stained Jurkat T cells (or Hochest 33342 stained LNCaP cell) were diluted to a certain concentration (at 105, 104, 103 and 102 cells/mL respective). The cells were added to 10 reaction vessel after divided into 10 equal aliquots. Subsequently, the MRC-5 cells (a type of normal cells used here to further confirm the specificity of the mAb-coupled nanobioprobes) were added into the same vessels with a final concentration of 106 cell/mL mixing with the target cancer cells in 1 mL of buffer. Finally, the corresponding nanobioprobes were added into the mixture. After incubation, the cells were isolated with a magnet placed under the glass slide (Figure S5 in supporting information) and washed three times with 1×PBS. After taking away the PDMS chip, the glass slide was directly observed under a confocal microscopy (A spinning-disk confocal microscope (Andor Revolution XD) was equipped with an Olympus IX 81 microscope, a Nipkow disk type confocal unit (CSU 22, Yokogawa), a CO2 on-line culture system (INUBG2-PI) and an EMCCD (Andor iXon DV885K Single Photon Detector))
Supplementary Material
Acknowledgments
This work was supported by the National Key Scientific Program (973)-Nanoscience and Nanotechnology (2006CB933100; 2011CB933600), the Science Fund for Creative Research Groups of NSFC (20621502; 20921062) and the National Natural Science Foundation of China (20833006, 21005064), the Ministry of Public Health (2009ZX10004-107 and 2008ZX10004-004), the Intramural Research Program of NICHD, NIH, USA.
Footnotes
Supporting Information Available: Physical properties of the magnetic-fluorescent bifunctional nanoparticles (Figure S1, S2 and S3). Magnetic separation of the bifunctional nanoparticles (Figure S4). Schematic drawing of the recognition and isolation of rare target cells with mAbs-coupled FMBMNs in a special reaction vessel made with PDMS chip (Figure S5). This material is available free of charge via the internet at http://pubs.acs.org
References and Notes
- 1.Bao J, Chen W, Liu T, Zhu Y, Jin P, Wang L, Liu J, Wei Y, Li Y. Bifunctional Au-Fe3O4 Nanoparticles for Protein Separation. ACS Nano. 2007;1:293–298. doi: 10.1021/nn700189h. [DOI] [PubMed] [Google Scholar]
- 2.Kouassi GK, Wang P, Sreevatan S, Irudayaraj J. Aptamer-Mediated Magnetic and Gold-Coated Magnetic Nanoparticles as Detection Assay for Prion Protein Assessment. Biotechnol Prog. 2007;23:1239–1244. doi: 10.1021/bp0602101. [DOI] [PubMed] [Google Scholar]
- 3.Kouassi GK, Irudayaraj J. Magnetic and Gold-Coated Magnetic Nanoparticles As A DNA Sensor. Anal Chem. 2006;78:3234–3241. doi: 10.1021/ac051621j. [DOI] [PubMed] [Google Scholar]
- 4.Ji XJ, Shao RP, Elliott AM, Stafford RJ, Esparza-Coss E, Bankson JA, Liang G, Luo ZP, Park K, Markert JT, et al. Bifunctional Gold Nanoshells with A Superparamagnetic Iron Oxide-Silica Core Suitable for Both MR Imaging and Photothermal Therapy. J Phys Chem C. 2007;111:6245–6251. doi: 10.1021/jp0702245. [DOI] [PMC free article] [PubMed] [Google Scholar]
- 5.Kim J, Park S, Lee JE, Jin SM, Lee JH, Lee IS, Yang I, Kim JS, Kim SK, Cho MH, et al. Designed Fabrication of Multifunctional Magnetic Gold Nanoshells and Their Application to Magnetic Resonance Imaging and Photothermal Therapy. Angew Chem Int Ed. 2006;45:7754–7758. doi: 10.1002/anie.200602471. [DOI] [PubMed] [Google Scholar]
- 6.Tang D, Yuan R, Chai Y. Magnetic Core-Shell Fe3O4@Ag Nanoparticles Coated Carbon Paste Interface for Studies of Carcinoembryonic Antigen in Clinical Immunoassay. J Phys Chem B. 2006;110:11640–11646. doi: 10.1021/jp060950s. [DOI] [PubMed] [Google Scholar]
- 7.Wang CG, Irudayaraj J. Multifunctional Magnetic-Optical Nanoparticle Probes for Simultaneous Detection, Separation, and Thermal Ablation of Multiple Pathogens. Small. 2010;6:283–289. doi: 10.1002/smll.200901596. [DOI] [PubMed] [Google Scholar]
- 8.Zhou L, Gao C, Xu W. Robust Fe3O4/SiO2-Pt/Au/Pd Magnetic Nanocatalysts with Multifunctional Hyperbranched Polyglycerol Amplifiers. Langmuir. 2010;26:11217–11225. doi: 10.1021/la100556p. [DOI] [PubMed] [Google Scholar]
- 9.Choi JS, Jun YW, Yeon SI, Kim HC, Shin JS, Cheon J. Biocompatible Heterostructured Nanoparticles for Multimodal Biological Detection. J Am Chem Soc. 2006;128:15982–15983. doi: 10.1021/ja066547g. [DOI] [PubMed] [Google Scholar]
- 10.Corr SA, Rakovich YP, Gun'ko YK. Multifunctional Magnetic-Fluorescent Nanocomposites for Biomedical Applications. Nanoscale Res Lett. 2008;3:87–104. [Google Scholar]
- 11.Wang GP, Song EQ, Xie HY, Zhang ZL, Tian ZQ, Zuo C, Pang DW, Wu DC, Shi YB. Biofunctionalization of Fluorescent-Magnetic-Bifunctional Nanospheres and Their Applications. Chem Commun. 2005;34:4276–4278. doi: 10.1039/b508075d. [DOI] [PubMed] [Google Scholar]
- 12.Gu HW, Zheng RK, Zhang XX, Xu B. Facile One-Pot Synthesis of Bifunctional Heterodimers of Nanoparticles: A Conjugate of Quantum Dot and Magnetic Nanoparticles. J Am Chem Soc. 2004;126:5664–5665. doi: 10.1021/ja0496423. [DOI] [PubMed] [Google Scholar]
- 13.Wang DS, He JB, Rosenzweig N, Rosenzweig Z. Superparamagnetic Fe2O3 Beads-CdSe/ZnS Quantum Dots Core-Shell Nanocomposite Particles for Cell Separation. Nano Lett. 2004;4:409–413. [Google Scholar]
- 14.Xie HY, Zuo C, Liu Y, Zhang ZL, Pang DW, Li XL, Gong JP, Dickinson C, Zhou WZ. Cell-Targeting Multifunctional Nanospheres with Both Fluorescence and Magnetism. Small. 2005;1:506–509. doi: 10.1002/smll.200400136. [DOI] [PubMed] [Google Scholar]
- 15.Bertorelle F, Wilhelm C, Roger J, Gazeau F, Menager C, Cabuil V. Fluorescence-Modified Superparamagnetic Nanoparticles: Intracellular Uptake and Use in Cellular Imaging. Langmuir. 2006;22:5385–5391. doi: 10.1021/la052710u. [DOI] [PubMed] [Google Scholar]
- 16.Salgueirino-Maceira V, Correa-Duarte MA, Spasova M, Liz-Marzan LM, Farle M. Composite Silica Spheres with Magnetic and Luminescent Functionalities. Adv Funct Mater. 2006;16:509–514. [Google Scholar]
- 17.Sathe TR, Agrawal A, Nie SM. Mesoporous Silica Beads Embedded with Semiconductor Quantum Dots and Iron Oxide Nanocrystals: Dual-Function Microcarriers for Optical Encoding and Magnetic Separation. Anal Chem. 2006;78:5627–5632. doi: 10.1021/ac0610309. [DOI] [PubMed] [Google Scholar]
- 18.Beaune G, Dubertret B, Clement O, Vayssettes C, Cabuil V, Menager C. Giant Vesicles Containing Magnetic Nanoparticles and Quantum Dots: Feasibility and Tracking by Fiber Confocal Fluorescence Microscopy. Angew Chem Int Ed. 2007;46:5421–5424. doi: 10.1002/anie.200700581. [DOI] [PubMed] [Google Scholar]
- 19.Yong KT, Roy I, Swihart MT, Prasad PN. Multifunctional Nanoparticles As Biocompatible Targeted Probes for Human Cancer Diagnosis and Therapy. J Mater Chem. 2009;19:4655–4672. doi: 10.1039/b817667c. [DOI] [PMC free article] [PubMed] [Google Scholar]
- 20.Lu CW, Hung Y, Hsiao JK, Yao M, Chung TH, Lin YS, Wu SH, Hsu SC, Liu HM, Mou CY, et al. Bifunctional Magnetic Silica Nanoparticles for Highly Efficient Human Stem Cell Labeling. Nano Lett. 2007;7:149–154. doi: 10.1021/nl0624263. [DOI] [PubMed] [Google Scholar]
- 21.Quarta A, Di Corato R, Manna L, Ragusa A, Pellegrino T. Fluorescent-Magnetic Hybrid Nanostructures Preparation, Properties, and Applications in Biology. Ieee Trans Nanobioscience. 2007;6:298–308. doi: 10.1109/tnb.2007.908989. [DOI] [PubMed] [Google Scholar]
- 22.Selvan ST, Patra PK, Ang CY, Ying JY. Synthesis of Silica-Coated Semiconductor and Magnetic Quantum Dots and Their Use in The Imaging of Live Cells. Angew Chem Int Ed. 2007;46:2448–2452. doi: 10.1002/anie.200604245. [DOI] [PubMed] [Google Scholar]
- 23.Song EQ, Wang GP, Xie HY, Zhang ZL, Hu J, Peng J, Wu DC, Shi YB, Pang DW. Visual Recognition and Efficient Isolation of Apoptotic Cells with A Fluorescent-Magnetic-Biotargeting Multifunctional Nanospheres. Clin Chem. 2007;53:2177–2185. doi: 10.1373/clinchem.2007.092023. [DOI] [PubMed] [Google Scholar]
- 24.Wilson R, Spiller DG, Prior IA, Veltkamp KJ, Hutchinson A. A Simple Method for Preparing Spectrally Encoded Magnetic Beads for Multiplexed Detection. Acs Nano. 2007;1:487–493. doi: 10.1021/nn700289m. [DOI] [PubMed] [Google Scholar]
- 25.Xie HY, Xie M, Zhang ZL, Long YM, Liu X, Tang ML, Pang DW, Tan Z, Dickinson C, Zhou W. Wheat Germ Agglutinin-Modified Trifunctional Nanospheres for Cell Recognition. Bioconjugate Chem. 2007;18:1749–1755. doi: 10.1021/bc060387g. [DOI] [PubMed] [Google Scholar]
- 26.Fernandez B, Galvez N, Cuesta R, Hungria AB, Calvino JJ, Dominguez-Vera JM. Quantum Dots Decorated with Magnetic Bionanoparticles. Adv Funct Mater. 2008;18:3931–3935. [Google Scholar]
- 27.Gao JH, Zhang W, Huang PB, Zhang B, Zhang XX, Xu B. Intracellular Spatial Control of Fluorescent Magnetic Nanoparticles. J Am Chem Soc. 2008;130:3710–3711. doi: 10.1021/ja7103125. [DOI] [PubMed] [Google Scholar]
- 28.Insin N, Tracy JB, Lee H, Zimmer JP, Westervelt RM, Bawendi MG. Incorporation of Iron Oxide Nanoplarticles and Quantum Dots into Silica Microspheres. Acs Nano. 2008;2:197–202. doi: 10.1021/nn700344x. [DOI] [PubMed] [Google Scholar]
- 29.Roullier V, Grasset F, Boulmedais F, Artzner F, Cador O, Marchi-Artzner V. Small Bioactivated Magnetic Quantum Dot Micelles. Chem Mater. 2008;20:6657–6665. [Google Scholar]
- 30.Ang CY, Giam L, Chan ZM, Lin AWH, Gu H, Devlin E, Papoefthymiou GC, Selvan ST, Ying JY. Facile Synthesis of Fe2O3 Nanocrystals without Fe(CO)(5) Precursor and One-Pot Synthesis of Highly Fluorescent Fe2O3-CdSe Nanocomposites. Adv Mater. 2009;21:869–873. [Google Scholar]
- 31.Tian ZQ, Zhang ZL, Gao JH, Huang BH, Xie HY, Xie M, Abruna HD, Pang DW. Color-Tunable Fluorescent-Magnetic Core/Shell Multifunctional Nanocrystals. Chem Commun. 2009;27:4025–4027. doi: 10.1039/b906149e. [DOI] [PubMed] [Google Scholar]
- 32.Xie M, Hu J, Long YM, Zhang ZL, Xie HY, Pang DW. Lectin-Modified Trifunctional Nanobiosensors for Mapping Cell Surface Glycoconjugates. Biosens Bioelectron. 2009;24:1311–1317. doi: 10.1016/j.bios.2008.07.058. [DOI] [PubMed] [Google Scholar]
- 33.Sun P, Zhang HY, Liu C, Fang J, Wang M, Chen J, Zhang JP, Mao CB, Xu SK. Preparation and Characterization of Fe3O4/CdTe Magnetic/Fluorescent Nanocomposites and Their Applications in Immuno-Labeling and Fluorescent Imaging of Cancer Cells. Langmuir. 2010;26:1278–1284. doi: 10.1021/la9024553. [DOI] [PMC free article] [PubMed] [Google Scholar]
- 34.Cho HS, Dong Z, Pauletti GM, Zhang J, Xu H, Gu H, Wang L, Ewing RC, Huth C, Wang F, et al. Fluorescent, Superparamagnetic Nanospheres for Drug Storage, Targeting, and Imaging: A Multifunctional Nanocarrier System for Cancer Diagnosis and Treatment. ACS Nano. 2010;4:5398–5404. doi: 10.1021/nn101000e. [DOI] [PubMed] [Google Scholar]
- 35.Kurec AS, Cruz VE, Barrett D, Mason DY, Davey FR. Immunophenotyping of Acute Leukemias Using Paraffin-Embedded Tissue Sections. Am J Clin Pathol. 1990;93:502–509. doi: 10.1093/ajcp/93.4.502. [DOI] [PubMed] [Google Scholar]
- 36.Perkins SL, Kjeldsberg CR. Immunophenotyping of Lymphomas and Leukemias in Paraffin-Embedded Tissues. Am J Clin Pathol. 1993;99:362–373. doi: 10.1093/ajcp/99.4.362. [DOI] [PubMed] [Google Scholar]
- 37.Paredes-Aguilera R, Romero-Guzman L, Lopez-Santiago N, Burbano-Ceron L, Camacho-Del Monte O, Nieto-Martinez S. Flow Cytometric Analysis of Cell-Surface and Intracellular Antigens in The Diagnosis of Acute Leukemia. Am J Hematol. 2001;68:69–74. doi: 10.1002/ajh.1155. [DOI] [PubMed] [Google Scholar]
- 38.Jennings CD, Foon KA. Recent Advances in Flow Cytometry: Application to The Diagnosis of Hematologic Malignancy. Blood. 1997;90:2863–2892. [PubMed] [Google Scholar]
- 39.Dunphy CH, Orton SO, Mantell J. Relative Contributions of Enzyme Cytochemistry and Flow Cytometric Immunophenotyping to The Evaluation of Acute Myeloid Leukemias With A Monocytic Component and of Flow Cytometric Immunophenotyping to The Evaluation of Absolute Monocytoses. Am J Clin Pathol. 2004;122:865–874. doi: 10.1309/BH58-8HVG-6UHN-2RF2. [DOI] [PubMed] [Google Scholar]
- 40.Xu Y, Phillips JA, Yan JL, Li QG, Fan ZH, Tan WH. Aptamer-Based Microfluidic Device for Enrichment, Sorting, and Detection of Multiple Cancer Cells. Anal Chem. 2009;81:7436–7442. doi: 10.1021/ac9012072. [DOI] [PMC free article] [PubMed] [Google Scholar]
- 41.Belov L, de la Vega O, dos Remedios CG, Mulligan SP, Christopherson RI. Immunophenotyping of Leukemias Using A Cluster of Differentiation Antibody Microarray. Cancer Res. 2001;61:4483–4489. [PubMed] [Google Scholar]
- 42.Day PJ. Miniaturized PCR Systems for Cancer Diagnosis. Biochem Soc Trans. 2009;37:424–426. doi: 10.1042/BST0370424. [DOI] [PubMed] [Google Scholar]
- 43.Neves AF, Araujo TG, Biase WK, Meola J, Alcantara TM, Freitas DG, Goulart LR. Combined Analysis of Multiple mRNA Markers by RT-PCR Assay for Prostate Cancer Diagnosis. Clin Biochem. 2008;41:1191–1198. doi: 10.1016/j.clinbiochem.2008.06.013. [DOI] [PubMed] [Google Scholar]
- 44.Beillard E, Pallisgaard N, van der Velden VH, Bi W, Dee R, van der Schoot E, Delabesse E, Macintyre E, Gottardi E, Saglio G, et al. Evaluation of Candidate Control Genes for Diagnosis and Residual Disease Detection in Leukemic Patients Using ‘Real-Time’ Quantitative Reverse-Transcriptase Polymerase Chain Reaction (RQ-PCR) - A Europe Against Cancer Program. Leukemia. 2003;17:2474–2486. doi: 10.1038/sj.leu.2403136. [DOI] [PubMed] [Google Scholar]
- 45.Faderl S, Kantarjian HM, Talpaz M, Estrov Z. Clinical Significance of Cytogenetic Abnormalities in Adult Acute Lymphoblastic Leukemia. Blood. 1998;91:3995–4019. [PubMed] [Google Scholar]
- 46.Fan YS, Rizkalla K. Comprehensive Cytogenetic Analysis Including Multicolor Spectral Karyotyping and Interphase Fluorescence In Situ Hybridization in Lymphoma Diagnosis: A Summary of 154 Cases. Cancer Genet Cytogenet. 2003;143:73–79. doi: 10.1016/s0165-4608(02)00843-9. [DOI] [PubMed] [Google Scholar]
- 47.Barbas AS, White RR. The Development and Testing of Aptamers for Cancer. Curr Opin Investig Drugs. 2009;10:572–578. [PubMed] [Google Scholar]
- 48.Tang ZW, Shangguan D, Wang KM, Shi H, Sefah K, Mallikratchy P, Chen HW, Li Y, Tan WH. Selection of Aptamers for Molecular Recognition and Characterization of Cancer Cells. Anal Chem. 2007;79:4900–4907. doi: 10.1021/ac070189y. [DOI] [PubMed] [Google Scholar]
- 49.Imbeault M, Lodge R, Ouellet M, Tremblay MJ. Efficient Magnetic Bead-Based Separation of HIV-1-Infected Cells Using An Improved Reporter Virus System Reveals That p53 up-Regulation Occurs Exclusively in The Virus-Expressing Cell Population. Virology. 2009;393:160–167. doi: 10.1016/j.virol.2009.07.009. [DOI] [PubMed] [Google Scholar]
- 50.Medina F, Segundo C, Salcedo I, Garcia-Poley A, Brieva JA. Purification of Human Lamina Propria Plasma Cells by An Immunomagnetic Selection Method. J Immunol Methods. 2004;285:129–135. doi: 10.1016/j.jim.2003.11.006. [DOI] [PubMed] [Google Scholar]
- 51.Herr JK, Smith JE, Medley CD, Shangguan DH, Tan WH. Aptamer-Conjugated Nanoparticles for Selective Collection and Detection of Cancer Cells. Anal Chem. 2006;78:2918–2924. doi: 10.1021/ac052015r. [DOI] [PubMed] [Google Scholar]
- 52.Yoshino T, Hirabe H, Takahashi M, Kuhara M, Takeyama H, Matsunaga T. Magnetic Cell Separation Using Nano-Sized Bacterial Magnetic Particles with Reconstructed Magnetosome Membrane. Biotechnol Bioeng. 2008;101:470–477. doi: 10.1002/bit.21912. [DOI] [PubMed] [Google Scholar]
- 53.Yu C, Zhao J, Guo Y, Lu C, Ma X, Gu Z. A Novel Method to Prepare Water-Dispersible Magnetic Nanoparticles and Their Biomedical Applications: Magnetic Capture Probe and Specific Cellular Uptake. J Biomed Mater Res A. 2008;87:364–372. doi: 10.1002/jbm.a.31786. [DOI] [PubMed] [Google Scholar]
- 54.Quarta A, Di Corato R, Manna L, Argentiere S, Cingolani R, Barbarella G, Pellegrino T. Multifunctional Nanostructures Based on Inorganic Nanoparticles and Oligothiophenes and Their Exploitation for Cellular Studies. J Am Chem Soc. 2008;130:10545–10555. doi: 10.1021/ja800102v. [DOI] [PubMed] [Google Scholar]
- 55.Di Corato R, Piacenza P, Musaro M, Buonsanti R, Cozzoli PD, Zambianchi M, Barbarella G, Cingolani R, Manna L, Pellegrino T. Magnetic-Fluorescent Colloidal Nanobeads: Preparation and Exploitation in Cell Separation Experiments. Macromol Biosci. 2009;9:952–958. doi: 10.1002/mabi.200900154. [DOI] [PubMed] [Google Scholar]
- 56.Smith JE, Medley CD, Tang ZW, Shangguan D, Lofton C, Tan WH. Aptamer-Conjugated Nanoparticles for The Collection and Detection of Multiple Cancer Cells. Anal Chem. 2007;79:3075–3082. doi: 10.1021/ac062151b. [DOI] [PubMed] [Google Scholar]
- 57.Furdui VI, Harrison DJ. Immunomagnetic T Cell Capture from Blood for PCR Analysis Using Microfluidic Systems. Lab Chip. 2004;4:614–618. doi: 10.1039/b409366f. [DOI] [PubMed] [Google Scholar]
- 58.Takahashi M, Yoshino T, Takeyama H, Matsunaga T. Direct Magnetic Separation of Immune Cells from Whole Blood Using Bacterial Magnetic Particles Displaying Protein G. Biotechnol Prog. 2009;25:219–226. doi: 10.1002/btpr.101. [DOI] [PubMed] [Google Scholar]
- 59.Gao X, Cui Y, Levenson RM, Chung LW, Nie S. In Vivo Cancer Targeting and Imaging with Semiconductor Quantum Dots. Nat Biotechnol. 2004;22:969–976. doi: 10.1038/nbt994. [DOI] [PubMed] [Google Scholar]
- 60.Schulke N, Varlamova OA, Donovan GP, Ma DS, Gardner JP, Morrissey DM, Arrigale RR, Zhan CC, Chodera AJ, Surowitz KG, et al. The Homodimer of Prostate-Specific Membrane Antigen Is A Functional Target for Cancer Therapy. Proc Natl Acad Sci USA. 2003;100:12590–12595. doi: 10.1073/pnas.1735443100. [DOI] [PMC free article] [PubMed] [Google Scholar]
- 61.Wang W, Singh S, Zeng DL, King K, Nema S. Antibody Structure, Instability, and Formulation. J Pharm Sci. 2007;96:1–26. doi: 10.1002/jps.20727. [DOI] [PubMed] [Google Scholar]
- 62.Reynolds F, O'Loughlin T, Weissleder R, Josephson L. Method of Determining Nanoparticle Core Weight. Anal Chem. 2005;87:814–817. doi: 10.1021/ac049307x. [DOI] [PubMed] [Google Scholar]
Associated Data
This section collects any data citations, data availability statements, or supplementary materials included in this article.