

Abstract
Quorum sensing via an N–acyl homoserine lactone (HSL) pheromone controls the biosynthesis of a carbapenem antibiotic in Erwinia carotovora. Transcription of the carbapenem biosynthetic genes is dependent on the LuxR-type activator protein, CarR. Equilibrium binding of a range of HSL molecules, which are thought to activate CarR to bind to its DNA target sequence, was examined using fluorescence quenching, DNA bandshift analysis, limited proteolysis and reporter gene assays. CarR bound the most physiologically relevant ligand, N–(3–oxohexanoyl)-L–homoserine lactone, with a stoichiometry of two molecules of ligand per dimer of protein and a dissociation constant of 1.8 μM, in good agreement with the concentration of HSL required to activate carbapenem production in vivo. In the presence of HSL, CarR formed a very high molecular weight complex with its target DNA, indicating that the ligand causes the protein to multimerize. Chemical cross-linking analysis supported this interpretation. Our data show that the ability of a given HSL to facilitate CarR binding to its target DNA sequence is directly proportional to the affinity of the HSL for the protein.
Keywords: carbapenem/Erwinia carotovora/N-acyl homoserine lactone/quorum sensing
Introduction
In the last decade, it has become increasingly clear that a plethora of physiological processes, including virulence, secondary metabolism and bioluminescence, are activated in response to changes in the cell density of a bacterial population (for a recent review, see Fuqua et al., 1996). This phenomenon is known as quorum sensing and involves intercellular communication via N-acyl homoserine lactones (HSLs). These signalling molecules are synthesized in the cytoplasm by enzymes homologous to the LuxI protein from the bioluminescent bacterium Vibrio fischeri (reviewed by Meighen, 1991). However, the newly synthesized HSLs are believed to diffuse readily across the cell envelope into the growth medium, where they accumulate. This accumulation continues until the cell density (and, therefore, the HSL concentration) exceeds a critical value, whereupon specific physiological changes occur. Most models suggest that HSLs cause these changes by binding to intracellular receptor proteins, thereby activating these proteins to elicit the desired cellular response. The putative receptor proteins, of which LuxR from V.fischeri was the first to be identified, are almost exclusively transcriptional activators that turn on the expression of target genes in the presence of HSL (Fuqua et al., 1996). In this way, a bacterial population can achieve highly concerted expression of a defined set of genes using a diffusible pheromone as a signal of population density status.
A widely accepted model by which LuxR-type proteins are thought to activate gene expression is that ligand binding to the N-terminal domain of the protein causes a conformational change, which leads to exposure of the DNA-binding domain at the C–terminus of the protein (Da Re et al., 1994). A recent variation on this mechanism is that the binding of HSL causes the protein to dimerize or form some other higher order assemblage competent to bind DNA (Zhu and Winans, 1999). However, although these hypotheses are experimentally tractable, very little biochemical work has been carried out to test them. Most notably, although the central theme of both mechanisms is that the LuxR homologue binds HSLs, this interaction has yet to be quantitated experimentally. Indeed, all attempts at measuring HSL binding to LuxR homologues have been either (i) indirect, assaying the ability of HSLs to activate reporter gene expression in vivo (Eberhard et al., 1986; Zhu et al., 1998) or the ability of HSL analogues to inhibit the binding of radiolabelled autoinducer to Escherichia coli cells expressing luxR (Schaefer et al., 1996); or (ii) qualitative, assaying the ability of a fixed concentration of HSL to cause a DNA bandshift in the presence of a LuxR homologue (Zhu and Winans, 1999). Without a more quantitative understanding of the binding of HSLs to LuxR homologues, it will be impossible to address questions about molecular recognition issues affecting specificity in quorum-sensing systems, or the precise mechanism of action of LuxR-type proteins.
Quorum-sensing systems have been identified in a wide range of bacterial genera, particularly in a variety of plant and animal pathogens. One interpretation of the logic underlying a quorum-sensing system strategy in virulence is that the bacteria use it to mount a sustained attack on the host only when their numbers are high enough to ensure that they have a reasonable chance of success. A well characterized example of this is found in the Gram–negative phytopathogen, Erwinia carotovora subsp. carotovora (Pérombelon and Kelman, 1980; Jones et al., 1993; Pirhonen et al., 1993). The bacterium kills its host by producing an arsenal of cell wall-degrading exoenzymes in a cell density-dependent fashion (Andro et al., 1984; Collmer and Keen, 1986; Kotoujansky, 1987). Some strains of E.carotovora also manufacture a broad spectrum β–lactam antibiotic (1–carbapen-2–em-3–carboxylic acid, carbapenem; Bainton et al., 1992; Holden et al., 1998) in concert with virulence factor elaboration, presumably to suppress the growth of competing opportunistic bacteria in the nutritional windfall released at the site of infection. In quorum sensing-mediated control of carbapenem production, the LuxI homologue, CarI, is responsible for synthesizing N–(3–oxohexanoyl)-l–homoserine lactone (3–oxo-C6–HSL) (Bainton et al., 1992; Jones et al., 1993; Swift et al., 1993). The 3–oxo-C6–HSL synthesized by CarI is thought to bind to a LuxR homologue, CarR, which then activates transcription of the car genes (McGowan et al., 1995, 1996). carR is located ∼150 bp upstream of the car biosynthetic cluster (carA–H) but is not part of the same transcriptional unit. Several lines of genetic evidence indicate that the intergenic region between carR and carA contains the CarR-binding site (McGowan et al., 1995, 1996), although this is not defined. Given that the transcriptional activator, CarR, and the pheromone, C6ox-HSL, are thought to be interacting receptor and ligand, respectively, we initiated a study to quantitate the binding of various HSLs to CarR, and to monitor the effect that these ligands have on the binding of CarR to the carR–carA intergenic region.
Results
Purification of His6-tagged CarR
The carR gene product from wild-type E.carotovora subsp. carotovora (strain ATTn10) was His6 tagged by insertion into the expression vector pQE31. The resulting construct (pcarR31) was then modified by insertion of a kanamycin cassette into the bla gene of the vector, yielding pcarR31Kn. (This was done in order to abolish the encoded ampicillin resistance, which would otherwise interfere with the assay for carbapenem.) To examine whether the His6-tagged protein was functional, we tested whether pcarR31Kn could restore carbapenem production to a carR mutant (GB3). We found that pcarR31Kn was able to restore carbapenem production in this mutant to wild-type levels, indicating that incorporation of the additional residues (MRGSHHHHHHTDPIEGR) at the N-terminus of the protein did not affect its biological activity (data not shown).
When expressed in E.coli at 37°C, His6-CarR partitioned between the insoluble (inclusion bodies) and soluble fractions. The His6-CarR in the soluble fraction constituted ∼20% of the total recombinant protein. We attempted to increase the proportion of soluble protein by (i) growing the cells at a lower temperature (30°C) and (ii) expressing His6-CarR in the presence of CarI in the hope that the HSL molecules produced by the latter might stabilize a more soluble conformation of the protein. Neither method was effective. An alternative approach was to purify His6-CarR from the insoluble fraction. This was done by solubilizing the inclusion bodies in guanidinium hydrochloride. The denatured protein was then purified (by Ni–NTA chromatography) and refolded by rapid dilution into a buffer without denaturant. The properties of the refolded protein were indistinguishable from those of His6-CarR isolated from the soluble fraction of the cells.
When His6-CarR was renatured, solutions of the protein remained clear for a few minutes, but then gradually turned cloudy as a precipitate formed. The relatively slow formation of this precipitate, which was not reduced visibly by inclusion of 3–oxo-C6–HSL in the renaturation buffer, suggested that it consisted of aggregated native protein. We conclude that CarR has an intrinsic tendency to aggregate. In line with this, neither refolded His6-CarR nor His6-CarR from the soluble fraction of the cells could be concentrated to more than ∼5 μM without inducing precipitation. Presumably, this explains why all of our attempts to increase the amount of soluble protein failed.
Biochemical properties of His6-CarR
Solutions of His6-CarR were too dilute to characterize by standard hydrodynamic methods, e.g. gel filtration chromatography. We therefore used chemical cross-linking to determine the multimeric status of the protein. The cross-linking mixture used for most experiments was 1–ethyl-3-(3–dimethylaminopropyl)carbodiimide (EDC) in the presence of N–hydroxysuccinimide (NHS) (Blat and Eisenbach, 1996), although glutaraldehyde gave the same results. In the absence of cross-linker, His6-CarR migrated on SDS–PAGE with an apparent molecular mass of 30 kDa (Figure 1), which is the same as the molecular mass predicted from the sequence (29 949 Da). However, in the presence of EDC/NHS, a pair of diffuse bands migrating with apparent mol. wts of 58 and 62 kDa appeared, along with a small amount of very high molecular weight material. The 58 and 62 kDa bands correspond to dimeric His6-CarR. The dimer migrates as two bands due to the presence of intramolecular cross-links within one or both protomers, which alter their mobilities. Control experiments (not shown) indicate that these intramolecular cross-links form very readily, and block intermolecular cross–linking, which is why only a relatively small fraction of the total protein appeared as dimers and high molecular weight material. In the presence of 3–oxo-C6–HSL, the 62 kDa band became better defined, although the total amount of dimer was almost unchanged. However, even low concentrations of 3–oxo-C6–HSL significantly increased the amount of high molecular weight cross-linked products. Taken together, these data indicate that His6-CarR exists as a preformed dimer, and that the main effect of 3–oxo-C6–HSL binding is to increase the tendency of these dimers to form multimers.
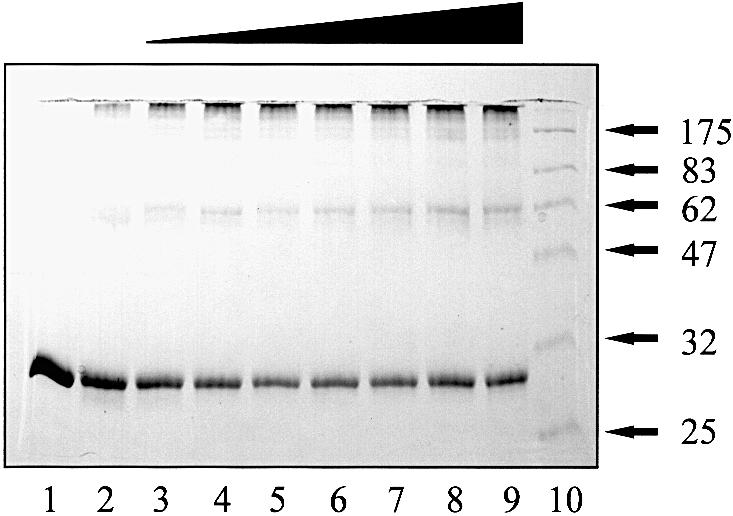
Fig. 1. Chemical cross-linking of CarR. Reaction mixtures contained His6-CarR (1.37 μM dimer), EDC (5 mM), NHS (10 mM) and 3–oxo-C6–HSL. After 30 min incubation, the reactions were stopped and the samples were resolved on a 10–20% polyacrylamide–SDS gradient gel. Lane 1: no cross-linker. The concentrations of HSL in the remaining reactions were: 0 μM (lane 2), 1 μM (lane 3), 5 μM (lane 4), 10 μM (lane 5), 20 μM (lane 6), 50 μM (lane 7), 100 μM (lane 8) and 200 μM (lane 9). Lane 10: molecular weight markers (in kDa).
To examine further how 3–oxo-C6–HSL affects the properties of His6-CarR, we performed a limited tryptic digestion on the protein in the absence and presence of HSL. The results were striking. In the absence of the HSL, His6-CarR was digested extensively by the protease after just 50 min (Figure 2A). However, in the presence of 3–oxo-C6–HSL (47 μM), His6-CarR was much more resistant to digestion with substantial amounts of the protein, remaining essentially intact even after 200 min of digestion. [The major (∼28 kDa) band present in trypsin-treated His6-CarR corresponds to the intact protein cleaved at the factor Xa site.] We conclude that HSL binding to His6-CarR alters the accessibility of scissile bonds to tryptic cleavage. Interestingly, although the rate of proteolysis was affected by the presence of the HSL, the overall pattern of digestion was not. This suggests that the HSL does not cause a major conformational change in the protein (thereby exposing new tryptic cleavage sites). Instead, and in line with the cross-linking data above, HSL binding to His6-CarR probably leads to a change in the aggregation state of the protein. It is likely that this change in aggregation state accounts for the altered kinetics of trypsinolysis. Addition of pSMG101 (which carries the CarR-binding site) to the reaction mixtures had no effect on the rate or extent of trypsinolysis (data not shown).

Fig. 2. Limited trypsinolysis of His6-CarR. (A) Time course of limited trypsinolysis. Reaction mixtures containing His6-CarR (1.5 μM dimer) with or without 3–oxo-C6–HSL (47 μM) were incubated for the indicated periods of time with trypsin (0.3 μg/ml) and then resolved on a 12–22% polyacrylamide–SDS gradient gel. The positions of the molecular weight markers (in kDa) are shown. The contents of each lane and the reaction times (in min) are as indicated. (B) Effect of different HSLs on the extent of trypsinolysis. Reaction mixtures contained His6-CarR (2.25 μM dimer), unsubstituted HSL (25 μM) and trypsin (3 μg/ml). The acyl chain length of the HSL used in each reaction and the positions of selected molecular weight markers are indicated. In the lane labelled ‘N’, no HSL was present.
The result above prompted us to test whether other HSLs might also protect His6-CarR from digestion by trypsin. We therefore performed a limited trypsinolysis over a 5 h period in the presence of a homologous series of unsubstituted HSLs (all 25 μM concentration), each with an acyl chain containing a different number of carbon atoms (from C4 to C11). The result is shown in Figure 2B. A clear decrease in tryptic sensitivity is observed with those HSLs carrying acyl chains of seven, eight and nine carbon atoms. We conclude that these HSLs bind to His6-CarR better than the others we tested. In line with this, when the same experiment was carried out using a homologous series of 3–oxo-substituted HSLs, optimum protection from trypsin was afforded by 3–oxo-C8–HSL (data not shown).
Ligand binding by His6-CarR
CarR contains three tryptophan residues, W20, W44 and W72 (Holden et al., 1998). Of these residues, W44 and W72 are highly conserved in most LuxR homologues. All three tryptophan residues are located in the N-terminal one-third of the molecule, which in the case of LuxR is thought to contain the HSL-binding domain (Shadel et al., 1990; Slock et al., 1990; Hanzelka and Greenberg, 1995). Since tryptophan is strongly fluorescent, and since one or more of these tryptophan residues might be located close to the ligand-binding site (or be perturbed in some way by ligand binding), we used the intrinsic tryptophan fluorescence of CarR as a probe to monitor HSL binding.
HSLs were titrated against His6-CarR and the fluorescence emission spectra were recorded after each addition. The addition of HSLs caused significant fluorescence quenching (by up to 50%) without any change in λmax (335 nm; data not shown). The extent of quenching produced by each HSL was dependent on its concentration and its structure (Figure 3). The pattern of quenching fell into three distinct groups. The first group incorporated those HSLs carrying unsubstituted aliphatic carbon chains. These HSLs caused <10% quenching at any of the concentrations tested, irrespective of the chain length. Of the remaining HSLs, all of which carried a 3–oxo substitution in the hydrocarbon chain, one group (composed of 3–oxo-C8–HSL and 3–oxo-C6–HSL) strongly quenched the fluorescence of the protein at approximately stoichiometric quantities, while the second group (composed of 3–oxo-C4–HSL, 3–oxo-C10–HSL and 3–oxo-C12–HSL) caused significant quenching only when added in excess quantities. The simplest interpretation of these data is that the affinity of the HSLs for CarR follows the order 3–oxo-C8–HSL>3–oxo-C6–HSL>[3–oxo-C4–HSL, 3–oxo-C10– HSL, 3–oxo-C12–HSL]>unsubstituted.

Fig. 3. HSL binding by His6-CarR. HSLs were titrated against His6-CarR (0.8 μM dimer) and the extent of fluorescence quenching was measured. For clarity, linefits are only drawn for selected HSLs. Key: 3–oxo-C4–HSL (▴), 3–oxo-C6–HSL (•), 3–oxo-C8–HSL (▪), 3–oxo-C10–HSL (♦), 3–oxo-C12–HSL (⊙), C4–HSL (▵), C6–HSL (○), C8–HSL (□), C10–HSL (⋄) and C12–HSL (+).
Ligand-dependent transcription of carA in vivo
To measure the effect of the different HSLs on the transcription of carA in vivo, we monitored β–galactosidase production by a carI mutant (GB7I) containing a lacZ transcriptional fusion in carA. The activity of the reporter gene product was assayed through the growth curve. None of the HSLs affected the growth rate of the cells and, for those ligands that induced significant β–galactosidase activity, induction was almost immediate (data not shown). In these cases, the level of induction rose and then levelled off during the stationary phase, and no peaks of β–galactosidase activity were observed. In view of this, we decided that the most informative way of plotting the data was as the cumulative reporter gene activity measured through the growth curve for each HSL (Figure 4). For the non-substituted HSLs, only C6–HSL and C7–HSL induced significant activity. In the case of the 3–oxo-substituted ligands, the overall potency of the HSLs was 1–2 orders of magnitude greater than that of the non-substituted analogues. Furthermore, although the optimal β–galactosidase activity was centred on 3–oxo-C6–HSL, both 3–oxo-C8–HSL and, to a much lesser extent, 3–oxo-C4–HSL also induced a substantial response.

Fig. 4. HSL-dependent carA transcription in vivo. Cumulative β–galactosidase activity [expressed as the sum of the ΔA420/min/ml (OD unit) measurements made for each HSL through the growth curve] of GB7I in the presence of the HSLs indicated (all 1 μg/ml concentration). (○) 3–oxo-substituted HSLs; (•) unsubstituted HSLs. For comparison, the cumulative β–galactosidase activity in the absence of HSL was 0.587 units.
HSL binding to His6-CarR changes its interaction with DNA
Using gel mobility shifts as an assay, we examined whether there was any correlation between the binding of HSL to His6-CarR and the binding of the protein to its target DNA. The target DNA used was a 370 bp HindIII fragment encompassing the entire carR–carA intergenic region (hereafter termed the IGR) or, as a control, a 340 bp DraI fragment of vector DNA. In each reaction, the concentration of labelled DNA used was ∼3 nM, which is approximately the concentration of a single regulatory DNA element in the cell.
First, we measured whether His6-CarR had any intrinsic affinity for the IGR in the absence of HSL (Figure 5A). At low His6-CarR concentrations, a well defined band representing the minimal His6-CarR–DNA complex appeared just above the free DNA band. This slightly retarded species apparently acts as a scaffold onto which further His6-CarR molecules bind, because at higher His6-CarR concentrations it was gradually replaced by a band showing an increasingly greater degree of gel retardation. [The observation that His6-CarR forms a minimal protein–DNA complex in the absence of HSL supports our earlier suggestion (cf. Figure 1) that CarR exists as a preformed dimer. This is because the CarR-binding site in the IGR is likely to be a region of dyad symmetry (McGowan et al., 1995). Such dyads usually bind dimeric proteins, with each protomer in the dimer binding separate arms of the dyad.]

Fig. 5. The binding of His6-CarR to the carR–carA intergenic region. (A) Binding of His6-CarR to the IGR in the absence of HSL. Gel retardation assays were performed as described in Materials and methods. Each reaction contained 3 nM DNA. The concentration of dimeric His6-CarR in the reactions was: 0 nM (lane 1), 31 nM (lane 2), 62 nM (lane 3), 93 nM (lane 4), 125 nM (lane 5), 187 nM (lane 6), 312 nM (lane 7), 437 nM (lane 8) and 624 nM (lane 9). (B) Binding of His6-CarR to the IGR in the presence of 3–oxo-C6–HSL. Each reaction contained 3 nM DNA. Lane 1: no His6-CarR. The remaining lanes all contained 345 nM dimeric His6-CarR and the following 3–oxo-C6–HSL concentrations: 0 μM (lane 2), 0.46 μM (lane 3), 1.1 μM (lane 4), 1.8 μM (lane 5), 4.6 μM (lane 6), 7.3 μM (lane 7), 18.3 μM (lane 8) and 73.3 μM (lane 9). Lane 10 contained 73.3 μM 3–oxo-C6–HSL and a 66 bp unlabelled synthetic oligo- nucleotide (2 μM) spanning a region of inverse and direct repeats in the IGR. The sequence of the central (54 bp) portion of this oligo is shown (the remaining 12 bp of the oligo that are not shown constitute BamHI and HindIII restriction sites at each end of the molecule).
Next, we titrated 3-oxo-C6-HSL against a fixed concentration of DNA and His6-CarR (Figure 5B). At the concentration of His6-CarR we chose to use (∼0.35 μM dimer), in the absence of 3–oxo-C6–HSL, most of the DNA was sequestered into the minimal protein–DNA complex (Figure 5B, lane 2). However, as the 3–oxo-C6–HSL concentration increased, the intensity of this band diminished and a very highly retarded species that only just entered the gel appeared (Figure 5B, lanes 3–9). The formation of this highly retarded species was abolished in the presence of an unlabelled synthetic 66 bp oligonucleotide (Figure 5B, lane 10) encompassing a region of the IGR containing dyad symmetry (McGowan et al., 1995). In control experiments, His6-CarR did not bind to the labelled 340 bp fragment of DraI vector DNA (data not shown). Based on these results, we estimate that the apparent Kd of 3–oxo-C6–HSL binding to His6-CarR is ∼1.8 μM. For comparison, when the same titration was carried out with 3–oxo-C8–HSL, the apparent Kd for binding was ∼0.5 μM (data not shown). From the low mobility of the protein–DNA complex formed in the presence of 3–oxo-C6–HSL, we conclude that it has a very high molecular weight.
The effect of varying the acyl chain length of the HSLs on the binding of His6-CarR to the IGR was measured. As shown in Figure 6, in the presence of a fixed concentration of each ligand (25 μM), HSL with acyl chains containing 5–9 carbon atoms caused a significant gel shift, with the peak of activity being centred on C7–HSL and C8–HSL. However, in all cases, only a relatively small amount of the total DNA probe formed a ternary complex with the protein and the ligand. This suggests that although these ligands bind to His6-CarR, they do so with a much lower affinity than 3–oxo-C6–HSL. [We verified that this conclusion holds over a range of ligand concentrations by titrating selected unsubstituted HSLs against His6-CarR and monitoring the resulting gel shifts (data not shown).]
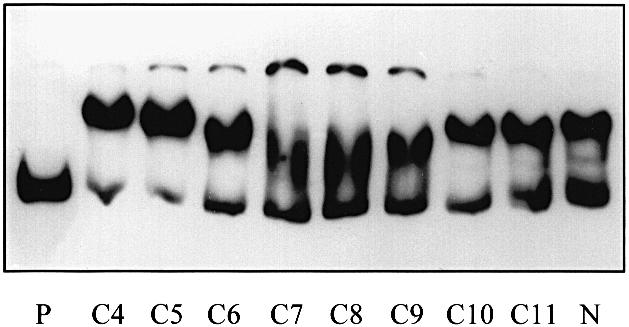
Fig. 6. The effect of HSL acyl chain length on the binding of His6-CarR to DNA. Each reaction contained 3 nM DNA. Except for the lanes labelled ‘P’ (probe DNA alone) and ‘N’ (probe DNA and His6-CarR in the absence of HSL), the remaining lanes each contained 187 nM dimeric His6-CarR and 25 μM of the HSL indicated.
Ligand binding to a soluble fragment of His6-CarR
To investigate further the binding of HSLs to CarR, we expressed and purified a highly soluble portion of the protein (His6-CarR1–167; numbering based on untagged CarR) encompassing the ligand-binding domain. Those HSLs carrying a 3–oxo substituent on the acyl chain caused quenching of the fluorescence of His6-CarR1–167. However, whereas HSLs carrying unsubstituted acyl chains caused minor quenching of the fluorescence of the full-length protein, in the case of His6-CarR1–167 these HSLs enhanced its fluorescence. Although the extent of this enhancement was maximally only ∼30% of the total signal, the relative signal could be increased using quench-enhanced fluorescence (QEF). This approach is based upon the suppression of bulk protein fluorescence intensity using an extrinsic quencher (acrylamide) that does not affect the magnitude of the ligand-induced enhancement of fluorescence. Results from the two types of titrations performed (monitoring QEF in the case of the unsubstituted HSLs and intrinsic tryptophan quenching in the case of the 3–oxo-HSLs) are shown in Figure 7A and B, respectively. As in the case of the intact protein, the pattern of fluorescence quenching by the 3-oxo-substituted HSLs followed the order 3–oxo–C8>3–oxo–C6>[3–oxo–C4, 3–oxo–C10, 3–oxo–C12]. For the non-substituted HSLs, the pattern of fluorescence enhancement followed the order C8>C7>[C6, C9]>[C4, C5, C10]. The C11 and C12 unsubstituted HSLs did not significantly affect the fluorescence of the protein at any concentration tested.

Fig. 7. The binding of different HSLs to His6-CarR1–167. (A) Binding of unsubstituted HSLs to His6-CarR1–167 measured by quench-enhanced fluorescence. The concentration of dimeric His6-CarR1–167 was 4.4 μM. Key: C4–HSL (▵), C5–HSL (\), C6–HSL (○), C7–HSL (⊙), C8–HSL (□), C9–HSL (\), C10–HSL (⋄), C11–HSL (⊞) and C12–HSL (+). For clarity, solid lines have only been fitted through selected titrations. (B) Binding of 3–oxo-substituted HSLs to His6-CarR1–167 measured by fluorescence quenching. The concentration of dimeric His6-CarR1–167 was 2.2 μM. Key: 3–oxo-C4–HSL (▴), 3–oxo-C6–HSL (•), 3–oxo-C8–HSL (▪), 3–oxo-C10–HSL (♦) and 3–oxo-C12–HSL (⊞).
Figure 8 summarizes the combined data for HSL binding to full-length His6-CarR and His6-CarR1–167. In the figure, the relative affinities are defined as the ligand concentrations required to yield the half-maximal change in fluorescence in Figures 3 and 7. The data clearly show three things. First, the ligand-binding spectrum of full-length His6-CarR is the same as that of His6-CarR1–167, indicating that the soluble fragment of CarR has the same binding specificity as the full-length protein. Secondly, the presence of a 3–oxo group on the ligand increases its affinity for CarR by at least an order of magnitude. Thirdly, and in line with the results in Figures 2B and 6, there is an optimum acyl chain length for binding of 7–8 carbon atoms.

Fig. 8. The optimal chain length for HSL binding to His6-CarR. The apparent Kd values of the HSL–His6-CarR and HSL–His6-CarR1–167 complexes are plotted against the number of carbon atoms in the acyl chain of each ligand. (⋄) Binding of 3–oxo-substituted HSLs to His6-CarR; (•) binding of 3–oxo-substituted HSLs to His6-CarR1–167; (○) binding of unsubstituted HSLs to His6-CarR1–167.
Quantitative analysis of 3–oxo-C6–HSL binding to His6-CarR1–167
An intrinsic limitation of fluorescence titrations is that they do not readily yield to quantitative analysis. This is because the only information available to the experimenter is a signal for each of the ligand concentrations tested, i.e. the ‘free’ and ‘bound’ concentrations of the ligand are not known. However, these parameters can be calculated if specific binding models are applied (Hu and Eftink, 1993). Given that the protein is dimeric, we applied the following model:

where A represents dimeric CarR, L represents the ligand, AL1 and AL2 represent the singly and doubly liganded forms of the protein, respectively, and K1 and K2 are the dissociation constants describing the steps indicated. The raw binding data were hyperbolic, so the binding sites were assumed to be non-interacting. However, some flexibility was built into the model by allowing species AL1 and AL2 to have different fluorescence values (F1 and F2, respectively). In order to get the best fit of the model to the data, we performed an extended titration of 3–oxo-C6–HSL against a fixed amount of His6-CarR1–167 (Figure 9). Fitting was carried out as described in Materials and methods. The best fit of the data to a single binding site model, i.e. where K2 was much greater than K1, deviated significantly from the data over the whole range of HSL concentrations, and was clearly not applicable. However, a good fit to the data was found when the binding parameters were K1 = K2 = 1.8 μM and F1 = F2 = ΔFmax. This suggests that the dimeric protein contains two identical binding sites, and that binding of ligand to either site completely quenches the fluorescence of the protein. It is interesting to note that the apparent Kd of ligand binding measured here is identical to that estimated from the gel shift assays above. This shows that DNA does not alter the affinity of the protein for the ligand.

Fig. 9. Titration of 3–oxo-C6–HSL against His6-CarR1–167. 3–oxo-C6–HSL was titrated against 4.51 μM dimeric His6-CarR1–167 and the extent of fluorescence quenching was measured. The linefit to the data was calculated as described in the text. Inset: titration of His6-CarR against 3–oxo-C6–HSL. His6-CarR1–167 was titrated against a fixed concentration (4.7 μM) of 3–oxo-C6–HSL and the extent of fluorescence quenching caused by each addition of protein was measured.
The deviation of the data points in Figure 9 from the calculated curve at high 3–oxo-C6–HSL concentrations (>10 μM) is puzzling. One likely possibility is that this reflects the onset of interactions between individual ligand molecules, leading to the formation of HSL dimers or higher order assemblages (e.g. micelles). The net effect of these additional equilibria would be to reduce the concentration of ‘free’ ligand available for binding to the protein, thereby offsetting the data points from the ideal curve.
To verify the stoichiometry of the interaction, we titrated His6-CarR1–167 against a fixed amount (4.7 μM) of 3–oxo-C6–HSL, and monitored the extent of fluorescence quenching of the protein (Figure 9, inset). When fully bound, 4.7 μM ligand quenched the fluorescence of the protein by 55 units. Thus, to achieve 99 units of fluorescence quenching (as observed in Figure 9) would require 99/55 × 4.7 μM, or 8.5 μM of bound ligand. Given that the concentration of His6-CarR1–167 monomer in Figure 9 was 9.0 μM, these data indicate that the stoichiometry of the reaction is 8.5 μM:9.0 μM, i.e. ∼1 mol of ligand bound per mole of His6-CarR1–167 monomer.
In addition to the above titrations, we also examined whether two synthetic compounds, (l)2–amino-4–butyrolactone (ABL) and hexanoamide (HA), affected the fluorescence of His6-CarR1–167. ABL is identical to the lactone moiety on all of the compounds tested in the titrations above, while HA is identical to the acyl moiety on C6-HSL. Neither compound, either alone or in combination, had any effect on the fluorescence of His6-CarR1–167, nor did they affect the binding of 3–oxo-C6–HSL to the protein (data not shown). Thus, both the lactone ring and acyl chain moieties of the physiological HSLs must be present within a single molecule in order for binding to His6-CarR to occur.
Discussion
In this study, we have demonstrated equilibrium HSL binding to a member of the LuxR superfamily, thereby proving unequivocally that these proteins are HSL receptors. His6-CarR, which appears to exist as a preformed dimer in solution, bound 3–oxo-C6–HSL in the stoichiometry 2 mol of ligand per mole of His6-CarR dimer. Interestingly, and unexpectedly for a ‘molecular switch’, no cooperativity was observed in ligand binding. The Kd of 3–oxo-C6–HSL binding to His6-CarR measured by fluorimetry (1.8 μM) was identical to the Kd measured in gel retardation assays, indicating that DNA does not alter the affinity of CarR for the ligand. Thus, binding of 3–oxo-C6–HSL to His6-CarR quantitatively converts the protein into its activated form. This conclusion applies to all types of HSL, since the extent of CarR activation (based on gel retardation assays) is proportional to the affinity of the ligand for the protein.
While this manuscript was in preparation, Zhu and Winans (1999) presented a study of another LuxR homologue: the Agrobacterium tumefaciens transcriptional regulator, TraR. This protein differs from CarR in that it binds its cognate autoinducer (3–oxo-C8–HSL) with such a high affinity that the ligand co-purifies with the protein and is impossible to remove completely, even after extended dialysis. In spite of this, TraR and CarR appear to be similar in two key respects. First, autoinducer binding to both proteins stabilizes them against proteolytic degradation. Secondly, although Zhu and Winans (1999) were unable to measure the Kd of the TraR–3–oxo-C8–HSL complex, they used quantitative amino acid analysis to estimate the stoichiometry of the complex as 1 mol of ligand per mole of TraR monomer, i.e. identical to the stoichiometry estimated for equilibrium binding of 3–oxo-C6–HSL to CarR.
Luo and Farrand (1999) have shown recently that HSL-dependent DNA binding by TraR (rather than some downstream effect) leads to transcriptional activation. In light of this, how might CarR binding to the IGR activate transcription of the car gene cluster? Given that CarR has an intrinsic tendency to multimerize, and that 3–oxo-C6–HSL promotes this, it is reasonable to suppose that multimerization is involved in transcriptional activation. Indeed, the intrinsic tendency of CarR to self-associate probably explains why even slight overexpression of the protein leads to HSL-independent carbapenem production (McGowan et al., 1995). This suggests that in wild-type cells, CarR levels must be finely poised to prevent such inappropriate activation. In line with this, the transcription of carR is controlled by autoregulation (S.J.McGowan, G.Bosgelmez, A.M.L.Barnard, M.Sebaihia, D.E.Todd, L.E.Porter, N.R.Thomson, B.W.Bycroft and G.P.C.Salmond, submitted), indicating that biosynthesis of the protein is under very tight control. Our results also suggest that proteolytic degradation may play a role in regulating the turnover of CarR, as is the case for TraR (Zhu and Winans, 1999). The reduced susceptibility of CarR to proteolytic degradation in the presence of bound HSL may reflect the formation of protease-resistant CarR multimers. The precise mechanism by which multimeric CarR binding to the IGR activates transcription of the car gene cluster is currently under investigation.
As anticipated, the HSL-binding profile of CarR showed a strong dependency on the structural features of the ligand. For example, the presence of a 3–oxo group increased the affinity of HSLs for CarR by about one order of magnitude relative to the non-substituted homologues. However, the major specificity determinant appears to be the length of the acyl chain. This suggests that the binding pocket of CarR is tailored to fit molecules of a certain size. Surprisingly, in all of our in vitro assays, the optimum acyl chain length for HSL binding (7–8 carbon atoms) was consistently larger than the optimum of 6–7 carbon atoms determined in vivo. Why should this be? In the case of the most physiologically relevant HSL, 3–oxo-C6–HSL, the measured Kd (1.8 μM) falls exactly within the window of concentrations required to facilitate carbapenem production in the cell (Bainton et al., 1992). In view of this, it seems likely that, in vivo, some mechanism(s) exists to suppress the binding of other HSLs to CarR (as opposed to enhancing the binding of 3–oxo-C6–HSL). How might the cell accomplish this? One possibility is that the cytoplasm contains a specificity factor, which either re-shapes the ligand-binding pocket of CarR so that it only fits 3–oxo-C6–HSL, or, alternatively, delivers the HSL to the active site of the protein. Speculatively, the biological function of such a selectivity filter would be to prevent inappropriate cross-talk between co-habiting bacterial species producing different HSLs. However, since other HSLs do compete for binding to CarR in vivo (N.Whitehead, unpublished observations), we feel that this explanation is not likely. A second possibility is that inappropriate HSLs may be sequestered (e.g. in the lipid bilayer), selectively destroyed, chemically modified or stereochemically inverted, so that CarR only ever encounters l–3–oxo-C6–HSL. Lastly, inappropriate HSLs may be effluxed selectively so that their cellular concentration is kept low. In line with this, there is some evidence that an autoinducer efflux system is active in Pseudomonas (Pearson et al., 1999).
Which, if any, of the above ‘selectivity’ mechanisms operate in vivo is not known. However, the simplest possibility (HSL sequestration into membranes, micelles or other hydrophobic aggregates) can account nicely for the different specificity profiles in vivo and in vitro. (Such micelle formation may also explain the deviation of the data in Figure 9 from the calculated binding isotherm at HSL concentrations >10 μM.) For example, if we assume that membrane partitioning or micelle formation is proportional to the hydrophobicity of each HSL, then the longer the acyl chain of the ligand, the greater the extent of partitioning, and the lower its free (aqueous phase) concentration. To examine this further, we calculated the effect that such a reduction in free HSL concentration might have on the ligand-binding profile of CarR (Figure 10). For the 3–oxo-substituted HSLs (Figure 10A) in the absence of partitioning, the peak of activity was centred on the 3–oxo-C8–HSL (data from Figure 8). However, when partitioning was taken into account, the peak of activity was depressed by ∼25% and shifted to 3–oxo-C6–HSL, in line with the results in Figure 4. A similar change in the specificity profile (from C8–HSL to C7–HSL) and extent of activation was obtained when the calculation was performed for the non-substituted HSLs (Figure 10B). Thus, partitioning not only shifts the apparent specificity profile, but also affects the magnitude of activation. We next examined the effect of overexpression of CarR on HSL binding. As shown in Figure 10B, 10–fold overexpression elevated the amount of bound HSL by about the same amount. Assuming that productive binding of any HSL to the protein leads to activation (as enunciated in the current study), this result may explain why overexpression of TraR was reported to broaden its specificity profile in vivo (Zhu et al., 1998). Another prediction of these results is that generally the Kds characterizing the binding of HSLs to LuxR homologues should decrease sharply as the acyl chain length of their cognate HSLs increases. This is because the available (i.e. non-sequestered) concentration of HSL decreases exponentially with increasing acyl chain length. This possibility may explain some earlier observations made on Pseudomonas aeruginosa. Here, the organism uses two different LuxI homologues to synthesize 3–oxo-C12–HSL and C4–HSL, respectively. However, the concentration of 3–oxo-C12–HSL required to activate its cognate receptor protein, LasR, is only ∼3 nM (Pearson et al., 1994), while the concentration of C4–HSL required to activate its cognate receptor (RhlR) is some 350–fold higher at ∼1 μM (Pearson et al., 1995). This example also serves to illustrate another point highlighted in the current study; if separate quorum-sensing systems are to be used by an organism, in order to reduce the possibility of cross-talk the HSLs employed in each system should be as different as possible from one another.

Fig. 10. Effect of HSL partitioning on the ligand-binding profile of CarR. (A) The binding of 3–oxo-substituted HSLs to CarR. The concentration of bound HSL was calculated using the constraints described in Materials and methods. The [CarR] was set at 0.1 μM. (○) Bound HSL in the absence of partitioning; (•) bound HSL in the presence of partitioning. (B) The binding of unsubstituted HSLs to CarR. (○) HSL bound to 0.1 μM CarR in the absence of partitioning; (•) HSL bound to 0.1 μM CarR in the presence of partitioning; (▪) HSL bound to 1 μM CarR in the presence of partitioning.
To conclude, this is the first study to demonstrate equilibrium HSL binding to a LuxR homologue directly. Although the major approach (quenching of intrinsic tryptophan fluorescence) that we used to quantitate binding may not be applicable to all naturally occurring LuxR homologues, our results suggest that site-directed incorporation of tryptophan residues may enable this method to be applied more widely (provided that it can be demonstrated independently that such mutations do not change HSL binding per se).
Materials and methods
DNA manipulations
Wild-type E.carotovora subsp. carotovora carR was amplified by colony PCR from the chromosomal DNA of strain ATTn10 (Table II) using primers 1 and 2 (Table I). The primers incorporated a BamHI site at the 5′ end and an EcoRI site at the 3′ end of the insert. Primer 1 was also designed to incorporate a factor Xa cleavage site at the N–terminus of the final polypeptide product. After digestion of the PCR product with BamHI and EcoRI, the insert was gel purified and ligated to pBluescriptSK+. A BamHI–HindIII fragment containing carR was excised from this plasmid and ligated to pQE31 (Qiagen). This vector incorporated a His6 tag at the 5′ end of the insert. The resulting plasmid (pcarR31) was used to transform E.coli strain DH5α. The veracity of the plasmid insert was established by sequencing. For complementation studies, a kanamycin resistance cassette was first inserted into the XmnI site of pcarR31 to disrupt the bla gene (which would otherwise interfere with the assay for carbapenem production). The resulting plasmid, pcarR31Kn, was transferred to GB3 (an ATTn10 derivative containing a lacZ transcriptional fusion in the carR gene) by electrotransformation.
Table II. Bacterial strains, plasmids and phage used in the current study.
| Strain | Genotype or description | Source or reference |
|---|---|---|
| Escherichia coli | ||
| DH5α | endA1 hsdR17 supE44 thi-1 recA1 gyrA96 relA1 ΔlacU169 (Φ80dlacΔM15) | laboratory stock |
| Erwinia carotovora | ||
| ATTn10 | ATCC 39048::Tn10 restrictionless (Tn10 cured Tcs) | McGowan et al. (1996) |
| GB3 | GS101, carR::lacZ | Thomson et al. (1997) |
| JMJ7 | GS101, carI::TnblaM | McGowan et al. (1995) |
| GB7 | GS101, carA::lacZ | Thomson et al. (1997) |
| GB7I | GB7, carI::TnblaM | this work |
| Plasmids | ||
| pBluescriptSK+ | Multi-copy cloning vector, Apr | Stratagene |
| pQE31 | His6-tagging vector, Apr | Qiagen |
| pcarR31 | pQE31 containing the coding region of carR | this work |
| pcarR31Kn | pcarR31 harbouring a kan insertion in the bla gene | this work |
| pSMG101 | pACYC184 derivative containing the carR–carA intergenic region | this work |
| Phage | ||
| ΦKP | E.carotovora generalized transducing phage | Toth et al. (1993) |
Table I. Primers used in the current study.
| 1 | GCGGATCCCATCGAAGGTCGTGATC |
| 2 | GCGAATTCCTAACGGGCGTCCAT |
| 3 | CCCGGATCCCGTGATCATGAAATCCATTCC |
| 4 | CCCAAGCTTTCTTGAATTATCGGGGGG |
The pcarR31 plasmid was used as a PCR template from which to amplify gene fragments encoding portions of the CarR protein. CarR1–167 was amplified using primers 3 and 4. The resulting fragment was cut with BamHI–HindIII and ligated to pQE30 in order to His6 tag the encoded polypeptide fragment.
To examine the effect of different HSLs on the expression of carA in vivo, the generalized transducing phage, ΦKP (Toth et al., 1993), was used to transfer a non-functional carI gene (insertionally inactivated by TnblaM) from strain JMJ7 (McGowan et al., 1995) into a Lac– derivative of ATTn10, denoted GB7. This strain carries a TnphoA′–2 insertion in the carA gene, creating a carA–lacZ transcriptional fusion (Thomson et al., 1997). The β–galactosidase activity of the resulting strain, GB7I, was assayed through the growth curve in the presence of different HSLs (all at 1 μg/ml) as previously described (Miller, 1972). This yielded an activity profile through the growth curve for each HSL. The cumulative β–galactosidase activity was calculated as the total area under each activity profile obtained in this way.
Purification of soluble His6-CarR and isolation of inclusion bodies
A 20 ml culture of DH5α containing pcarR31 was grown overnight at 37°C in LB medium containing 50 μg/ml ampicillin. This culture was used to inoculate 2 l of the same medium, pre-equilibrated at 37°C, which was grown with vigorous aeration for 3.5 h. At this time, isopropyl-β-d–thiogalactopyranoside (IPTG) was added to a final concentration of 1 mM, and the culture was grown for a further 3 h. The cells were then harvested by centrifugation at 4°C. The cell pellet was resuspended in 50 ml of ice-cold buffer A (0.1 M Tris–HCl pH 8.0, 0.3 M NaCl, 30 mM imidazole, 10 mM 2–mercaptoethanol) containing an EDTA-free protease inhibitor cocktail tablet (Boehringer Mannheim) and sonicated to completion on ice. The sonicated sample was centrifuged at 9000 r.p.m. (4°C, Sorvall SS–23 rotor) for 15 min to separate the inclusion bodies from the soluble fraction. The soluble fraction was re-centrifuged immediately at 24 000 r.p.m. (4°C, SW28 rotor) for 60 min to pellet lipidic material and other cell debris. The clarified supernatant was loaded at 1 ml/min onto a 2 ml column of Ni–NTA resin (Qiagen) pre-equilibrated with buffer A at 4°C, and the column was washed at the same flow rate with ∼300 ml of equilibration buffer. The buffer was then changed to buffer B (0.1 M Tris–HCl pH 8.0, 0.1 M NaCl) for 2–3 column volumes. The bound protein was eluted by resuspending the column matrix in a small amount of buffer B to form a slurry that was then diluted rapidly into ∼20 ml of buffer B containing 0.3 M imidazole pH 8.0. The eluted protein was dialysed overnight against 500 ml of buffer B and stored at 4°C until use.
His6-CarR1–167 was purified using the same procedure as for full-length soluble His6-CarR, except that these proteins were eluted directly from the column using buffer B supplemented with 0.3 M imidazole.
Preparation of renatured CarR from inclusion bodies
His6-CarR inclusion bodies were resuspended into ∼2 ml of buffer A and sonicated to form a homogenous suspension. This suspension was then diluted into ∼50 ml of buffer A containing 6 M guanidinium hydrochloride, and the sample was stirred at room temperature for 30 min. The sample was then centrifuged (9000 r.p.m., Sorvall SS–23 rotor, 4°C) for 15 min to remove insoluble matter and loaded at 1 ml/min onto a 2 ml column of Ni–NTA–Sepharose at 25°C. The column was washed with 300 ml of buffer A containing 6 M urea followed by 10 ml of buffer B containing 6 M urea. The bound protein was eluted in the same buffer supplemented with 0.3 M imidazole. To refold the eluted protein, 4 ml of the denatured sample was diluted rapidly into 40 ml of ice-cold stirred buffer B. The sample was left stirring for 30 min, during which time a precipitate formed. The precipitate was removed by centrifugation (9000 r.p.m., Sorvall SS–23 rotor, 4°C) for 15 min, and the supernatant was poured off. The soluble protein was dialysed overnight against 2 l of buffer B containing 1 mM dithiothreitol (DTT) and clarified by centrifugation before use.
Fluorescence spectra and titrations
Fluorescence titrations were performed using a Shimadzu RF-5001-PC spectrofluorimeter in a thermostatted 2 ml quartz cuvette at 25°C. The excitation wavelength was 295 nm and the excitation and emission slits were 1.5 and 5 nm, respectively. For the titrations, additives were not allowed to exceed 1.5% of the total volume of the solution. Unless otherwise stated, all titrations were carried out in buffer B. Stock solutions of the HSLs were dissolved in acetonitrile. For the titration in Figure 9, the raw data were corrected for inner filter effects arising from the low level of light absorption by the ligand (ɛ295 was measured to be 74.6 M–1cm–1). This correction was performed by multiplying the fluorescence signal by a correction factor C:
C = 10ΔA295/(2 + ΔA340/2)
When QEF titrations were carried out on His6-CarR1–167, acrylamide was present at a final concentration of 0.25 M.
For the results in Figure 9 (inset), His6-CarR1–167 was titrated against a fixed concentration of C6ox-HSL as follows. First, the fluorescence of an aliquot of His6-CarR1–167 was measured. Then, 3–oxo-C6–HSL was added to the cuvette to a concentration of 4.69 μM and the fluorescence was recorded again. The extent of fluorescence quenching was taken as the difference between these two values. The cuvette was then emptied and washed, and the experiment was repeated using a different concentration of His6-CarR1–167. The final volume in the cuvette was 2 ml for all the concentrations of His6-CarR1–167 tested.
Analysis of 3-oxo-C6-HSL binding data
Binding was assumed to proceed by the following mechanism:

By definition, the dissociation constants K1 and K2 are related to [AL] and [AL2] by
[AL] =[L][A]K1 and [AL2] =[L]2[A]K1K2 (1 and 2)
Similarly, the total protein concentration, A0, is related to [AL] and [AL2] by
A0 = [A] + [AL] + [AL2] (3)
which, after substitution by Equations 1 and 2, rearranges to
A0[A] = 1 + [L]/K1 + [L]2/K1K2
Species AL1 was assumed to have a fluorescence of F1, and species AL2 a fluorescence of F2, with the observed fluorescence quenching (F) being a function of these values and the fractional occupation of each site, i.e.
F =[AL]F1A0 + [AL2]F2A0 = [L][A]F1K1A0 + [L]2[A]F2K1K2A0
After re-arranging and substituting Equation 3 for A0/[A], we get
[L]F1K1 + [L]2F2K1K2 = F(1 + [L]/K1 + [L]2/K1K2)
The resulting quadratic in [L] was solved, and the two solutions were used to calculate [A] by substitution into Equation 3. These values of [A] and [L] were used to calculate L0 (in terms of F, F1, F2, K1 and K2) by substitution in Equation 4
L0 = [L] +[L][A]K1 + 2[L]2[A]K1K2 (4)
(this expression was derived from the fact that L0 = [L] + [AL] + 2[AL2]). Next, we minimized the sum-of-squares difference between L0 (real) and L0 (calculated) using the solver function in Microsoft Excel to yield the values of F1, F2, K1 and K2 that best described the variation in observed fluorescence (F) with the concentration of added ligand (L0).
DNA bandshift assays
Plasmid pSMG101 (containing the carR–carA IGR) was made by linearizing pSMG24 (McGowan et al., 1997) through partial digestion with MscI. The resulting mixture was then digested with SmaI. One of the products of this digestion, a 3275 bp fragment, was re-ligated to yield pSMG101. A 370 bp fragment containing the carR–carA IGR was excised from pSMG101 using HindIII. A 340 bp control fragment comprised of vector DNA was excised from the same plasmid using DraI. Both DNA fragments were digoxigenin labelled using terminal transferase and DIG-11-ddUTP according to the manufacturer's instructions (Boehringer Mannheim). DNA bandshift reactions (20 μl volume) contained the indicated amounts of protein, DNA and HSL, and were carried out in 20 mM HEPES pH 7.5, 150 mM KCl, 500 μg/ml bovine serum albumin, 1 mM DTT, 1 mM EDTA and 10% (v/v) glycerol. Routinely, the reactions were allowed to proceed for 60 min at 30°C before loading onto 6% polyacrylamide gels pre-equilibrated in 0.5× TBE buffer (45 mM Tris–HCl pH 8.2, 45 mM boric acid and 1.25 mM EDTA) at 4°C. The gels were run at ∼5 V/cm until the tracking dye was about three-quarters of the way down, and then blotted onto nylon membranes. The blots were developed using anti-DIG antibodies coupled to alkaline phosphatase.
Chemical cross-linking
Chemical cross-linking was performed using EDC in the presence of NHS, which catalyses the reaction. Reaction mixtures contained His6-CarR (800 μl of a 2.8 μM solution of His6-CarR monomer in 0.1 M Tris–HCl pH 7.9 plus 0.1 M NaCl), 5 mM EDC, 10 mM NHS and 3–oxo-C6–HSL (0–200 μM). The final volume was adjusted to 1 ml with water. The reaction mixtures were incubated at 30°C for 30 min, at which point 100 μl of 1 M glycine pH 7.5 were added. After a further 30 min, the reactions were stopped by the addition of 300 μl of ice-cold 50% (w/v) trichloroacetic acid (TCA) and put on ice for 60 min. The precipitated protein was recovered by centrifugation (15 000 g for 10 min) and washed in ice-cold acetone to remove residual TCA. The protein pellets were air-dried and then dissolved in 50 μl of SDS sample buffer prior to electrophoresis through 10–20% polyacrylamide gradient gels. The gels were stained with Coomassie Brilliant Blue.
Limited proteolysis
For the time course experiment, reaction mixtures contained His6-CarR (3 μM monomer), 3–oxo-C6–HSL (47 μM) or an equivalent volume of water, and trypsin (0.3 μg) in a final volume of 1000 μl. The reaction mixtures were incubated at 25°C for the indicated periods of time. To test the trypsin sensitivity of His6-CarR in the presence of different HSLs, reactions contained His6-CarR (4.5 μM monomer), HSL (25 μM) and trypsin (1.5 μg) in a final volume of 500 μl. The reactions were allowed to proceed for 5 h at 30°C. In both cases, the reactions were stopped by the addition of TCA to a final concentration of 10% (w/v). Following this, the samples were treated as described above for chemical cross-linking.
Calculating the effect of HSL partitioning on the CarR ligand-binding profile.
The apparent Kds determined in the current study were used to calculate the concentration of bound HSL in the absence and presence of partitioning. Partitioning was assumed to be proportional to the critical micellar concentration (CMC) of the ligands. The total [CarR] was set at 0.1 μM (or, where indicated, 1 μM) and the total [HSL] was set at 5 μM, which is approximately equal to the maximum physiological concentration of 3–oxo-C6–HSL achieved in closed culture (Holden et al., 1998). In the absence of partitioning, the calculation of bound HSL was straightforward. In the presence of partitioning, when the CMC was ⩽5 μM, the available (i.e. monomeric) [HSL] was re-set to be equal to the CMC. Based on the data in Figure 9, the onset of interactions among 3–oxo-C6–HSL molecules begins when their concentration exceeds 10 μM, so we set this as being the CMC for this species. The CMCs for the remaining HSL species were calculated by assuming that the CMC decreases by a factor of 10 for every two carbon atoms added to the acyl chain (Tanford, 1973). The CMCs for a given chain length of 3–oxo-substituted and unsubstituted HSLs were set to be the same.
Acknowledgments
Acknowledgements
We particularly thank Dr S.R.Chhabra for generous supply of N-acyl homoserine lactones. Dr G.Smith is thanked for his invaluable help in extracting quantitative infomation from the fluorescence data. This study was funded by generous support from the BBSRC, UK. D.E.T. and N.A.W. were funded by BBSRC studentships awarded to G.P.C.S.
References
- Andro T., Chambost, J.P., Kotoujansky, A., Cattaneo, J., Bertheau, Y., Barras, F., van Gijsegem, F. and Coleno, A. (1984) Mutants of Erwinia chrysanthemi defective in secretion of pectinase and cellulase. J. Bacteriol., 160, 1199–1203. [DOI] [PMC free article] [PubMed] [Google Scholar]
- Bainton N.J., Stead,P., Chhabra,S.R., Bycroft,B.W., Salmond,G.P.C., Stewart,G.S.A.B. and Williams,P. (1992) N-(3-oxohexanoyl)-l-homoserine lactone regulates carbapenem antibiotic production in Erwinia carotovora. Biochem. J., 288, 997–1004. [DOI] [PMC free article] [PubMed] [Google Scholar]
- Blat Y. and Eisenbach, M. (1996) Oligomerization of the phosphatase CheZ upon interaction with the phosphorylated form of CheY, the signal molecule of bacterial chemotaxis. J. Biol. Chem., 271, 1226–1231. [DOI] [PubMed] [Google Scholar]
- Collmer A. and Keen, N.T. (1986) The role of pectic enzymes in plant pathogenesis. Annu. Rev. Phytopathol., 24, 383–409. [Google Scholar]
- Cox A.R.J., Thomson, N.R., Bycroft, B., Stewart, G.S.A.B., Williams, P. and Salmond, G.P.C. (1998) A pheromone-independent CarR protein controls carbapenem antibiotic synthesis in the opportunistic human pathogen Serratia marcescens.Microbiology, 144, 201–209. [DOI] [PubMed] [Google Scholar]
- Da Re S., Bertagnoli, S., Fourment, J., Reyrat, J.-M. and Kahn, D. (1994) Intramolecular signal transduction within the FixJ transcriptional activator: in vitro evidence for the inhibitory effect of the phosphorylatable regulatory domain. Nucleic Acids Res., 22, 1555–1561. [DOI] [PMC free article] [PubMed] [Google Scholar]
- Eberhard A., Widrig, C.A., McBath, P. and Schineller, J. (1986) Analogs of the autoinducer of bioluminescence in Vibrio fischeri.Arch. Microbiol., 146, 35–40. [DOI] [PubMed] [Google Scholar]
- Fuqua C., Winans, S.C. and Greenberg, E.P. (1996) Census and consensus in bacterial ecosystems: the LuxR–LuxI family of quorum-sensing transcriptional regulators. Annu. Rev. Microbiol., 50, 727–751. [DOI] [PubMed] [Google Scholar]
- Hanzelka B.L. and Greenberg, E.P. (1995) Evidence that the N-terminal region of the Vibrio fischeri LuxR protein constitutes an autoinducer binding domain. J. Bacteriol., 177, 815–817. [DOI] [PMC free article] [PubMed] [Google Scholar]
- Holden M.T.G., McGowan, S.J., Bycroft, B.W., Stewart, G.S.A.B., Williams, P. and Salmond, G.P.C. (1998) Cryptic carbapenem antiobiotic production genes are widespread in Erwinia carotovora: facile trans activation by the carR transcriptional regulator. Microbiology, 144, 1495–1508. [DOI] [PubMed] [Google Scholar]
- Hu D. and Eftink, M. (1993) Interaction of indoleacrylic acid with Trp aporepressor from Escherichia coli.Arch. Biochem. Biophys., 305, 588–594. [DOI] [PubMed] [Google Scholar]
- Jones S., et al. (1993)The lux autoinducer regulates the production of exoenzyme virulence determinants in Erwinia carotovora and Pseudomonas aeruginosa.EMBO J., 12, 2477–2482. [DOI] [PMC free article] [PubMed] [Google Scholar]
- Kotoujansky A. (1987) Molecular genetics of pathogenesis by soft-rot Erwinias.Annu. Rev. Phytopathol., 25, 405–430. [Google Scholar]
- Luo Z.-Q. and Farrand, S.K. (1999) Signal-dependent DNA-binding and functional domains of the quorum-sensing activator TraR as identified by repressor activity. Proc. Natl Acad. Sci. USA, 96, 9009–9014. [DOI] [PMC free article] [PubMed] [Google Scholar]
- McGowan S., et al. (1995)Carbapenem antibiotic production in Erwinia carotovora is regulated by CarR, a homologue of the LuxR transcriptional activator. Microbiology, 141, 541–550. [DOI] [PubMed] [Google Scholar]
- McGowan S.J., Sebaihia, M., Porter, L.E., Stewart, G.S.A.B., Williams, P., Bycroft, B.W. and Salmond, G.P.C. (1996) Analysis of bacterial carbapenem antibiotic production genes reveals a novel β-lactam biosynthesis pathway. Mol. Microbiol., 22, 415–426. [DOI] [PubMed] [Google Scholar]
- McGowan S.J., Sebaihia, M., O'Leary, S., Hardie, K.R., Williams, P., Stewart, G.S.A.B., Bycroft, B. and Salmond, G.P.C. (1997) Analysis of the carbapenem gene cluster of Erwinia carotovora: definition of the antibiotic biosynthetic genes and evidence for a novel β-lactam resistance mechanism. Mol. Microbiol., 26, 545–556. [DOI] [PubMed] [Google Scholar]
- Meighen E.A. (1991) Molecular biology of bacterial luminescence. Microbiol. Rev., 55, 123–142. [DOI] [PMC free article] [PubMed] [Google Scholar]
- Miller J.H. (1972) Experiments in Molecular Genetics. Cold Spring Harbor Laboratory Press, Cold Spring Harbor, NY. [Google Scholar]
- Pearson J.P., Gray, K.M., Passador, L., Tucker, K.D., Eberhard, A., Iglewski, B.H. and Greenberg, E.P. (1994) Structure of the autoinducer required for the expression of Pseudomonas aeruginosa virulence genes. Proc. Natl Acad. Sci. USA, 91, 197–201. [DOI] [PMC free article] [PubMed] [Google Scholar]
- Pearson J.P., Passador, L., Iglewski, B.H. and Greenberg, E.P. (1995) A second N-acyl-homoserine lactone produced by Pseudomonas aeruginosa.Proc. Natl Acad. Sci. USA, 92, 1490–1494. [DOI] [PMC free article] [PubMed] [Google Scholar]
- Pearson J.P., Van Delden, C. and Iglewski, B.H. (1999) Active efflux and diffusion are involved in transport of Pseudomonas aeruginosa cell-to-cell signals. J. Bacteriol., 181, 1203–1210. [DOI] [PMC free article] [PubMed] [Google Scholar]
- Pérombelon M.C. and Kelman, A. (1980) Ecology of the soft rot Erwinias.Annu. Rev. Phytopathol., 18, 361–387. [Google Scholar]
- Pirhonen M., Flego,D., Heikinheimo,R. and Palva,E.T. (1993) A small diffusible signal molecule is responsible for the global control of virulence and exoenzyme production in the plant pathogen Erwinia carotovora. EMBO J., 12, 2467–2476. [DOI] [PMC free article] [PubMed] [Google Scholar]
- Schaefer A.L., Hanzelka, B.L., Eberhard, A. and Greenberg, E.P. (1996) Quorum sensing in Vibrio fischeri: probing autoinducer–LuxR interactions with autoinducer analogs. J. Bacteriol., 178, 2897–2901. [DOI] [PMC free article] [PubMed] [Google Scholar]
- Shadel G.S., Young, R. and Baldwin, T.O. (1990) Use of regulated cell lysis in a lethal genetic selection in Escherichia coli: identification of the autoinducer-binding region of the LuxR protein from Vibrio fischeri ATCC 7744. J. Bacteriol., 172, 3980–3987. [DOI] [PMC free article] [PubMed] [Google Scholar]
- Slock J., van Riet, D., Kolibachuk, D. and Greenberg, E.P. (1990) Critical regions of the Vibrio fischeri LuxR protein defined by mutational analysis. J. Bacteriol., 172, 3974–3979. [DOI] [PMC free article] [PubMed] [Google Scholar]
- Swift S., et al. (1993)A novel strategy for the isolation of luxI homologues: evidence for the widespread distribution of a luxR:luxI superfamily in enteric bacteria. Mol. Microbiol., 10, 511–520. [DOI] [PubMed] [Google Scholar]
- Tanford C. (1973) The Hydrophobic Effect: Formation of Micelles and Biological Membranes. Wiley, New York, NY. [Google Scholar]
- Thomson N.R., Cox, A., Bycroft, B.W., Stewart, G.S.A.B., Williams, P. and Salmond, G.P.C. (1997) The Rap and Hor proteins of Erwinia, Serratia and Yersinia: a novel subgroup in a growing superfamily of proteins regulating diverse physiological processes in bacterial pathogens. Mol. Microbiol., 26, 531–544. [DOI] [PubMed] [Google Scholar]
- Toth I., Pérombelon, M.C.M. and Salmond, G.P.C. (1993) Bacteriophage ΦKP mediated generalised transduction in Erwinia carotovora subsp. carotovora.J. Gen. Microbiol., 139, 2705–2709. [Google Scholar]
- Zhu J. and Winans, S.C. (1999) Autoinducer binding by the quorum-sensing regulator TraR increases affinity for target promoters in vitro and decreases TraR turnover rates in whole cells. Proc. Natl Acad. Sci. USA, 96, 4832–4837. [DOI] [PMC free article] [PubMed] [Google Scholar]
- Zhu J., Beaber, J.W., Moré, M.I., Fuqua, C., Eberhard, A. and Winans, S.C. (1998) Analogs of the autoinducer 3-oxooctanoyl-homoserine lactone strongly inhibit activity of the TraR protein of Agrobacterium tumefaciens.J. Bacteriol., 180, 5398–5405. [DOI] [PMC free article] [PubMed] [Google Scholar]