

Abstract
Targeted disruption of both alleles of mouse sos1, which encodes a Ras-specific exchange factor, conferred mid-gestational embryonic lethality that was secondary to impaired placental development and was associated with very low placental ERK activity. The trophoblastic layers of sos1–/– embryos were poorly developed, correlating with high sos1 expression in wild-type trophoblasts. A sos1–/– cell line, which expressed readily detectable levels of the closely related Sos2 protein, formed complexes between Sos2, epidermal growth factor receptor (EGFR) and Shc efficiently, gave normal Ras⋅GTP and ERK responses when treated with EGF for ⩽10 min and was transformed readily by activated Ras. However, the sos1–/– cells were resistant to transformation by v–Src or by overexpressed EGFR and continuous EGF treatment, unlike sos1+/– or wild-type cells. This correlated with Sos2 binding less efficiently than Sos1 to EGFR and Shc in cells treated with EGF for ≥90 min or to v–Src and Shc in v–Src-expressing cells, and with less ERK activity. We conclude that Sos1 participates in both short- and long-term signaling, while Sos2-dependent signals are predominantly short-term.
Keywords: ERK activation pathway/genomic disruption/placental development/Ras signaling/spongiotrophoblasts
Introduction
The ras genes encode widely expressed membrane-associated GTPases that function as molecular switches that transduce a wide variety of growth and differentiation signals induced by extracellular ligands (Lowy and Willumsen, 1993; Macara et al., 1996; Campbell et al., 1998). Receptors activated by such ligands stimulate Ras by activating Ras-specific guanine nucleotide exchange factors (GNEFs), which convert Ras from inactive Ras⋅GDP to active Ras⋅GTP. In mammals, three types of Ras-specific GNEFs have been described: the closely related Sos1 and Sos2 proteins, the highly homologous GRF1 and GRF2, and GRP (Bowtell et al., 1992; Cen et al., 1992; Shou et al., 1992; Guerrero et al., 1996; Fam et al., 1997; Tung et al., 1997; Ebinu et al., 1998; Pierret et al., 1998; Tognon et al., 1998). As is true of ras, the sos genes are widely expressed, while the full-length grf1 and grp gene products have a more restricted tissue distribution.
Each type of Ras-specific GNEF seems to respond to distinct upstream signals. GRP is activated by a diacylglycerol-dependent mechanism (Ebinu et al., 1998; Tognon et al., 1998), while GRF1 and GRF2 appear to respond to calcium-dependent signals (Farnsworth et al., 1995; Tung et al., 1997) and heterotrimeric G proteins (Mattingly and Macara, 1996; Kiyono et al., 1999). The Sos proteins have been implicated mainly in signals induced by activated protein tyrosine kinases, which are coupled to Sos via adaptor proteins. Sos1 and Sos2 proteins are constitutively bound to the Grb2 adaptor, through an interaction between the SH3 domains in Grb2 and proline-rich regions in the C–termini of both Sos proteins. Upon protein tyrosine kinase activation, Sos is induced to form a complex with the kinase either by binding to the SH2 domain of Grb2, or less directly by binding a second adaptor protein such as Shc, which, following its activation, simultaneously binds to the SH2 domain of Grb2 and to the activated protein tyrosine kinase (Basu et al., 1994; Quilliam et al., 1995; Downward, 1996; Cherfils and Chardin, 1999).
sos1 is essential for intrauterine development, with homozygous null animals dying in mid-gestation in association with reported yolk sac and embryonic heart defects (Wang et al., 1997). Since Sos2 is also widely expressed, the lethality of sos1–/– embryos implies that the role of sos1 in development is distinct from that of sos2. However, it is not clear whether this arises primarily because sos2 may not be expressed sufficiently in some cells whose normal function depends on Sos, or may be secondary to putative differences between Sos1 and Sos2 signaling. In this report, we present experimental support for both possibilities. A placental defect that seems to account for the lethality of sos1–/– embryos occurs in an area that expresses higher levels of Sos1 than Sos2. On the other hand, we present in vitro results with two protein tyrosine kinases, Src and the epidermal growth factor receptor (EGFR), which suggest that Sos1 can participate in both short-term and long-term signaling, while Sos2-dependent signals are predominantly short-term. This mechanism may also contribute to the extra-embryonic defects seen in sos1–/– placentas.
Results
Targeting of the Sos1 locus
To inactivate the mouse sos1 locus, the genomic sequences containing an exon coding for a highly conserved N–terminal portion (40 amino acids) of its catalytic CDC25–H domain in J1 mouse embryonic stem (ES) cells (Pichel et al., 1996) were replaced with a phosphoglycerate kinase promoter-driven neomycin cassette, in the targeting vector pLM82 (Figure 1). Chimeric animals carrying the targeted sos1 gene were then used to generate heterozygous mice carrying one normal and one mutant sos1 allele, which were phenotypically normal. Southern analysis of the offspring from multiple crosses between sos1+/– heterozygotes did not show any sos1–/– newborn animals, indicating that such homozygous null animals were not viable (Figure 1B). In contrast, a PCR-based genotyping assay (Figure 1C) allowed detection of sos1–/– embryos from such crosses throughout early gestation. In agreement with a previous report (Wang et al., 1997), sos1–/– embryos were never found past day 11 of embryonic development, with various stages of necrosis and death of sos1–/– embryos observed between day post-conception 9 (DPC9) and DPC11 (not shown).

Fig. 1. Targeted disruption of the murine mSos1 gene in ES cells and mice. (A) Schematic representation of the mSos1 locus and targeting vector. Boxes in the wild-type allele schematics represent the exons of the mSos1 CDC25–H domain. The open boxes in the targeting vector schematics represent the pgk-neo and pgk-tk selectable markers. The position of the 3′–flanking probe used in Southern blotting is indicated. (B) Homologous recombination of the targeting vector in ES cells was verified by Southern blotting, digesting genomic DNA with EcoRV and hybridizing with the 3′–flanking probe. The wild-type allele produced a 14 kb band, whereas the mutant allele yielded a 6.9 kb band due to the introduction of a new EcoRV site in the targeting vector. (C) Genotyping of embryos arising from heterozygous crosses was performed by RT–PCR using the oligonucleotides indicated, whose sequences are given in Materials and methods. The LM87 and LM107 primers are specific for the sos1 gene and amplify a fragment of 612 bp. The LM82 primer is specific for the Neo-PGK promoter and amplifies a fragment of 410 bp with LM87.
Whereas no gross primary developmental abnormalities were seen in early stage sos1–/– embryos, placental defects were observed consistently with this genotype (Figure 2). We noted that by DPC10 the sos1–/– placental labyrinth layer (Figure 2D–F) was invariably extremely thin compared with wild type (Figure 2A–C). The spongiotrophoblast and labyrinth trophoblast layers in the sos1–/– placentas were highly disorganized, and the embryonic vasculature in the labryrinth was incomplete (compare Figure 2A and B with D and E). Labyrinth trophoblasts in sos1–/– placentas were dysplastic in appearance; they typically had pleomorphic nuclei and less cytoplasm than normal trophoblasts (Figure 2F). Abnormal, multinucleated giant trophoblasts containing abundant cytoplasm were also seen frequently, with advanced cases having hemorrhage in the yolk sac and the placental labyrinth (Figure 2D). We infer that the collapse of the normal labyrinth structure led to interference with the nutrition of the embryo and its subsequent death (Rinkenberger et al., 1997). In contrast to Wang et al. (1997), we did not observe cardiac- or other organ-specific abnormalities in the embryos before they died secondary to the placental defects.

Fig. 2. Placental labyrinth defects in sos1–/– animals. The left column (A–C) displays control preparations of mouse wild-type sos1 (+/+) placental/embryo structures at DPC12 (H&E-stained) at low, medium and high magnification, respectively. The right column (D–F) shows the corresponding sos1–/– preparations at DPC12. The wild type (A) contains embryo and developed placenta, while –/– (D) shows hemorrhage (dark red areas) into the labyrinth caused by the collapse of the labyrinth structure, and a dead embryo (not visible). The wild type (B) shows the chorionic plate (pale zone at top of figure), labyrinth, prominent spongiotrophoblast layer, giant cells and decidual layers, while –/– (E) has a thinner labyrinth, and it is difficult to discern the spongiotrophoblast layer. The wild type (C) shows a normal labyrinth, with maternal erythrocytes (M), labyrinth trophoblasts (LTB) and strings of embryonic nucleated erythrocytes within embryonic blood vessels. The –/– (F) has fewer nucleated embryonic erythrocytes (arrows) within fewer embryonic blood vessels, dysplastic labyrinth trophoblasts and a multinucleated giant cell (indicated by the letter G).
The apparent relevance of sos1 to the normal development of the labyrinth trophoblast and spongiotrophoblasts is underscored further by our observation that Sos1 is highly expressed in this layer of normal placentas. By in situ hybridization of sos1+/+ embryos and placentas at DPC12, we found that the spongiotrophoblasts gave the strongest Sos1 RNA signal, followed by the labyrinth trophoblasts (Figure 3A, left side), whose levels were similar to those in the central nervous system and other embryonic tissues (not shown). Immunohistochemistry with specific antibodies confirmed that Sos1 protein was expressed most abundantly in spongiotrophoblasts (Figure 3B, panels a and b). The level of Sos2 in placental tissues appeared to be lower than that of Sos1, with positive Sos2 immunostaining in a few cells of the decidua and in giant cell trophoblasts (Figure 3A and B).


Fig. 3. Sos1 and Sos2 expression in normal murine placental tissues. In situ hybridization (A) and histochemistry (B) of wild-type DPC12 placental tissues. (A) Left column: in situ hybridization with sos1 antisense (upper panel) and sense (negative control, lower panel) probes, ×50. Right column: in situ hybridization with sos2 antisense (upper panel) and sense (negative control, lower panel) probes. The results show a high sos1 mRNA signal in spongiotrophoblasts, less in labyrinth trophoblasts and none in the decidua. There was less sos2 expression. (B) Immunohistochemistry of normal placenta with Sos1- and Sos2-specific antibodies at low (a and c) and high (b and d) magnification, hematoxylin-stained. (a and b) The results show high expression of Sos1 protein within spongiotrophoblasts and less in the labyrinth. (c and d) Sos2 signal is seen in giant cell trophoblasts but not in spongiotrophoblasts and labyrinth trophoblasts. (e) Negative control of immunohistochemical staining using the same reagents except for the primary Sos1 and Sos2 antibodies (rabbit IgG).
Sos1- and Sos2-dependent ERK activation and complex formation in placental lysates of wild-type and mutant Sos1 embryos
The results obtained above indicated that homozygous disruption of sos1 was associated with primary placental abnormalities. Since the ERK MAP kinases are located downstream from Ras, ERK activity is often used as a marker of Sos-dependent activity. To determine if there might be a correlation between the sos1 genotype and placental ERK activity, extracts from the fetal portions of placentas were examined (Figure 4A). When the ERK activity of individual DPC10 placentas was analyzed, as determined by the ability of ERK2 immunoprecipitates to phosphorylate myelin basic protein (MBP), it was highest in sos1+/+ placentas (PF1, PF2 and PF4), lowest in an sos1–/– placenta (PF3) and intermediate in an sos1–/– placenta (PF5). The ERK activity in the maternal portion of the sos1+/– placenta (PM4) was much lower than that from the fetal portion (PF4), indicating that possible contamination with the maternal portion of the placenta would not contribute to the ERK activity identified in the fetal portion of the placentas.

Fig. 4. Analysis of signaling events in placenta. For (A) and (B), individual E10 placentas from Sos1+/– matings were dissected and separated into fetal portion (PF) and maternal portion (PM). (A) Placental ERK activity. Anti-ERK2 immunocomplexes were assayed for kinase activity using MBP as substrate. The middle and lower panels, with the control immunoblots, indicate that the extracts contained comparable amounts of ERK2 and EGFR protein, respectively. (B) Complexes between Sos1 and phosphorylated RTKs and other tyrosine-phosphorylated proteins. Placental extracts were immunoprecipitated with Sos1-specific antibody followed by immunoblotting with anti-phosphotyrosine antibody (PY). (C) Sos1 versus Sos2 complexes with phosphorylated proteins. Extracts from the pooled fetal portions of several wild-type (+/+) E10 placentas were immunoprecipitated with anti-Sos-1 or anti-Sos2 antibodies followed by anti-PY blot. The lower part, with the reblots, shows strong Sos1 and Sos2 signals precipitated by the homologous antibody.
The results argue that most of the ERK activity in the DPC10 fetal placenta is Sos1 dependent. Consistent with this interpretation, the relative amount of Sos1 bound to phosphotyrosine-containing proteins of ∼170 kDa, which we interpret to represent primarily activated receptor tyrosine kinases (RTKs), correlated with the relative ERK activity in the individual placental extracts (Figure 4B). The sos1+/+ placenta (PF4) had the strongest signal, while the sos1–/– placenta (PF5) had the weakest. An intermediate signal was seen in the sos1+/– placenta (PF3), with the signal from the maternal portion of the sos1+/– placenta being lower (PM4). In another experiment, wild-type DPC10 extracts pooled from several placentas were used to compare the relative proportion of Sos1 and Sos2 that bound to tyrosine-phosphorylated proteins, including RTKs (Figure 4C). The Sos1 immunoprecipitates gave a much stronger signal than the Sos2 immunoprecipitates (Figure 4C, upper panels), although the control immunoblots displayed similar intensities of precipitated Sos1 and Sos2 protein (lower panels). These results suggest preferential binding of Sos1 to activated RTKs, and other tyrosine-phosphorylated proteins in the placenta, compared with Sos2.
Transformation of rodent fibroblasts by v–Src and EGFR is dependent on Sos1
To study sos function in greater detail, DPC9 embryos from matings of sos1+/– animals were used to generate stable, permanent cell lines that were sos1–/–(–/– cells), sos1+/– (+/– cells) and wild type (+/+ cells). Three different –/– cell lines were derived. When preliminary analysis indicated that their growth characteristics were similar, one –/– line was selected for more detailed characterization. As expected, the –/– line contained Sos2 but not Sos1, the +/+ and +/– lines contained both Sos1 and Sos2, with the +/– line having less Sos1 than the +/+ line, and each line contained similar levels of Sos2 (data not shown). The loss of endogenous Sos1 was associated with a slower rate of growth. In 10% fetal calf serum, the generation time of the –/– cells was ∼40 h, while that of the +/+ and +/– lines was ∼25–30 h.
Cell transformation by oncogenes represents an alternative approach to examine the integrity of growth-dependent pathways. Since Sos1 lies genetically and biochemically upstream of Ras, the –/– cells should be sensitive to transformation by Ras. To verify that this was the case, –/– cells were infected with various dilutions of Harvey murine sarcoma virus, which contains a mutationally activated rasH gene. The –/– cells were transformed readily by this virus, although they were not quite as sensitive as the +/– or +/+ cells (Table I).
Table I. Transforming activities induced by oncogenes.
| Retrovirus |
sos1 genotype |
||
|---|---|---|---|
| +/+ | +/– | –/– | |
| v–RasH | 6.3 | 6.5 | 5.3 |
| v–Src | 6.5 | 5.1 | 0a |
| EGFR (+EGF) | 5.1 | 3.4 | 0a |
Mo-MuLV pseudotyped transforming viruses were prepared by superinfecting NIH 3T3 cells transfected with rescuable v–rasH-, v–Src- or EGFR-expressing retroviral vectors as described (Velu et al., 1987, 1989; DeClue et al., 1991a). Mouse embryo cells with the sos1 +/+, +/– or –/– genotype were infected with 10–fold serial dilutions of virus, and cultured in 2% FBS–DMEM with or without EGF (10 ng/ml) for 7–10 days, when foci of transformed cells were counted. As expected, foci were seen in cells infected with the EGFR virus only if the cells were treated with EGF. The numbers in the table indicate the log10 of the focus-forming titer. Data shown are representative of two experiments. The log10 titers in NIH 3T3 cells, as determined in the same experiment, were 7.3, 6.1 and 5.8, for v–RasH, v–Src and EGFR, respectively.
aNo foci were seen in the Sos1 –/– cells infected with the v–Src or EGFR virus.
In contrast to Ras, many RTK and non-receptor (cytoplasmic) tyrosine kinases (CTKs) have been placed upstream from Sos and/or Ras. Several approaches have led to the conclusion that in many mammalian cell systems transformation by protein tyrosine kinases requires the activation of endogenous Ras (Smith et al., 1986; DeClue et al., 1991b; Nori et al., 1991; Stacey et al., 1991), although in some mammalian systems transformation by the Src protein tyrosine kinase appears to be Ras independent (Aftab et al., 1997; Oldham et al., 1998). To determine whether the presence of Sos2 was sufficient for transformation by CTK and RTK, the –/– cells were infected with a retrovirus encoding a mutationally activated Src protein, which is a CTK, or one encoding the wild-type human EGFR, an RTK. The EGFR virus has been shown previously to induce conditional cell transformation when the cells expressing the EGFR were treated with exogenous ligand such as EGF (Velu et al., 1987). Unlike the Ras-expressing virus, neither the EGFR-encoding virus, in the presence of EGF, nor the Src-encoding virus induced morphological transformation of the –/– cells (Table I), although the cells had been infected successfully by the viruses, as verified by the ability of cell-free filtrates of culture fluid from the infected cells to induce morphological transformation of NIH 3T3 cells, which contain Sos1 (data not shown). Furthermore, both viruses were able to induce the expected transformed phenotypes in +/+ and +/– cells (Table I). The +/– cells were less sensitive than the +/+ cells to transformation, perhaps because the +/– cells have less Sos1 protein than the +/+ cells.
The above results suggested that Sos1 is required for cell transformation by Src and EGFR, and that the lack of Sos1 in the –/– cells accounts for their inability to be transformed by these tyrosine kinases. To verify this possibility, a plasmid encoding wild-type Sos1 was transfected into the –/– cells that were infected with the Src retrovirus. This led to the development of numerous areas of constitutive focal transformation for the Src-containing cells (Figure 5).

Fig. 5. Reconstitution of Sos1 in –/– cells restores the transforming activity of v–Src. –/– cells were transiently transfected with empty vector or a plasmid expressing mouse Sos1 followed by infection with the v–Src or v–Ras virus. The photomicrographs are from the resulting lines. (A) –/– cells transfected with Sos1, not infected with virus (negative control); (B) –/– cells transfected with empty vector and infected with v–Src virus; (C) –/– cells transfected with empty vector and infected with v–Ras virus; and (D) –/– cells transfected with Sos1 and infected with v–Src virus.
Short-term treatment with EGF induces similar signaling in +/+ or +/– cell lines
The biological observations described above indicated that Sos2 was not able to support transformation by Src and EGFR under the conditions tested, and conversely that the presence of Sos1 was required for transformation by Src and EGFR. These results made it likely that there might be differences between signaling by Sos1 and Sos2, a possibility also raised by the data obtained with placenta extracts (Figure 4C). We therefore compared EGF-dependent Sos1 and Sos2 signaling.
We first tested the ability of the cells to respond to short-term EGF treatment. Since the other Ras-specific exchange factors, GRF and GRP, were not expressed in the cell lines (data not shown), the change in Ras⋅GTP should be a determinant of Sos function. When the change in endogenous Ras⋅GTP was determined after 5 min EGF treatment (10 ng/ml), a similar increase was seen in the +/+, +/– and –/– cell lines (Figure 6A). As with the placental extracts, we also used the ability of EGF to stimulate ERK2 activity as an index of Sos activity. Consistent with the Ras⋅GTP results, the EGF-dependent activation of endogenous ERK2 was similar in the +/+ and –/– cells (Figure 6B).
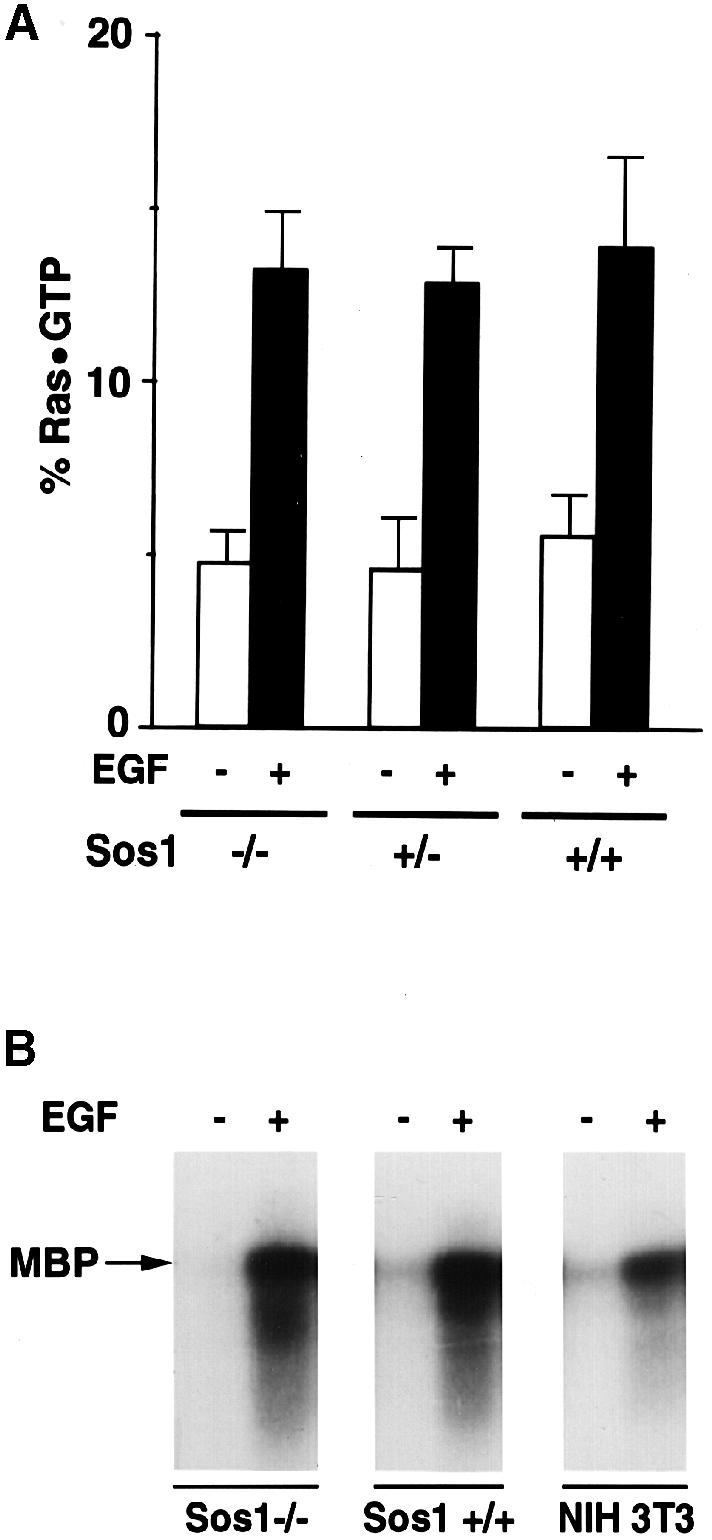
Fig. 6. Ligand-induced acute signaling in wild-type and Sos1 –/– cells. (A) EGF-dependent changes in Ras⋅GTP. Subconfluent Sos1 +/+, +/– and –/– cells were deprived of serum for 16 h, then metabolically labeled with [32P]orthophosphate for 10 h and stimulated with 10 ng/ml EGF for 5 min. Cells were then lysed and analyzed for Ras⋅GTP and Ras⋅GDP (Zhang et al., 1992). The results represent the average of three experiments. (B) Ligand-induced ERK activity. Serum-deprived cells were treated with or without ligand for 5 min as indicated. Anti-ERK2 immunocomplexes were assayed for kinase activity using MBP as substrate. Data shown are representative of two experiments.
Long-term ERK activity differs between +/+ and –/– cell lines
Since no obvious differences were obtained between the +/+ and –/– cells subjected to short-term growth factor treatment, we speculated that longer term signaling might be impaired in the –/– cells. To examine this possibility, we used ERK2 activity to compare EGF-dependent signaling in +/+ and –/– cells overexpressing EGFR. As with the analysis of parental cells, there was a strong activation of ERK2 activity when the +/+ and –/– lines overexpressing EGFR were treated with EGF for 10 min (Figure 7A). When the +/+ cells were incubated with EGF for 90 min or longer, the activity of ERK2 remained higher than prior to EGF treatment, although there was as expected a progressive decrease in ERK2 activity, since EGFR activation is followed by its down-regulation and degradation (Figure 7A and B). It is noteworthy, however, that starting with the 90 min time point, the ERK2 activity in the –/– line was much lower than in the +/+ line at each time point (Figure 7A).

Fig. 7. Comparison of EGF-induced long-term ERK activity in Sos1 +/+ or +/– cells with Sos1-knockout cells. Sos1 +/+, +/– or –/– embryo cells were infected with virus encoding human EGFR. Cells were treated with EGF (10 ng/ml) for the time periods indicated. (A) A 100 μg aliquot of protein from Sos1 +/+ and –/– cell lysates was immunoprecipitated with anti-ERK2 antibody followed by immune complex kinase assay using MBP as a substrate. (B) Equal amounts of protein from EGF-treated Sos1 (–/–) or (+/+) embryo cells were analyzed by immunoblotting with the indicated antibody. (C) A 100 μg aliquot of protein from EGF-treated Sos1 +/– and –/– cell lysates was immunoprecipitated with anti-ERK2 antibody followed by immune complex kinase assay as in (A). The amount of radioactivity present in the phosphorylated MBP was quantitated by a phosphoimager, and the fold increase is shown underneath the figure. (D) The upper part of the gel in (C) was immunoblotted with anti-ERK2 antibody, as a loading control.
In contrast to mouse Sos1, mouse Sos2 has been shown to be subject to constitutive ubiquitin-dependent degradation (Nielsen et al., 1997), raising the possibility that the more rapid decrease in ERK activity in the –/– cells might have resulted from a decrease in the steady-state level of Sos2. However, the more rapid decrease in ERK activity was not secondary to a decrease in Sos2 levels upon EGF treatment, as the levels of Sos1 and Sos2 remained stable throughout the 24 h observation period (Figure 7B). Consistent with the interpretation that the absence of Sos1 accounted for the lower EGF-dependent ERK activity seen at longer time points in the –/– cells, the ERK activity was also higher in the +/– cell line at these times (Figure 7C and D).
Sos1 forms long-term stable complexes with activated EGFR and Shc; Sos2 complex formation is of shorter duration
To explore the mechanism responsible for the reduced longer term ERK signaling in the –/– cells, complex formation was analyzed between Sos and other signaling partners. As noted in the Introduction, EGF treatment induces complex formation between Sos and the activated EGFR. The binding is indirect, being mediated by the Grb2 that is bound to Sos. Some binding occurs via a tripartite complex composed of a Grb2 molecule bound directly to activated EGFR and to Sos, while other binding is mediated by a tetrapartite complex involving the adaptor protein Shc, which binds to activated EGFR and to Grb2-bound Sos.
The +/+ and –/– cells were treated with EGF for 10 min, 90 min and 6 h (Figure 8). At these time points, Sos1 was immunoprecipitated from extracts made from the +/+ line, and Sos2 from the –/– line, and complex formation was analyzed by Western blotting of the immunoprecipitates with antibodies specific for phosphotyrosine or Grb2 (Figure 8A). Consistent with the similar levels of ERK activity seen in the +/+ and –/– lines after EGF treatment for 10 min, a strong signal was seen at this time point when the Sos1 and Sos2 immunoprecipitates were blotted with the anti-phosphotyrosine antibody, as a surrogate for the activated EGFR bound to Sos1 and Sos2 in extracts from the +/+ (Figure 8A, left panel, top row) and –/– (right panel, top row) cells, respectively. As with the ERK activity at later time points, the anti-phosphotyrosine signal at 90 min and 6 h of EGF was reduced in the +/+ extracts, but the degree of reduction was greater in the –/– extracts. The differences in the anti-phosphotyrosine signal were not secondary to changes in the amount of Sos1 or Sos2 in the immunoprecipitates, since reblotting with antibodies to Sos1 (Figure 8A, left panel, lower row) and Sos2 (right panel, lower row) showed that the amount of precipitated Sos protein did not vary with the duration of EGF treatment. Furthermore, blotting of the Sos immunoprecipitates with Grb2 antibodies indicated that the reduction in complex formation between EGFR and Sos1 or Sos2 was not associated with a concomitant decrease in Grb2 binding to either Sos protein (Figure 8A, middle panel), since the Grb2 signal was relatively constant over time.

Fig. 8. EGF-induced formation of signaling complexes in Sos1 +/+, +/– and –/– cells. EGFR virus-infected cells were serum starved and treated with EGF (10 ng/ml) for the periods indicated. Equal amounts of cell lysates were immunoprecipitated with antibodies against Sos–1 or Sos–2, followed by blotting with anti-phosphotyrosine antibody (PY) or GRB2. The anti-PY blots were then reprobed with anti-Sos antibodies after stripping to serve as loading controls. Comparison of Sos–1 or Sos–2 forming a complex with activated EGFR or GRB2 in (A) Sos1 +/+ versus –/– cells, and in (B) Sos1 +/– versus –/– cells.
The +/– cells behaved similarly to the +/+ cells, in that at 90 min and 6 h of EGF treatment there was much more Sos1 bound to EGFR in the +/– cells than Sos2 bound to EGFR in the –/– cells (Figure 8B). In addition, at these two time points, the +/– cells had much more Sos1 than Sos2 complexed with EGFR. Since the reblots of the immunoprecipitates from +/– cells showed that the Sos1 and Sos2 signals had similar intensities (Figure 8B, bottom panel), the results from the +/– cells underline the greater ability of Sos1, compared with Sos2, to remain complexed with activated EGFR.
To assess the Sos1 and Sos2 complexes formed with Shc in response to EGF, extracts from +/+ and –/– cells were immunoprecipitated with Shc antibodies and Western blotted with Sos1 antibodies for the +/+ extracts (Figure 9A, left panel, upper row) and with Sos2 antibodies for the –/– extracts (right panel, upper row). The profile of Shc binding was similar to that seen with binding to activated EGFR and to ERK activity: relatively strong at 10 min for both lines, reduced at 90 min and 6 h in both lines, but lower for the –/– line than the +/+ line. The reduced binding was not secondary to a decrease in Shc levels, which remained constant over time (Figure 9A, lower panel). The +/– cells behaved similarly to the +/+ cells, with the 90 min and 6 h extracts from the +/– cells showing a much higher proportion of Shc bound to Sos1 than to Sos2 (Figure 9B).

Fig. 9. Analysis of complex formation between Shc and Sos in Sos1 +/+, +/– and –/– cells. EGFR virus-infected cells were serum starved and treated with EGF (10 ng/ml) for the times indicated. Equal amounts of cell lysates were immunoprecipitated with polyclonal antibody against Shc followed by blotting with anti-Sos–1 or anti-Sos–2 antibodies. The lower panels used anti-Shc monoclonal antibody as loading controls. Comparison of Sos1 or Sos2 co-immunoprecipitated with Shc in (A) Sos1 +/+ versus –/– cells, and in (B) Sos1 +/– versus –/– cells.
Sos1, but not Sos2, forms stable complexes with Shc and v–Src in cells expressing v–Src
Analogous results were obtained when cells expressing the constitutively activated v–Src were analyzed for complexes between Src and Sos, which form as a quadrapartite complex that also involves Grb2 and Shc (Figure 10). In cells expressing v–Src, stable complex formation between Sos1 and Shc was much more efficient than between Sos2 and Shc, whether the comparison is with Sos2 in the +/+ or in the –/– cells (Figure 10A). Similar differences were also seen with Src–Sos complex formation (Figure 10B).

Fig. 10. Analysis of complex formation in v–Src virus-infected Sos1 +/+ and –/–cells. Sos1 +/+ and –/– cells with or without v–Src virus infection were serum starved for 16–18 h. (A) Comparison of Sos1or Sos2 co-immunoprecipitated with Shc. Equal amounts of cell lysates were immunoprecipitated with anti-Shc antibody followed by blotting with anti-Sos1 or anti-Sos2 antibodies. The lower panels used anti-Shc monoclonal antibody as loading controls. Expression of Sos2 and Sos1 in v–Src virus-infected +/+ and –/– cells was examined by immunoblotting. (B) Comparison of Sos1 or Sos2 co-immunoprecipitated with v–Src. Equal amounts of the cell extracts were immunoprecipitated with anti-Src antibody followed by blotting with anti-Sos antibodies as indicated. Lysates were immunoprecipitated and blotted with anti-Src antibody to confirm v–Src expression in the infected cells.
Discussion
This study reports two important differences between Sos1 and Sos2: a critical region of the developing placenta contains particularly high levels of Sos1, and Sos1 carries out long-term signaling more efficiently than Sos2. Our analysis has used targeted disruption of sos1 to provide evidence that these differences are biologically significant.
Placental defect and embryonic lethality
The sos1+/– (+/–) mice appeared to develop normally, while homozygous disruption of sos1 resulted in mid-term lethality for sos1–/– (–/–) embryos, as reported previously (Wang et al., 1997). While these authors attributed the embryonic death as arising primarily from cardiovascular defects, we did not observe any gross developmental abnormalities in the –/– embryos prior to their disappearance during DPC9–DPC11. Instead, we attribute the embryonic death in the –/– embryos studied here to be secondary to placental malformation. We consistently observed inadequate labyrinth development in the –/– placentas, resulting in a failure to make the transition from yolk sac-dependent embryonal nutrition to placental-dependent nutrition. This defect correlated well with our observation that Sos1 is highly expressed in the labyrinth of normal placentas.
The somewhat discrepant pathological findings noted by us and Wang et al. (1997) may be secondary to differences in the genetic backgrounds of the strains used in the two studies, differences in the exons chosen for the targeted sos1 disruption or even to putative environmental differences. The evidence suggests that the disrupted alleles in both studies were null, as the +/– mice in both studies were developmentally normal, and the disrupted alleles did not appear to encode a stable Sos1 polypeptide. We therefore suspect that distinct genetic backgrounds may account for the observed differences; a different ES cell line (J1) was used as well as a different strain (C57Bl versus 129Sv). With other growth regulatory genes, such as EGFR, the genetic background can have a drastic effect on the developmental phenotype (Threadgill et al., 1995).
The results suggest a critical role for Sos1 in development of extra-embryonal cell lineages involved in placental development, particularly in the labyrinth. The –/– placentas presented reduced and disorganized layers of labyrinth trophoblasts and spongiotrophoblasts as well as abnormal giant multinucleated trophoblasts. A number of null mutations in other loci are also known to result in mid-gestational embryonic lethality (reviewed in Rinkenberger et al., 1997; Ward and Devor–Henneman, 2000), with some, such as the transcription factor genes Mash2 (Guillemot et al., 1994), Ets2 (Yamamoto et al., 1998) and Vhl (Gnarra et al., 1997), having placental abnormalities involving the labyrinth. In the case of Mash2 and Ets2, their essential role in normal placental development has been shown, since the lethality of null mutants can be rescued in chimeras that incorporate non-mutant cells into the placenta (Guillemot et al., 1994; Tanaka et al., 1997; Yamamoto et al., 1998).
Most ERK activity in DPC10 placentas was Sos1 dependent. In addition to implying that the Ras–Raf–ERK pathway in placentas is highly dependent upon Sos1, this observation suggests that Sos2 makes only a small contribution to the overall ERK activity in the mid-gestational placenta, which probably accounts for the Sos1 placental requirement during this period of gestation. It is also likely that the lesions in the –/– placentas have arisen, at least in part, because Sos1 is required to activate Ets2. This inference is based on reports that Ets2 activity in cultured cells is regulated by the Ras–Raf–ERK pathway (Yang et al., 1996; McCarthy et al., 1997; Wasylyk et al., 1998) and that Ets2 null mice have a placental phenotype similar to the one seen here with the sos1 null animals (Yamamoto et al., 1998). Sos1 is probably also associated with Mash2 effects, since homozygous disruption of Mash2 results in undetectable levels of RTKs such as the Flt-1 VEGF receptor, whose genetic disruption leads to mid-gestational embryonic lethality associated with incomplete placental angiogenesis (Fong et al., 1995).
The results indicate that endogenous sos2 does not substitute genetically for sos1. This inability might result from the absolute level of Sos protein in critical target cells being too low, from the lower activity of Sos2 compared with Sos1, from putative precise differences in the upstream and/or downstream targets of Sos1 and Sos2 or a combination of these factors. The absolute level of Sos protein would seem to account at least in part for the Sos1 requirement, in view of the high Sos1 levels in the normal trophoblast layers and the pathology in the –/– placentas. The decreased ability of Sos2 to carry out long-term signaling (discussed in greater detail below) may also contribute, given the observation that a lower proportion of Sos2 protein than Sos1 was complexed with activated RTKs in the placental extracts.
Sos1 is required for long-term signaling through the Ras–MAPK pathway
Since death of the –/– fetuses did not occur until mid-gestation, it was possible to establish cell lines from DPC9 embryos of each genotype (–/–, +/– and +/+) and to characterize their growth and signaling properties. A striking phenotypic difference was identified when the lines were infected with retroviruses expressing either of two protein tyrosine kinases (PTKs), v–Src or EGFR. While the +/+ and +/– lines were susceptible to transformation by v–Src and EGFR, the –/– line was resistant. The results imply that the levels of Sos2 in the cells cannot support transformation by these PTKs, while even the reduced Sos1 levels in the +/– line can carry out this function. These results are formally analogous to the observed sos1 dependence for growth of the labyrinth in the developing placenta.
The loss of sos1 was shown, by two criteria, to account for the resistance of the –/– cells to RTK transformation. The first was that the –/– cells were transformable by a mutationally activated ras gene. Since Ras lies immediately downstream from Sos, this result implies that the cells are resistant to transformation only by oncogenes that lie upstream of ras, which argues that resistance to RTK transformation is secondary to the loss of sos1. The second criterion was that introduction of sos1 rendered the –/– cells sensitive to transformation by the RTK, providing formal genetic evidence that the defect was secondary to disruption of sos1.
Ras has been shown to be required for cellular transformation by various PTKs, including v–Src and EGFR, in many cell systems (Smith et al., 1986; DeClue et al., 1991b; Nori et al., 1991; Stacey et al., 1991), although in some situations PTK-dependent transformation may be Ras independent (Aftab et al., 1997; Oldham et al., 1998). In addition, Grb-2 is required for transformation by polyoma middle T antigen (Cheng et al., 1998), which is believed to be mediated at least in part by c-Src activation. Since Sos is thought to represent the critical ubiquitously expressed GNEF that links PTKs to Ras, it is not surprising that PTK-dependent transformation might also depend upon Sos. However, we did not anticipate that loss of Sos1 would render the cells resistant to transformation by the RTKs, since the cells contained Sos2.
To begin to probe the underlying basis of the requirement for sos1, several aspects of Sos1- and Sos2-dependent signaling were examined. Short-term PTK-dependent signaling appeared to be very similar for Sos1 and Sos2, suggesting that under the conditions tested Sos is not limiting for short-term signaling even in –/– cells. When cells were treated with EGF for up to 10 min, the ERK activity in –/– cells was similar to that in the other cells, and the proportion of Sos2 that bound to EGFR and Shc was similar to that bound by Sos1.
However, Sos2-dependent long-term signaling was less efficient than that of Sos1, with EGF treatment for 90 min or longer resulting in ERK activity that was lower in –/– cells than in +/+ or in +/– cells. This result correlated with Sos2 binding less efficiently to EGFR and to Shc than did Sos1. Analogous results were seen with v–Src, whose constitutive activity represents another form of long-term PTK-dependent signaling. In v–Src-expressing cells, Sos2 bound less efficiently to v–Src and Shc than did Sos1.
We do not know the molecular mechanisms underlying the decreased binding of Sos2 to Shc and to the activated PTK. During long-term signaling, there was no detectable reduction in Sos2 protein or the proportion of Grb2 associated with Sos2. These results imply that the mechanism does not involve a change in the steady-state level of Sos2 and that it must be distinct from the one reported for insulin-dependent attenuation of Ras, where a decrease in the binding of Grb2 to Sos has been seen (Corbalan-Garcia et al., 1996; Holt et al., 1996; Okada and Pessin, 1996). Instead, the data suggest that since Sos binds to Shc and to PTK via Grb2, the mechanism of attenuated complex formation probably involves a change in the conformation of the Grb2 bound to Sos2, relative to the Grb2 bound to Sos1. Paradoxically, an apparently analogous phenomenon, decreased binding of the Sos1⋅Grb2 complex to Shc or to PTK, has been reported by some investigators for Grb2-bound Sos1 following long-term EGF treatment (Basu et al., 1994; Rozakis-Adcock et al., 1995; Porfiri and McCormick, 1996). In the situation described here, there is at least a quantitatively greater effect on the Grb2⋅Sos2 complex than on the Grb2⋅Sos1 complex. It remains to be determined whether the putative conformational change has arisen via a post-translational modification to Grb2 that preferentially affects Grb2 bound to Sos2, a post-translational modification that preferentially affects Sos2, the preferential binding of a putative protein to the Grb2⋅Sos2 complex, or another mechanism. The C–termini of Sos1 and Sos2 are only 40% homologous, which makes this region a likely candidiate for mediating the distinct signaling properties of the two Sos proteins.
Regardless of the mechanism, the difference between long-term Sos1 and Sos2 PTK-dependent signaling correlated with the Sos1 dependence of the PTKs to induce cellular transformation. Since cell transformation depends on the continuous activity of the viral oncogene, and thus on long-term signaling by the downstream components that mediate the transformed phenotype, the observed differences in long-term signaling are probably directly relevant to the divergent transforming activities of the PTKs in the cell lines. In addition, the similarities between the signaling data seen with the cultured cells and those observed with the placental extracts are consistent with the hypothesis that the lower efficiency of long-term Sos2 signaling, relative to that of Sos1, accounts at least in part for the sos1 requirement in the placenta.
Materials and methods
mSos1 targeting and genotyping
Lambda genomic DNA clones corresponding to the mouse (m) Sos1 CDC25–H coding domain were isolated from a 129SvJ mouse-derived library (Stratagene) and their inserts subcloned into pBluescript II (Stratagene). Plasmids pPNT (Tybulewicz et al., 1991), containing pgk-neo, and pMC1-TkpA (Fernandez-Salguero et al., 1995), containing thymidine kinase, were used to construct the sos1 targeting vector pLM82 (Figure 1A). A 1.96 kb XbaI–PvuII fragment containing exon A was used as the 5′ arm of the construct, and a 3.7 kb PpuMI–PpuMI fragment containing exon C was used as the 3′ arm. The Neo cassette from pPNT (XhoI–BamHI) was used as a positive marker and replaced a 0.94 kb fragment containing exon B (coding for amino acids 815–854, inside the CDC25-H domain) (Figure 1A). The negative marker (herpes tk) was placed 3′ to the regions of sos1 homology. The targeting vector, pLM82, was linearized with SalI, and electroporated (Gene Pulser, Bio-Rad; 250 V, 250 μF) into J1 ES cells (Pichel et al., 1996). After electroporation, 2.0 × 10⁶ cells per dish were plated on 100 mm tissue culture dishes containing G418-resistant embryonic fibroblasts. Colonies resistant to double selection [350 μg/ml G418 (Gibco-BRL) and 5 μM gancyclovir (Syntex, Palo Alto, CA)] were isolated and expanded. Southern blotting analysis showed that 17 out of 480 double-resistant clones tested had targeted disruption of one sos1 locus by homologous recombination (Figure 1).
Several of the recombinant ES cell lines showing normal karyotypes (Genome Systems) were used to generate chimeras by injection into 3.5 day C57Bl6/N blastocysts. The blastocysts were transferred to NIH-Swiss pseudopregnant foster mothers, and chimeric offspring, identified by their agouti coat color, were mated with C57Bl6/N males and females. Agouti offspring were then analyzed for sos1 disruption by Southern blot and PCR analysis. Eight of the chimeras achieved germline transmission of the disrupted sos1 allele at very high frequency.
Genomic DNA was extracted from cultured ES cells, mouse tail biopsies and embryo yolk sacs as described by Laird et al. (1991). For Southern analysis, 20 μl of DNA were digested with EcoRV, electrophoresed in 0.6% agarose gels and blotted to GeneScreen Plus membranes (Dupont). A probe flanking the 3′ end of the targeting vector sequences was labeled with a random primer labeling kit (Stratagene) for hybridizations. Wild-type and mutated alleles were identified by the presence of restriction endonuclease fragments of the appropriate size (Figure 1). Clones displaying homologous recombination were reconfirmed with SpeI digestion. Digestion of ES cell DNA with enzymes that did not digest within the targeting vector and Southern blotting and hybridization with a neo probe showed only a single band, indicating that there was only a single site of vector insertion in the targeted ES cell clones.
PCR also was used to genotype DNA isolated from mouse tail biopsies or embryo yolk sacs. Three primers, LM87 (5′–AGCTAAAGGACAGCCTGGTTAAGGCGC–3′), LM107 (5′–TTCCCAGCAGGTAGATGCTCCTCCCATACG–3′) and LM82 (5′–CTACCGGTGGATGTGGAATGTGTGCGA–3′), were used in a 50 μl reaction with 1–2 μl of DNA and 1.25 U of Taq polymerase (Boerhinger Mannheim) for 31 cycles under the conditions indicated by the manufacturer. Amplified products were analyzed directly in 1% agarose gels.
In situ hybridization and immunohistochemistry
Mouse placentas and embryos were fixed in the uterus, in neutral buffered formalin or 4% paraformaldehyde. After fixation, embryos were dissected carefully in order to carry out a gross examination of the embryo and placenta, embedded in paraffin, sectioned at 5 μm and analyzed for immunohistochemistry and histology as described (Gnarra et al., 1997).
Paraformaldehyde- or formalin-fixed, paraffin-embedded sections of placentas from sos1–/– and wild-type mice were used for in situ hybridization to determine sos1 and sos2 mRNA expression. The sense probe was a 4.4 kb fragment (bp 78–4511 of sos1 cDNA; DDBJ/EMBL/GenBank accession No. Z11574). The antisense probe was a 4.1 kb fragment (bp 415–4511 of the same mSos1 cDNA). The sos2 sense and antisense probes used were, respectively, 4.3 and 3.2 kb fragments (bp 1–4365 and 1198–4365; DDBJ/EMBL/GenBank accession No. Z11664) of mouse sos2 cDNA. RNA probes were diluted to a specific activity of 2 × 10⁶ d.p.m./μl and hydrolyzed with alkali before hybridization. In situ hybridization was performed as previously described (Fox and Cottler-Fox, 1993a,b).
Embryo cell lines and transformation
To derive cell lines from embryos of each sos1 genotype, females pregnant at DPC 9.0–10.0 were dissected to recover the embryos, which were then genotyped by PCR, using DNA from yolk sacs. Each embryo was mechanically minced individually, treated with trypsin–EDTA 0.25% (Gibco-BRL) for 30 min, and plated in Dulbecco's modified Eagle's medium (DMEM) supplemented with 10% fetal bovine serum (FBS; Hyclone). The cultures were then grown until confluence before splitting the cells at a 1/3–1/5 dilution. Cultures were continued under similar conditions up to ∼20 passages, when those surviving crisis were selected and stored as immortalized lines. DNA was extracted from these immortalized cells and analyzed by PCR to reconfirm the original genotyping results done on DNA from the embryonic yolk sac. The lines were designated as +/+, +/– or –/–, according to their sos1 genotype. No truncated Sos1 protein was seen in the +/– or –/– lines when cell extracts were blotted with an antibody specific for the N–terminus of Sos1, under conditions where constitutive forced expression of an N-terminally truncated Sos1 polypeptide was readily detected in transfected NIH 3T3 cells, which served as a positve control.
For reconstitution of Sos1 in –/– cells, pcDNA3 vector (Invitrogen) or pcDNA3-Sos1, which expressed wild-type Sos1, was transfected into –/– cells in 35 mm dishes, using calcium phosphate precipitation as described (Willumsen et al., 1991). The pcDNA3-Sos1 plasmid was constructed by isolating the mSos1-encoding wild-type gene from pGV16-Sos1 (Qian et al., 1998) as an EcoRI–XhoI fragment and inserting it into EcoRI and XhoI sites in pcDNA3. The day after the transfection, the cells were trypsinized and divided 1:8 per 60 mm dish. On the next day, the cells in the 60 mm dishes were infected with 10–fold serial dilutions of v–RasH- or v–Src-expressing retroviruses and monitored for focus formation.
ERK kinase and immunocomplex assays
For placental extracts, DPC10 placentas from a pregnant sos1 heterozygote that had been mated with another sos1 heterozygote were dissected and rinsed in cold phosphate-buffered saline (PBS). Placentas were then homogenized in ice-cold extraction buffer (20 mM Tris–HCl pH 8.0, 1% NP–40, 10 nM EGTA, 5 mM MgCl2, 20 mM β–glycerophosphate, 1 mM Na3VO4, 1 mM dithiothreitol, 1 mM phenylmethylsulfonyl fluoride, 10 μg/ml leupeptin, 10 μg/ml aprotinin) by 10 strokes with a glass homogenizer. The crude lysates were first clarified by centrifugation at 12 000 g for 15 min at 4°C, then centrifuged at 100 000 g for 30 min at 4°C. The supernatants were collected, and the protein concentrations were estimated by BCA kit (Pierce). The original genotype of each placenta, made from its associated fetal parts, was confirmed by PCR analysis of DNA from the corresponding embryonic yolk sac.
For assays with cultured cells, subconfluent cells were serum starved for 16–18 h, and treated with EGF (10 ng/ml) for various time periods. Cells were lysed with RIPA buffer (Anborgh et al., 1999). For MAP kinase assay, equal amounts of protein (100 μg) from cell extracts or placenta extracts were immunoprecipitated with anti-ERK2 antibody (Santa Cruz Biotech) and the precipitates were processed, and analyzed and quantified for kinase as described, using MBP as substrate (Anborgh et al., 1999). For immunocomplex assays, cells were solubilized by non-denaturing lysis buffer and processed essentially as described (Anborgh et al., 1999). Grb2 and Shc antibodies were from Transduction Laboratories, Sos1, Sos2 and v–Src antibodies from Santa Cruz Biotech, and anti-phosphotyrosine (α–PY) from UBI.
Acknowledgments
Acknowledgements
We thank Drs Cecil Fox and Catherine Rehm (Molecular Histology Laboratory, Gaithersburg, MD) for their support with in situ hybridization procedures.
References
- Aftab D.T., Kwan, J. and Martin, G.S. (1997) Ras-independent transformation by v–Src. Proc. Natl Acad. Sci. USA, 94, 3028–3033. [DOI] [PMC free article] [PubMed] [Google Scholar]
- Anborgh P.H., Qian, X., Papageorge, A.G., Vass, W.C., DeClue, J.E. and Lowy, D.R. (1999) Ras-specific exchange factor GRF: oligomerization through its Dbl homology domain and calcium-dependent activation of Raf. Mol. Cell. Biol., 19, 4611–4622. [DOI] [PMC free article] [PubMed] [Google Scholar]
- Basu T., Warne, P.H. and Downward, J. (1994) Role of Shc in the activation of Ras in response to epidermal growth factor and nerve growth factor. Oncogene, 9, 3483–3491. [PubMed] [Google Scholar]
- Bowtell D., Fu, P., Simon, M. and Senior, P. (1992) Identification of murine homologues of the Drosophila son of sevenless gene—potential activators of ras. Proc. Natl Acad. Sci. USA, 89, 6511–6515. [DOI] [PMC free article] [PubMed] [Google Scholar]
- Campbell S.L., Khosravi-Far, R., Rossman, K.L., Clark, G.J. and Der, C.J. (1998) Increasing complexity of Ras signaling. Oncogene, 17, 1395–1413. [DOI] [PubMed] [Google Scholar]
- Cen H., Papageorge, A.G., Zippel, R., Lowy, D.R. and Zhang, K. (1992) Isolation of multiple mouse cDNAs with coding homology to Saccharomyces cerevisiae CDC25—identification of a region related to bcr, vav, dbl and CDC24. EMBO J., 11, 4007–4015. [DOI] [PMC free article] [PubMed] [Google Scholar]
- Cheng A.M., et al. (1998)Mammalian Grb2 regulates multiple steps in embryonic development and malignant transformation. Cell, 95, 793–803. [DOI] [PubMed] [Google Scholar]
- Cherfils J. and Chardin, P. (1999) GEFs: structural basis for their activation of GTP binding proteins. Trends Biochem. Sci., 24, 306–311. [DOI] [PubMed] [Google Scholar]
- Corbalan-Garcia S., Yang, S.-S., Degenhardt, K.R. and Bar-Sagi, D. (1996) Identification of the mitogen-activated protein kinase phosphorylation sites on human Sos1 that regulate interaction with Grb2. Mol. Cell. Biol., 16, 5674–5682. [DOI] [PMC free article] [PubMed] [Google Scholar]
- DeClue J.E., Vass, W.C., Papageorge, A.G., Lowy, D.R. and Willumsen, B.M. (1991a) Inhibition of cell growth by lovastatin is independent of ras function. Cancer Res., 51, 712–717. [PubMed] [Google Scholar]
- DeClue J.E., Zhang, K., Redford, P., Vass, W.C. and Lowy, D.R. (1991b) Suppression of src transformation by overexpression of full-length GTPase activating protein (GAP) or of the GAP C terminus. Mol. Cell. Biol., 11, 2819–2825. [DOI] [PMC free article] [PubMed] [Google Scholar]
- Downward J. (1996) Control of ras activation. Cancer Surv., 27, 87–100. [PubMed] [Google Scholar]
- Ebinu J.O., Bottorff, D.A., Chan, E.Y.W., Stang, S.L., Dunn, R.J. and Stone, J.C. (1998) RasGRP, a Ras guanyl nucleotide-releasing protein with calcium- and diacylglycerol-binding motifs. Science, 280, 1082–1086. [DOI] [PubMed] [Google Scholar]
- Fam N.P., Fan, W.-T., Wang, Z., Zhang, L.-J., Chen, H. and Moran, M.F. (1997) Cloning and characterization of Ras-GRF2, a novel guanine nucleotide exchange factor for Ras. Mol. Cell. Biol., 17, 1396–1406. [DOI] [PMC free article] [PubMed] [Google Scholar]
- Farnsworth C.L., Freshney, N.W., Rosen, L.B., Ghosh, A., Greenberg, M.E. and Feig, L.A. (1995) Calcium activation of Ras mediated by neuronal exchange factor Ras-GRF. Nature, 376, 524–527. [DOI] [PubMed] [Google Scholar]
- Fernandez-Salguero P., et al. (1995)Immune system impairment and hepatic fibrosis in mice lacking the dioxin-binding Ah receptor. Science, 268, 722–726. [DOI] [PubMed] [Google Scholar]
- Fong G.H., Rossant, J., Gertsenstein, M. and Breitman, M.L. (1995) Role of the Flt-1 receptor tyrosine kinase in regulating the assembly of vascular endothelium. Nature, 376, 66–70. [DOI] [PubMed] [Google Scholar]
- Fox C.H. and Cottler-Fox,M. (1993a) In situ hybridization for the detection of HIV RNA in cells and tissues. In Coligan,J., Kruisbeef,A., Margulies,D., Shevach,E. and Strober,W. (eds), Protocols in Immunology. Wiley, New York, NY, pp. 12.8.1–12.8.21. [Google Scholar]
- Fox C.H. and Cottler-Fox,M. (1993b) In situ hybridization in HIV research. Microsc. Res. Tech., 25, 78–84. [DOI] [PubMed] [Google Scholar]
- Gnarra J.R., et al. (1997)Defective placental vasculogenesis causes embryonic lethality in VHL-deficient mice. Proc. Natl Acad. Sci. USA, 94, 102–107. [DOI] [PMC free article] [PubMed] [Google Scholar]
- Guerrero C., Rojas, J.M., Chedid, M., Esteban, L.M., Zimonjic, D.B., Popescu, N.C., Font de Mora, J. and Santos, E. (1996) Expression of alternative forms of Ras exchange factors GRF and SOS1 in different human tissues and cell lines. Oncogene, 12, 1097–1107. [PubMed] [Google Scholar]
- Guillemot F., Nagy, A., Auerbach, A., Rossant, J. and Joyner, A.L. (1994) Essential role of Mash-2 in extraembryonic development. Nature, 371, 333–336. [DOI] [PubMed] [Google Scholar]
- Holt K.H., Kasson, B.G. and Pessin, J.E. (1996) Insulin stimulation of a MEK-dependent but ERK-independent SOS protein kinase. Mol. Cell. Biol., 16, 577–583. [DOI] [PMC free article] [PubMed] [Google Scholar]
- Kiyono M., Satoh, T. and Kaziro, Y. (1999) G protein β γ subunit-dependent Rac-guanine nucleotide exchange activity of Ras-GRF1/CDC25 (Mm) Proc. Natl Acad. Sci. USA, 96, 4826–4831. [DOI] [PMC free article] [PubMed] [Google Scholar]
- Laird P.W., Zijderveld, A., Linders, K., Rudnicki, M.A., Jaenisch, R. and Berns, A. (1991) Simplified mammalian DNA isolation procedure. Nucleic Acids Res., 19, 4293. [DOI] [PMC free article] [PubMed] [Google Scholar]
- Lowy D.R. and Willumsen, B.M. (1993) Function and regulation of Ras. Annu. Rev. Biochem., 62, 851–891. [DOI] [PubMed] [Google Scholar]
- Macara I.G., Lounsbury, K.M., Richards, S.A., McKiernan, C. and Bar-Sagi, D. (1996) The Ras superfamily of GTPases. FASEB J., 10, 625–630. [DOI] [PubMed] [Google Scholar]
- Mattingly R.R. and Macara, I.G. (1996) Phosphorylation-dependent activation of the Ras-GRF/CDC25Mm exchange factor by muscarinic receptors and G-protein β γ subunits. Nature, 382, 268–272. [DOI] [PubMed] [Google Scholar]
- McCarthy S.A., et al. (1997)Rapid phosphorylation of Ets-2 accompanies mitogen-activated protein kinase activation and the induction of heparin-binding epidermal growth factor gene expression by oncogenic Raf-1. Mol. Cell. Biol., 17, 2401–2412. [DOI] [PMC free article] [PubMed] [Google Scholar]
- Nielsen K., Papageorge, A., Vass, W., Willumsen, B. and Lowy, D. (1997) The Ras-specific exchange factors Sos1 (mSos1) and mSos2 are regulated differently: mSos2 containing ubiquitination signals absent in Sos1. Mol. Cell. Biol., 17, 7132–7138. [DOI] [PMC free article] [PubMed] [Google Scholar]
- Nori M., Vogel, U.S., Gibbs, J.B. and Weber, M.J. (1991) Inhibition of v-src-induced transformation by a GTPase-activating protein. Mol. Cell. Biol., 11, 2812–2818. [DOI] [PMC free article] [PubMed] [Google Scholar]
- Okada S. and Pessin, J.E. (1996) Interactions between Src homology (SH)2/SH3 adapter proteins and the guanylnucleotide exchange factor SOS are differentially regulated by insulin and epidermal growth factor. J. Biol. Chem., 271, 25533–25538. [DOI] [PubMed] [Google Scholar]
- Oldham S.M., Cox, A.D., Reynolds, E.R., Sizemore, N.S., Coffey, R.J.J. and Der, C.J. (1998) Ras, but not Src, transformation of RIE-1 epithelial cells is dependent on activation of the mitogen-activated protein kinase cascade. Oncogene, 16, 2565–2573. [DOI] [PubMed] [Google Scholar]
- Pichel J.G., et al. (1996)Defects in enteric innervation and kidney development in mice lacking GDNF. Nature, 382, 73–76. [DOI] [PubMed] [Google Scholar]
- Pierret P., Dunn,R.J. and Stone,J.C. (1998) Anatomical study of the mRNA Ras-GRP (GRF3) expression throughout adult rat brain by in situ hybridization. Mol. Biol. Cell Suppl., 9, 117A. [Google Scholar]
- Porfiri E. and McCormick, F. (1996) Regulation of epidermal growth factor receptor signaling by phosphorylation of the Ras exchange factor hSos1. J. Biol. Chem., 271, 5871–5877. [DOI] [PubMed] [Google Scholar]
- Qian X., Vass, W.C., Papageorge, A.G., Anborgh, P.H. and Lowy, D.R. (1998) N terminus of Sos1 Ras exchange factor: critical roles for the Dbl and pleckstrin homology domains. Mol. Cell. Biol., 18, 771–778. [DOI] [PMC free article] [PubMed] [Google Scholar]
- Quilliam L.A., Khosravi-Far, R., Huff, S.Y. and Der, C.J. (1995) Guanine nucleotide exchange factors: activators of the Ras superfamily of proteins. BioEssays, 17, 395–404. [DOI] [PubMed] [Google Scholar]
- Rinkenberger J.L., Cross, J.C. and Werb, Z. (1997) Molecular genetics of implantation in the mouse. Dev. Genet., 21, 6–20. [DOI] [PubMed] [Google Scholar]
- Rozakis-Adcock M., van der Geer, P., Mbamalu, G. and Pawson, T. (1995) MAP kinase phosphorylation of mSos1 promotes dissociation of mSos1–Shc and Sos1–EGF receptor complexes. Oncogene, 11, 1417–1426. [PubMed] [Google Scholar]
- Shou C., Farnsworth, C.L., Neel, B.G. and Feig, L.A. (1992) Molecular cloning of cDNAs encoding a guanine-nucleotide-releasing factor for Ras p21. Nature, 358, 351–354. [DOI] [PubMed] [Google Scholar]
- Smith M.R., DeGudicibus, S.J. and Stacey, D.W. (1986) Requirement for c-ras proteins during viral oncogene transformation. Nature, 320, 540–543. [DOI] [PMC free article] [PubMed] [Google Scholar]
- Stacey D.W., Roudebush, M., Day, R., Mosser, S.D., Gibbs, J.B. and Feig, L.A. (1991) Dominant inhibitory Ras mutants demonstrate the requirement for Ras activity in the action of tyrosine kinase oncogenes. Oncogene, 6, 2297–2304. [PubMed] [Google Scholar]
- Tanaka M., Gertsenstein, M., Rossant, J. and Nagy, A. (1997) Mash2 acts cell autonomously in mouse spongiotrophoblast development. Dev. Biol., 90, 55–65. [DOI] [PubMed] [Google Scholar]
- Threadgill D.W., et al. (1995)Targeted disruption of mouse EGF receptor: effect of genetic background on mutant phenotype. Science, 269, 230–233. [DOI] [PubMed] [Google Scholar]
- Tognon C.E., Kirk, H.E., Passmore, L.A., Whitehead, I.P., Der, C.J. and Kay, R.J. (1998) Regulation of RasGRP via a phorbol ester-responsive C1 domain. Mol. Cell. Biol., 18, 6995–7008. [DOI] [PMC free article] [PubMed] [Google Scholar]
- Tung P.S., Fam, N.P., Chen, L. and Moran, M.F. (1997) A 54-kDa protein related to ras-guanine nucleotide release factor expressed in the rat exocrine pancreas. Cell Tissue Res., 289, 505–515. [DOI] [PubMed] [Google Scholar]
- Tybulewicz V.L., Crawford, C.E., Jackson, P.K., Bronson, R.T. and Mulligan, R.C. (1991) Neonatal lethality and lymphopenia in mice with a homozygous disruption of the c-abl proto-oncogene. Cell, 65, 1153–1163. [DOI] [PubMed] [Google Scholar]
- Velu T.J., Beguinot, L., Vass, W.C., Willingham, M.C., Merlino, G.T., Pastan, I. and Lowy, D.R. (1987) Epidermal growth factor-dependent transformation by a human EGF receptor proto-oncogene. Science, 238, 1408–1410. [DOI] [PubMed] [Google Scholar]
- Velu T.J., Vass, W.C., Lowy, D.R. and Tambourin, P.E. (1989) Harvey murine sarcoma virus: influence of coding and non-coding sequences on cell transformation in vitro and oncogenicity in vivo. J. Virol., 63, 1384–1392. [DOI] [PMC free article] [PubMed] [Google Scholar]
- Wang D.Z., Hammond, V.E., Abud, H.E., Bertoncello, I., McAvoy, J.W. and Bowtell, D.D. (1997) Mutation in Sos1 dominantly enhances a weak allele of the EGFR, demonstrating a requirement for Sos1 in EGFR signaling and development. Genes Dev., 11, 309–320. [DOI] [PubMed] [Google Scholar]
- Ward J.M. and Devor-Henneman,D.E. (2000) Gestational mortality in genetically-engineered mice: evaluating the extra-embryonal embryonic placenta and membranes. In Ward,J.M., Mahler,J., Maronpot,R.R., Sundberg,J.P. and Frederickson,R. (eds), Pathology of Genetically-Engineered Mice. Iowa State University Press, Ames, IA, in press. [Google Scholar]
- Wasylyk B., Hagman, J. and Gutierrez-Hartmann, A. (1998) Ets transcription factors: nuclear effectors of the Ras–MAP-kinase signaling pathway. Trends Biochem. Sci., 6, 213–216. [DOI] [PubMed] [Google Scholar]
- Willumsen B.M., Vass, W.C., Velu, T.J., Papageorge, A.G., Schiller, J. and Lowy, D.R. (1991) The BPV E5 oncogene can cooperate with ras: identification of a p21 amino acid segment required for transformation by c-rasH but not v-rasH. Mol. Cell. Biol., 11, 6026–6033. [DOI] [PMC free article] [PubMed] [Google Scholar]
- Yamamoto H., Flannery, M.L., Kupriyanov, S., Pearce, J., McKercher, S.R., Henkel, G.W., Maki, R.A., Werb, Z. and Oshima, R.G. (1998) Defective trophoblast function in mice with a targeted mutation of Ets2. Genes Dev., 12, 1315–1326. [DOI] [PMC free article] [PubMed] [Google Scholar]
- Yang B.S., Hauser, C.A., Henkel, G., Colman, M.S., Van Beveren, C., Stacey, K.J., Hume, D.A., Maki, R.A. and Ostrowski, M.C. (1996) Ras-mediated phosphorylation of a conserved threonine residue enhances the transactivation activities of c-Ets1 and c-Ets2. Mol. Cell. Biol., 16, 538–547. [DOI] [PMC free article] [PubMed] [Google Scholar]
- Zhang K., Papageorge, A.G. and Lowy, D.R. (1992) Mechanistic aspects of signaling through Ras in NIH 3T3 cells. Science, 257, 671–674. [DOI] [PubMed] [Google Scholar]