

SYNOPSIS
Objective
We determined the effectiveness of a 23-valent-polysaccharide pneumococcal vaccine (PPV-23) and pneumococcal conjugate vaccine (PCV-7) in reducing adult pneumococcal mortality by comparing historically predicted declines in pneumococcal disease mortality with observed patterns since the introduction of PPV-23 and PCV-7, including analyses of age, gender, and racial/ethnic subgroups.
Methods
We analyzed all deaths registered on U.S. death certificates reporting any site of pneumococcal infection (e.g., meningitis, sepsis, pneumonia, bacteremia, and peritonitis) from 1968 to 2006. We used time-series dynamic linear regression on annual pneumococcal mortality rates to determine the percentage reduction in post-1983 mortality rates for a given increase in PPV-23 vaccination rates and post-2000 mortality rates for a given increase in PCV-7 vaccination rates.
Results
Pneumococcal mortality decreased well before the introduction of PPV-23 in 1983 and again before the introduction of PCV-7 in 2000. The level of PPV-23 vaccination was associated with a direct and significant reduction in adult mortality, especially white female adults ≥65 years of age. In contrast, the level of PCV-7 vaccination in the population was not associated with an indirect and significant reduction in pneumococcal mortality beyond the historical pace of decline.
Conclusions
PPV-23 introduction was associated with a reduction in pneumococcal mortality among older adults ≥65 years of age beyond levels predicted by secular trends, whereas PCV-7 introduction was not. Mortality reduction was not uniformly experienced across the population, revealing the need for additional strategies to reduce pneumococcal mortality in older adults.
The ultimate goal of any vaccination program is the reduction of disease-attributable morbidity and mortality through reduction in disease incidence. Historically, Streptococcus pneumoniae (S. pneumoniae) has been one of the leading causes of vaccine-preventable morbidity and mortality, particularly among infants1,2 and older adults aged ≥65 years. S. pneumoniae causes illnesses ranging from noninvasive infections of the sinuses and middle ear to life-threatening invasive infections of the blood and cerebral spinal fluid. Dual infections of S. pneumoniae and influenza viruses represent an especially dangerous and lethal interaction of pathogens.3
A 23-valent-polysaccharide pneumococcal vaccine (PPV-23) has been available in the U.S. since 1983 and is recommended for all adults ≥65 years of age (as well as younger adults with specific comorbid conditions) to reduce the risk of pneumococcal bacteremia and associated mortality. PPV-23 use has remained low for adults throughout its history. In 2000, a new vaccine (pneumococcal conjugate vaccine [PCV-7], Prevnar® [Wyeth Pharmaceuticals, Madison, New Jersey]) was approved for children, which targeted the seven most common serotypes responsible for bacteremia in U.S. children.4 Of note, the vaccine has been demonstrated to reduce carriage of covered serotypes in children, contributing to herd immunity and reducing pneumococcal disease risk in adults.5–7 The vaccine is administered to infants, who are recommended to receive four doses of vaccine in the first 15 months of life. Initial vaccine shortages limited coverage in the population, but since 2004, vaccination of infants in the U.S. has been nearly universal.8
While there is growing evidence showing a dramatic post-2000 decline in pneumococcal disease incidence among children9 and a smaller decline in some adult populations,10 little evidence exists on the vaccine's immediate and long-term impact on mortality, especially among those ≥65 years of age, the group at highest risk of pneumococcal-related mortality. In this article, we assess the changes in age-specific pneumococcal mortality since introduction of both PPV-23 and PCV-7 and how those changes vary by age, gender, and racial/ethnic subgroups. We specifically focus on mortality in adults ≥65 years of age.
METHODS
Data
We calculated pneumococcal death counts from Mortality Detail Files from 1968 to 2006, containing information on all deaths registered on individual U.S. death certificates transmitted to the National Center for Health Statistics. Pertinent information from the files includes date of death, gender and race/ethnicity of the deceased, age of the deceased at the time of death, and cause of death. Death certificates also record multiple conditions that contributed to the death. Causes are coded using the International Classification of Diseases (ICD), Eighth, Ninth, and 10th Revisions. We aggregated all reported sites of pneumococcal infection (e.g., meningitis, sepsis, pneumonia, bacteremia, and peritonitis) to maximize our sensitivity for capturing all deaths attributed to pneumococcal infection. We counted a death in pneumococcal mortality calculations if the underlying cause of death or any of the entity axis codes8 was a pneumococcal infection.
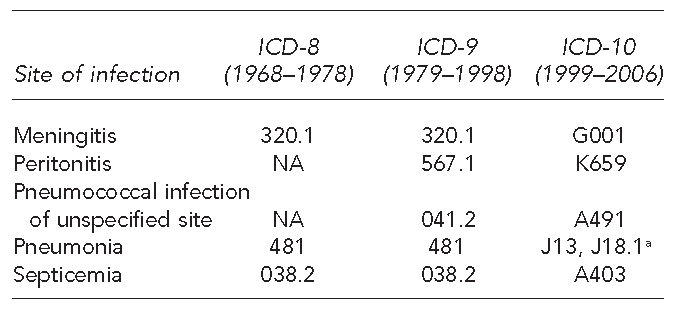
We began our analysis in parallel with the introduction of ICD-8, which was the earliest ICD revision to code sites of pneumococcal infection. Figure 1 shows details on sites of pneumococcal infection and corresponding ICD-8, ICD-9, and ICD-10 codes. We estimated the population at risk from decennial census counts and annual intercensal estimates of the resident population by age, gender, and race/ethnicity.
Figure 1.
International Classification of Diseases codes for pneumococcal infection sites
aThe ICD-9 code for pneumococcal pneumonia includes lobar pneumonia organism unspecified. The ICD-10 code for pneumococcal pneumonia does not include lobar pneumonia organism unspecified, which instead is coded as J18.1.
ICD-8, −9, −10 = International Classification of Diseases, Eighth, Ninth, or 10th Revision
We estimated PCV-7 vaccine utilization from the 2001–2007 National Immunization Survey (NIS). The NIS is a large, nationally representative, list-assisted telephone survey followed by a mailed survey to children's immunization providers. Specifically, we used the NIS to estimate the proportion of children aged 19–36 months who received at least one dose of PCV-7. A single dose of the vaccine has been found to be highly efficacious, with small increases in effectiveness for additional doses.11
We estimated PPV-23 vaccine utilization from the 1992–2007 Behavioral Risk Factor Surveillance System (BRFSS). The BRFSS is a large, nationally representative telephone survey of more than 350,000 adults that is conducted annually. Specifically, we used the BRFSS to estimate the proportion of the population who ever received the pneumococcal vaccine. In all the analyses presented in this article, we incorporated population projection weights provided by the surveys. Both the NIS and BRFSS use a rigorous and multistep process to estimate population projection weights that correct for differences in the probability of selection due to nonresponse and noncoverage errors; adjust for variables of age, race/ethnicity, and gender between the sample and the entire population; and allow generalization of the findings to the whole population.12,13
Statistical analyses
Mortality rates.
We defined mortality rates as the ratio of death counts to population at risk for a given age and year. In each year, we calculated the crude pneumococcal mortality rate and then standardized it to a common age structure to allow comparison.14 We arbitrarily chose the white female age distribution in 2005 as the standardized population. We calculated subgroup-specific crude mortality rates for each year and also standardized to the white male age distribution in 1990.
Bootstrap procedure.
To account for sampling uncertainty in the NIS and BRFSS, we employed a general bootstrap resampling procedure.15 For each of the 1,000 iterations of the bootstrap, we first sampled the NIS data with replacement, where sampling weights were equal to the original sample weights. The bootstrapped sample size was equal to the total original sample size for all years, NNIS = 209,361. For each year, we calculated the weighted proportion of children aged 19–36 months who received at least one PCV-7 vaccination. Second, to calculate weighted proportions of adults receiving PPV-23, we also sampled the BRFSS data with replacement, where sampling weights were again equal to the original sample weights. Again, the bootstrapped sample size was equal to the total original sample size for all years, NBRFSS = 3,247,212. For each year, we calculated the age group-specific weighted proportion of respondents who reported ever receiving the PPV-23 vaccine in their lifetime.
The PPV-23 and PCV-7 vaccination rate before their respective introductions in 1983 and 2000 were equal to zero. The BRFSS began collecting data on PPV-23 vaccination rates in 1992. To account for the missing PPV-23 vaccination rates between 1983 and 1991, we employed multiple imputation techniques16 that allowed for the incorporation of prior knowledge and assumptions. Our prior knowledge was that PPV-23 rates before their introduction must have been zero. Our underlying assumption was that PPV-23 vaccination rates increased monotonically and gradually between 1983 and 1991. Using this multiple imputation technique, we were able to consider the many possibilities in which PPV-23 uptake slowly increased from 1983 to 1991. For each iteration of the bootstrap, we imputed the missing data (1983–1991) of each cross-section of age group-specific vaccination rates, assuming the data were missing at random, conditional on the imputation model. Finally, we also estimated PPV-23 coverage for gender and racial/ethnic subgroups for each bootstrap iteration.
Statistical modeling.
First, to formally assess reductions in overall pneumococcal mortality after the introduction of PPV-23, we employed standard time-series methodology common to analysis of mortality rates.17 In particular, we used a class of time-series models called the dynamic regression model with autocorrelated disturbances. Formally, the first model is:
where ln ma,t is the natural logarithm of the pneumococcal mortality rate for age group a at time t; Va,t is the impulse response weights of PPVa,t vaccination rates for age group a and time t; Ca is the deterministic time trend for age group a; and Na,t is the autocorrelation disturbance for age group a and time t. We modeled Na,t as an autoregressive integrated moving average (0,1,1) process, also commonly known as an exponentially weighted moving average process. We took the natural logarithm of pneumococcal mortality to stabilize the variance and take its difference to yield a stationary time series. Also, we selected a contemporaneous lag for the impulse response function of PPV-23. This set of dynamic regression models observed 1968–1999 mortality data and 1968–1999 PPV-23 vaccination levels (from the bootstrapping described previously).
Our outcome of interest was the contemporaneous impulse response weight of PPVa,t for age group a and time t, Va,t. In our case, the impulse response weight was equivalent to the relative reduction in the pneumococcal mortality rate given a 1% increase in PPV-23 vaccination rates for age group a.
Second, to formally assess the contribution of PCV-7, we fit another set of dynamic regression models with autocorrelated disturbances. Formally, the second model is:
where ma,t, Va,t, Ca, and Na,t were similarly defined. We again modeled Na,t as an autoregressive integrated moving average (0,1,1) process. Our outcome of interest was the contemporaneous impulse response weight of PCVa,t for age group a and time t, ηa,t. In our case, the impulse response weight was equivalent to the relative reduction in the pneumococcal mortality rate given a 1% increase in PCV-7 vaccination in the eligible population. This set of dynamic regression models observed 1968–2006 mortality data and 1968–2006 PPV-23 and PCV-7 vaccination levels (from the bootstrapping described previously) to assess the effect of PCV-7 vaccination levels on observed mortality. We also plotted predicted mortality for the 2000–2006 time period and visually compared these predictions to observed mortality.
Finally, we performed both sets of analyses disaggregated by gender and race/ethnicity. In the first set of models, which formally assessed the contribution of PPV-23, we used gender, race/ethnicity, and age group-specific PPV-23 vaccination levels, assuming there was no herd immunity against pneumococcal disease among the adult population. In the second set of models, which formally assessed the contribution of PCV-7, we used gender, race/ethnicity, age group-specific PPV-23 vaccination levels, and overall eligible population levels of PCV-7 vaccination, as the PCV-7 vaccination provided adult protection through a form of herd immunity reflective of the overall level of vaccination in the pediatric population.
The University of Pennsylvania Institutional Review Board (IRB) determined this research met eligibility criteria for IRB review exemption.
RESULTS
Trends in PPV-23 and PCV-7 vaccination rates
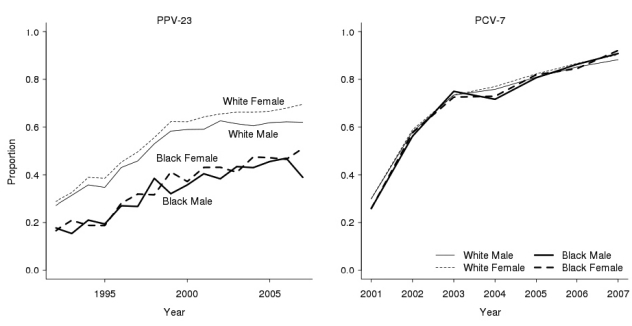
The proportion of adults ≥65 years of age who ever received the PPV-23 vaccination gradually increased since 1983, although the proportion differed considerably by gender and race/ethnicity (Figure 2, left panel). By 2007, 70% of white women (95% confidence interval [CI] 69, 70) and 62% of white men (95% CI 61, 63) reported ever receiving the PPV-23 vaccine. Yet, the proportion was only 51% for black women (95% CI 50, 52) and 39% for black men (95% CI 37, 41) in the same year. Conversely, we did not observe any statistically significant racial/ethnic or gender disparities in the proportion of children aged 19–36 months who received at least one PCV-7 vaccine (Figure 2, right panel). The proportion quickly grew from <30% in 2001 (95% CI 29, 30), the first full year of availability, to >90% in 2007 (95% CI 90, 91).
Figure 2.
PPV-23 and PCV-7 vaccination rates over time, U.S., for adults ≥65 years of age, 1992–2007 (PPV-23), and children 19–36 months of age, 2001–2007 (PCV-7)a
aThe left panel shows the proportion of adults ≥65 years of age who reported ever receiving the PPV-23 vaccine by racial/ethnic group and gender. The right panel shows the proportion of 19–36-month-olds who received at least one PCV-7 vaccination by racial/ethnic group and gender. PPV-23 data are from the 1992–2007 Behavioral Risk Factor Surveillance System; PCV-7 data are from the 2001–2007 National Immunization Surveys.
PPV-23 = 23-valent-polysaccharide pneumococcal vaccine
PCV-7 = pneumococcal conjugate vaccine
Trends in pneumococcal mortality
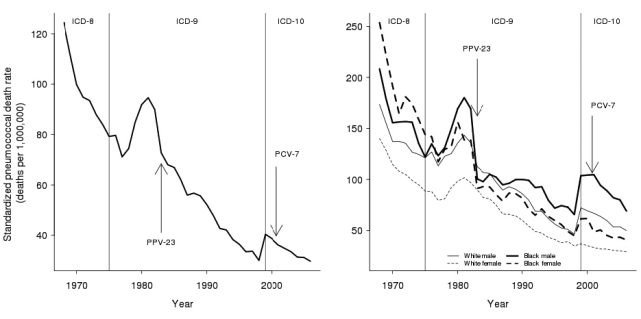
In 1968, the standardized crude pneumococcal death rate in the U.S. was 124 deaths per one million person-years. As depicted in Figure 3 (left panel), the mortality rate declined sharply after 1968 until 1977, increased from 1978 to 1981, and subsequently declined. By 1982, the mortality rate was 90 deaths per one million person-years. During the years after the introduction of PPV-23 and before the introduction of PCV-7 (1983–1999), the annual rate declined from 73 to 40 deaths per one million person-years. After the availability of both vaccines in 2000, the standardized annual death rate declined from 39 to 30 deaths per one million person-years. A sharp increase in the standardized annual death rate occurred between 1998 (30 deaths per one million person-years) and 1999 (40 deaths per one million person-years), which we attributed largely to the coding change from ICD-9 to ICD-10.
Figure 3.
Age and gender standardized pneumococcal death rate over time, U.S., 1968–2006a
aThe left panel shows the crude pneumococcal death rate, standardized to the white female 2005 population. The introduction of PPV-23 in 1983 and PCV-7 in 2000 are noted with arrows. The dashed vertical lines indicate the International Classification of Diseases version used. The right panel shows the standardized crude death rate for each racial/ethnic group and gender, also standardized to the white female 2005 population. Data are from the National Center for Health Statistics Mortality Detail Files and U.S. Census Bureau intercensal population estimates.
ICD-8, −9, −10 = International Classification of Diseases, Eighth, Ninth, or 10th Revision
PPV-23 = 23-valent-polysaccharide pneumococcal vaccine
PCV-7 = pneumococcal conjugate vaccine
Trends in pneumococcal mortality for older adults
First, we formally assessed the reduction in overall pneumococcal mortality attributable to PPV-23 vaccination. From 1968 to 1982, prior to the introduction of PPV-23, adults ≥65 years of age experienced substantial declines in annual pneumococcal mortality (Figure 4). After 1983 and the introduction of PPV-23, we observed the largest percentage reduction in pneumococcal mortality rates for a given increase in PPV-23 vaccination rate in those aged 65–69 years. Each 1% increase in PPV-23 was associated with a 1.18% relative reduction in annual mortality for this age group (95% CI –1.79, –0.31). We observed declining, though not significant, reductions in adults ≥70 years of age (Table 1).
Figure 4.
Pneumococcal mortality after introduction of PPV-23 and PCV-7 for people aged 65–69, 70–74, 75–79, 80–84, and ≥85 years, U.S., 1968–2006a
aObserved pneumococcal death rates are denoted by O. The introduction of PPV-23 in 1983 and PCV-7 in 2000 are noted with arrows. The dashed vertical lines indicate the International Classification of Diseases version used. The shaded regions represent the 95% confidence intervals, and the solid line represents the median prediction based on dynamic linear regression models of age group-specific pneumococcal mortality.
ICD-8, −9, −10 = International Classification of Diseases, Eighth, Ninth, or 10th Revision
PPV-23 = 23-valent-polysaccharide pneumococcal vaccine
PCV-7 = pneumococcal conjugate vaccine
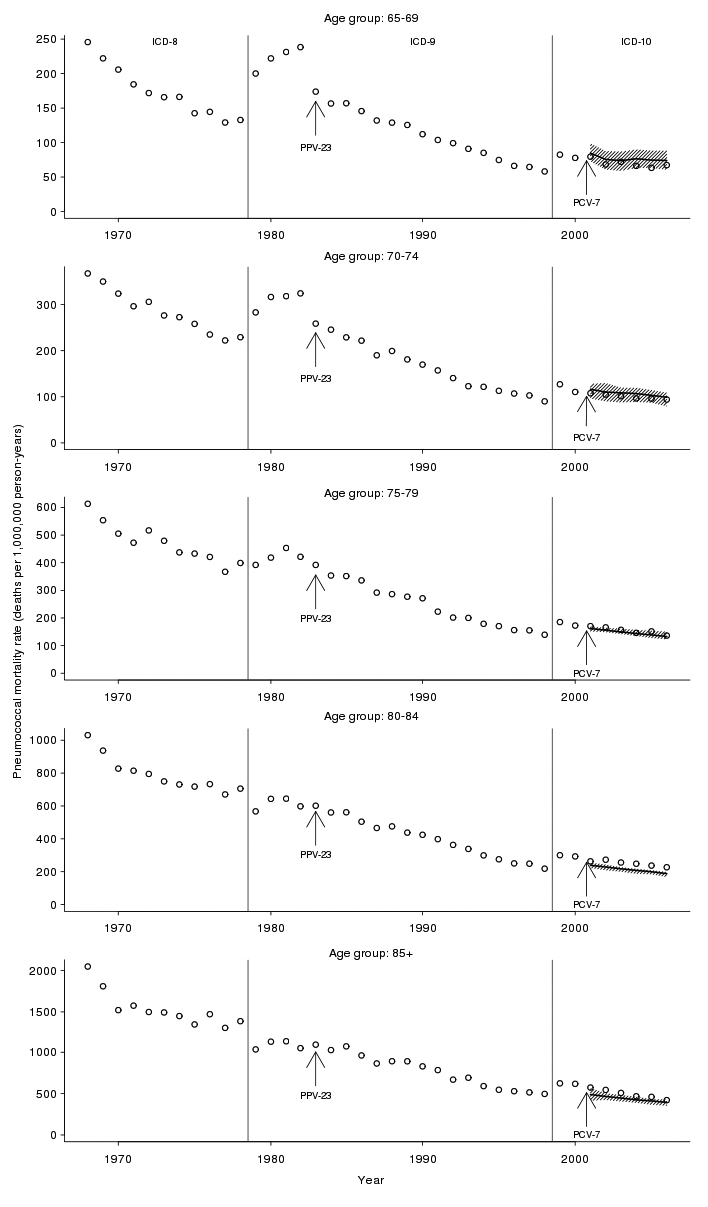
Table 1.
Percentage reduction in mortality rate attributable to a 1% increase in PPV-23 vaccination, U.S., 1983–1999

PPV-23 = 23-valent-polysaccharide pneumococcal vaccine
CI = confidence interval
Second, we examined observed vs. predicted mortality after PCV-7 introduction. After 2000, adults ≥65 years of age did not experience significant reductions in pneumococcal deaths beyond what we would have expected based on the historical time-trend and age group-specific PPV-23 vaccination rates (Figure 4). For example, among 70–74-year-olds in 2004, we observed 101 deaths per one million person-years while expecting 109 deaths per one million person-years (95% CI 88, 119).
Third, we formally assessed the reduction in overall pneumococcal mortality attributable to PCV-7 vaccination. For the age groups 65–69, 70–74, 75–79, and 80–84 years, we estimated no significant percentage reduction in post-2000 pneumococcal mortality rates for a given increase in PCV-7 vaccination rates. For those aged ≥85 years, we estimated that each 1% increase in PCV-7 vaccination was associated with a 0.08% relative reduction in annual pneumococcal mortality (95% CI –0.10, –0.02) (Table 2).
Table 2.
Percentage reduction in mortality rate attributable to a 1% increase in PCV-7 vaccination, U.S., 2000–2006

PCV-7 = pneumococcal conjugate vaccine
CI = confidence interval
Trends in pneumococcal mortality by gender and racial/ethnic subgroups
As depicted in Figure 3 (right panel), the standardized crude pneumococcal mortality rate differed considerably by race/ethnicity and gender. The rate for black females declined from 254 deaths per one million person-years in 1968 to 41 deaths per one million person-years in 2006, an 84% reduction. In contrast, the rate for black males declined from 208 to 69 deaths per one million person-years in the same time frame, a 67% reduction.
The percentage reduction in 1983–1999 mortality rates for a given increase in PPV-23 vaccination rate was highest for white females ≥75 years of age. For every 1% increase in PPV-23 vaccination, we estimated a relative reduction in mortality of –0.34% for those aged 75–79 years (95% CI –0.75, –0.08); –0.41% for those aged 80–84 years (95% CI –0.77, –0.17); and –0.28% for those ≥85 years of age (95% CI –0.61, –0.01) for white females. Among black and white males and black females, we found no age groups that experienced a significant relative reduction in mortality for each 1% increase in their age- and racial/ethnic subgroup-specific PPV-23 vaccination rates (Table 1).
The percentage reduction in post-2000 mortality rates for a given increase in PCV-7 vaccination rate exhibited no discernable patterns across age by gender or race/ethnicity (Table 2). The relative reduction in pneumococcal mortality, for every 1% increase in PCV-7 vaccination among eligible children in the population, was significant for white women aged 65–69 years and white and black males ≥85 years of age. We estimated the relative reduction was –0.18% for white males ≥85 years of age (95% CI –0.25, –0.12) and –0.13% for black males ≥85 years of age (95% CI –0.24, –0.06).
DISCUSSION
This study had two main findings. First, we demonstrated substantial population-level declines in pneumococcal-attributable mortality for adults during the last four decades in the United States. Second, we observed significant impacts of the introduction of PPV-23 and PCV-7 on adult pneumococcal mortality rates; however, the impacts were heterogeneous with regard to age, gender, and racial/ethnic subgroups. We found significant post-PPV-23 reductions in pneumococcal mortality, especially among white females. We found no obvious patterns in post-PCV-7 reductions in pneumococcal mortality across age for gender and racial/ethnic subgroups.
Of special note were two sharp increases in the standardized pneumococcal death rate: the first in the early 1980s and the second between 1998 and 1999. The first sharp increase may have had an important connection to the rise of human immunodeficiency virus (HIV) infections, an important comorbid condition. The second sharp increase occurred when coding changed from ICD-9 to ICD-10.
Few studies have examined patterns in pneumococcal mortality in the elderly over a long time period. Between 1998 and 2003, a significant decline in adult pneumococcal mortality (e.g., meningitis, bacteremia without focus, and pneumonia with bacteremia) was observed in the Centers for Disease Control and Prevention Active Bacterial Core Surveillance.18 Gradually declining standardized crude pneumococcal death rates were observed between 1989 and 1998 in California.19 In contrast to our national-level results, the state-level death rate during the time period in that study was slightly higher for white people than for black people. Other studies have also reported that PCV-7 introduction was associated with a significant decrease in the number of pneumococcal meningitis-related in-hospital deaths20 and invasive pneumococcal disease case-fatality21 among those ≥65 years of age.
Previous work has identified declines in pneumococcal disease risk across age, gender, and racial/ethnic subgroups, particularly since the introduction of PCV-7.18,20,22–24 Our study complements that work by focusing on mortality. The finding that the observed declines in disease risk following PCV-7 vaccination were not accompanied by similar declines in mortality highlights the importance of studying both disease and mortality rates in assessing the impact of vaccines on population health. Disease incidence may be a more sensitive indicator of vaccine effect than case fatality, or the PCV-7 vaccine may have differential effects on incidence and mortality.
In addition to PPV-23 and PCV-7 vaccination levels, several other population-level factors are known to influence pneumococcal disease incidence and case fatality.25 These factors include population variation in key comorbid conditions18 (especially chronic heart and lung diseases and immunodeficiencies such as HIV infection), and annual variation in activity of co-pathogens, especially influenza. We did not have data on these other determinants of disease risk and case fatality and, therefore, could not assess the independent contribution of these other factors to the observed mortality trends.
Limitations
This study had several important limitations. First, there may have been misclassification and attribution bias in death certificate data that affected the estimation of pneumococcal mortality rates. Changes in ICD coding between 1968 and 2006 may have led to differential classification of pneumococcal mortality over time. One important example is lobar pneumonia organism unspecified, which was included as part of pneumococcal pneumonia in ICD-9, but receives a separate code in ICD-10. We attempted to maintain a consistent definition of pneumococcal death over time by including lobar pneumonia organism unspecified. We partially mitigated the misclassification and attribution bias by focusing on the relative comparison of mortality trends, rather than absolute levels. We were also unable to determine vaccination and chronic disease histories from death certificate information, both of which are important predictors of pneumococcal disease mortality.
Second, the accuracy of cause of death and entity axis codes written on death certificates is ultimately based on physician judgment regarding the events and conditions leading to death.
Third, estimation of exposure in the calculation of pneumococcal mortality rates may also have been affected by age misreporting and census undercounts, especially of elderly black people.26 Differential undercounts between elderly black males and females were likely much smaller. Fourth, we noted potential bias associated with the NIS and BRFSS random-digit-dialing design, especially potential non-telephone coverage bias.27,28 Finally, there was potential difficulty in recalling PPV-23 vaccination that led to greater uncertainty in the estimation of utilization. We partially mitigated this uncertainty by using bootstrap resampling methods.
CONCLUSIONS
In a broader context, this work provides a modern example in the longstanding debate over contributions to mortality decline. McKeown argued that historical mortality declines were more the result of broad economic and social conditions rather than specific medical advances or public health initiatives.29–31 McKinlay and McKinlay32 provided evidence in support of McKeown's theory in their study of the 10 most common infectious diseases between 1900 and 1973. In our case, PPV-23 and PCV-7 represent the most recent health-enhancing measures against pneumococcal disease. Despite the rapid and near-universal uptake of PCV-7 and its dramatic impact on pediatric disease, the benefit has not been as clear in older adults.
The results of this study speak to broader questions about immunization. In some cases, reductions in the incidence of infection may not parallel reductions in population mortality due to the infection. For example, in the case of pneumococcal vaccines, the emergence of non-vaccine serotypes33 may lead to higher severity illness in the population,34 offsetting any mortality benefit due to overall reduction in vaccine incidence, especially in adults. One important example in pneumococcal disease is the emergence of serotype 19A as the predominant invasive pneumococcal serotype.35
The analysis of other racial/ethnic subgroups beyond white and black Americans is important to our understanding of pneumococcal disease and mortality at a population level. The difference in pneumococcal disease mortality reductions among various population subgroups may speak to the importance of social conditions in pneumococcal disease and mortality. If elderly minority males and females are at higher risk of chronic and comorbid conditions, they may be more vulnerable to pneumococcal mortality once they experience pneumococcal disease. Knowledge of pneumococcal disease and access to high-quality health care may also contribute to differences in the probability of pneumococcal mortality given pneumococcal disease. As advancements occur in pneumococcal vaccination and in treatment of pneumococcal infection, those population subgroups that command greater socioeconomic resources may be better able to benefit from these advancements.
Understanding these population tradeoffs may help focus vaccine policy decisions in terms of appropriate target groups for vaccination and how best to monitor the benefits of vaccine programs. Moreover, our results point to differential impacts of vaccines on gender and racial/ethnic groups, suggesting new directions for vaccine development and deployment. The vaccination of children, carriers of S. pneumoniae, may not have provided additional protection against pneumococcal mortality for older adults. A renewed focus on PPV-23 vaccination, or perhaps a new pneumococcal vaccine, may enable further pneumococcal mortality reduction beyond its current pace. Such a renewed focus may also lessen the burden of influenza viruses, which form an especially dangerous interaction with pneumococcal disease.3,36 Pneumococcal disease remains a major cause of vaccine-preventable mortality, and future strategies are needed to further reduce the burden of this disease.
Acknowledgments
The authors thank Robert Aronowitz, David Asch, Junna Hashimoto, Kosuke Imai, Valerie Lewis, Matthew Moore, and Jason Schnittker for their helpful comments and suggestions; and the Robert Wood Johnson Foundation Health – Society Scholars and Robert Wood Johnson Clinical Scholars programs for their financial support. Financial support came from the University of Pennsylvania Research and Education Fund.
REFERENCES
- 1.Vaccine preventable deaths and the global immunization vision and strategy, 2006–2015. MMWR Morb Mortal Wkly Rep. 2006;55(18):511–5. [PubMed] [Google Scholar]
- 2.World Health Organization. Pneumococcal conjugate vaccine for childhood immunization—WHO position paper. Wkly Epidemiol Rec. 2007;82:93–104. [PubMed] [Google Scholar]
- 3.McCullers JA. Insights into the interaction between influenza virus and pneumococcus. Clin Microbiol Rev. 2006;19:571–82. doi: 10.1128/CMR.00058-05. [DOI] [PMC free article] [PubMed] [Google Scholar]
- 4.American Academy of Pediatrics, Committee on Infectious Diseases. Policy statement: recommendations for the prevention of pneumococcal infections, including the use of pneumococcal conjugate vaccine (Prevnar), pneumococcal polysaccharide vaccine, and antibiotic prophylaxis. Pediatrics. 2000;106:362–6. doi: 10.1542/peds.106.2.362. [DOI] [PubMed] [Google Scholar]
- 5.Kyaw MH, Lynfield R, Schaffner W, Craig AS, Hadler J, Reingold A, et al. Effect of introduction of the pneumococcal conjugate vaccine on drug-resistant streptococcus pneumoniae. N Engl J Med. 2006;354:1455–63. doi: 10.1056/NEJMoa051642. [DOI] [PubMed] [Google Scholar]
- 6.Metlay JP, Fishman NO, Joffe M, Edelstein PH. Impact of pediatric vaccination with pneumococcal conjugate vaccine on the risk of bacteremic pneumococcal pneumonia in adults. Vaccine. 2006;24:468–75. doi: 10.1016/j.vaccine.2005.07.095. [DOI] [PubMed] [Google Scholar]
- 7.Whitney CG, Moore MR. Direct and indirect effectiveness and safety of pneumococcal conjugate vaccine in practice. In: Riber GR, Klugman KP, Makela PH, editors. Pneumococcal vaccines: the impact of conjugate vaccine. Washington: ASM Press; 2008. pp. p. 353–68. [Google Scholar]
- 8.Redelings MD, Wise M, Sorvillo F. Using multiple cause-of-death data to investigate associations and causality between conditions listed on the death certificate. Am J Epidemiol. 2007;166:104–8. doi: 10.1093/aje/kwm037. [DOI] [PubMed] [Google Scholar]
- 9.Lin PL, Michaels MG, Janosky J, Ortenzo M, Wald ER, Mason EO., Jr Incidence of invasive pneumococcal disease in children 3 to 36 months of age at a tertiary care pediatric center 2 years after licensure of the pneumococcal conjugate vaccine. Pediatrics. 2003;111(4 Pt 1):896–9. doi: 10.1542/peds.111.4.896. [DOI] [PubMed] [Google Scholar]
- 10.Flannery B, Heffernan RT, Harrison LH, Ray SM, Reingold AL, Hadler J, et al. Changes in invasive pneumococcal disease among HIV-infected adults living in the era of childhood pneumococcal immunization. Ann Intern Med. 2006;144:1–9. doi: 10.7326/0003-4819-144-1-200601030-00004. [DOI] [PubMed] [Google Scholar]
- 11.Whitney CG, Pilishvili T, Farley MM, Schaffner W, Craig AS, Lynfield R, et al. Effectiveness of seven-valent pneumococcal conjugate vaccine against invasive pneumococcal disease: a matched case-control study. Lancet. 2006;368:1495–502. doi: 10.1016/S0140-6736(06)69637-2. [DOI] [PubMed] [Google Scholar]
- 12.Smith P, Hoaglin D, Battaglia M. Statistical methodology of the National Immunization Survey, 1994–2002. Vital Health Stat 2. 2005;(138) [PubMed] [Google Scholar]
- 13.Centers for Disease Control and Prevention (US) Behavioral Risk Factor Surveillance System operational and user's guide: version 3.0. Atlanta: CDC; 2006. [Google Scholar]
- 14.Preston SH, Heuveline P, Guillot M. Demography: measuring and modeling population processes. Malden (MA): Blackwell Publishers Ltd.; 2001. [Google Scholar]
- 15.Efron B, Tibshirani RJ, editors. An introduction to the bootstrap. 1st ed. New York: Chapman – Hall/CRC; 1994. [Google Scholar]
- 16.King G, Honaker J, Joseph A, Scheve K. Analyzing incomplete political science data: an alternative algorithm for multiple imputation. Am Poli Sci Rev. 2001;95:49–69. [Google Scholar]
- 17.Kis M. Time series models on analyzing mortality rates and acute childhood lymphoid leukaemia. In: Engelbrecht R, Geissbuhler A, Lovis C, Mihalas G, editors. Connecting medical informatics and bio-informatics; Proceedings of MIE2005, The XIXth International Congress of the European Federation for Medical Informatics. Studies in Health Technology and Informatics; 2005. pp. 15–20. [PubMed] [Google Scholar]
- 18.Lexau CA, Lynfield R, Danila R, Pilishvili T, Facklam R, Farley MM, et al. Changing epidemiology of invasive pneumococcal disease among older adults in the era of pediatric pneumococcal conjugate vaccine. JAMA. 2005;294:2043–51. doi: 10.1001/jama.294.16.2043. [DOI] [PubMed] [Google Scholar]
- 19.Redelings MD, Sorvillo F, Simon P. A population-based analysis of pneumococcal disease mortality in California, 1989–1998. Public Health Rep. 2005;120:157–64. doi: 10.1177/003335490512000209. [DOI] [PMC free article] [PubMed] [Google Scholar]
- 20.Tsai CJ, Griffin MR, Nuorti JP, Grijalva CG. Changing epidemiology of pneumococcal meningitis after the introduction of pneumococcal conjugate vaccine in the United States. Clin Infect Dis. 2008;46:1664–72. doi: 10.1086/587897. [DOI] [PMC free article] [PubMed] [Google Scholar]
- 21.Tsigrelis C, Tleyjeh IM, Lahr BD, Nyre LM, Virk A, Baddour LM. Decreases in case-fatality and mortality rates for invasive pneumococcal disease in Olmsted County, Minnesota, during 1995–2007: a population-based study. Clin Infect Dis. 2008;47:1367–71. doi: 10.1086/592970. [DOI] [PMC free article] [PubMed] [Google Scholar]
- 22.Kellner JD, Church DL, MacDonald J, Tyrrell GJ, Scheifele D. Progress in the prevention of pneumococcal infection. CMAJ. 2005;173:1149–51. doi: 10.1503/cmaj.051150. [DOI] [PMC free article] [PubMed] [Google Scholar]
- 23.Black S, Shinefield H, Baxter R, Austrian R, Bracken L, Hansen J, et al. Postlicensure surveillance for pneumococcal invasive disease after use of heptavalent pneumococcal conjugate vaccine in Northern California Kaiser Permanente. Pediatr Infect Dis J. 2004;23:485–9. doi: 10.1097/01.inf.0000129685.04847.94. [DOI] [PubMed] [Google Scholar]
- 24.Invasive pneumococcal disease in children 5 years after conjugate vaccine introduction—eight states, 1998–2005. MMWR Morb Mortal Wkly Rep. 2008;57(6):144–8. published erratum appears in MMWR Morb Mortal Wkly Rep 2008;57(9):237. [PubMed] [Google Scholar]
- 25.Sisk JE, Whang W, Butler JC, Sneller VP, Whitney CG. Cost-effectiveness of vaccination against invasive pneumococcal disease among people 50 through 64 years of age: role of comorbid conditions and Race. Ann Intern Med. 2003;138:960–8. doi: 10.7326/0003-4819-138-12-200306170-00007. [DOI] [PubMed] [Google Scholar]
- 26.Clogg CC, Massagli MP, Eliason SR. Population undercount and social science research. Soc Indicators Res. 1989;21:559–98. [Google Scholar]
- 27.Mokdad AH. The Behavioral Risk Factor Surveillance System: past, present, and future. Annu Rev Public Health. 2009;30:43–54. doi: 10.1146/annurev.publhealth.031308.100226. [DOI] [PubMed] [Google Scholar]
- 28.Smith PJ, Battaglia MP, Huggins VJ, Hoaglin DC, Roden A, Khare M, et al. Overview of the sampling design and statistical methods used in the National Immunization Survey. Am J Prev Med. 2001;20(4 Suppl):17–24. doi: 10.1016/s0749-3797(01)00285-9. [DOI] [PubMed] [Google Scholar]
- 29.McKeown T, Brown RG. Medical evidence related to English population changes in the eighteenth century. Popul Stud. 1955;9:119–41. [Google Scholar]
- 30.McKeown T, Record RG. Reasons for the decline of mortality in England and Wales during the nineteenth century. Popul Stud. 1962;16:94–122. [PubMed] [Google Scholar]
- 31.McKeown T, Record RG, Turner RD. An interpretation of the decline of mortality in England and Wales during the twentieth century. Popul Stud. 1975;29:391–422. [PubMed] [Google Scholar]
- 32.McKinlay JB, McKinlay SM. The questionable contribution of medical measures to the decline of mortality in the United States in the twentieth century. Milbank Mem Fund Q Health Soc. 1977;55:405–28. [PubMed] [Google Scholar]
- 33.Hicks LA, Harrison LH, Flannery B, Hadler JL, Schaffner W, Craig AS, et al. Incidence of pneumococcal disease due to non-pneumococcal conjugate vaccine (PCV7) serotypes in the United States during the era of widespread PCV7 vaccination, 1998–2004. J Infect Dis. 2007;196:1346–54. doi: 10.1086/521626. [DOI] [PubMed] [Google Scholar]
- 34.Singleton RJ, Hennessy TW, Bulkow LR, Hammitt LL, Zulz T, Hurlburt DA, et al. Invasive pneumococcal disease caused by nonvaccine serotypes among Alaska Native children with high levels of 7-valent pneumococcal conjugate vaccine coverage. JAMA. 2007;297:1784–92. doi: 10.1001/jama.297.16.1784. [DOI] [PubMed] [Google Scholar]
- 35.Moore MR, Gertz RE, Jr, Woodbury RL, Barkocy-Gallagher GA, Schaffner W, Lexau C, et al. Population snapshot of emergent Streptococcus pneumoniae serotype 19A in the United States, 2005. J Infect Dis. 2008;197:1016–27. doi: 10.1086/528996. [DOI] [PubMed] [Google Scholar]
- 36.Klugman KP, Chien YW, Madhi SA. Pneumococcal pneumonia and influnza: a deadly combination. Vaccine. 2009;27(Suppl 3):C9–14. doi: 10.1016/j.vaccine.2009.06.007. [DOI] [PubMed] [Google Scholar]