

Abstract
We offer a new means of noninvasively assessing mean microvessel segment length and radius after ischemic stroke. This method involves measuring changes in T2 and T2* after injecting an intravascular superparamagnetic iron oxide contrast agent and result was verified using laser scanning confocal microscopy (LSCM) of both normal brain tissue and the ischemic recovery region. Embolic stroke was induced in 8 male Wistar rats and magnetic resonance imaging (MRI) performed 1 day and 6 weeks later. On MRI taken at 6 weeks, MRI of the recovery region revealed a significant increase in mean vessel size index (VSI) (5.75 ± 0.54 vs 4.81 ± 0.39 μm; p < 0.001) and decrease in mean segment length (MSL) (16.61 ± 2.33 vs 26.52 ± 3.20 μm; p < 0.001) compared to the normal contralateral hemisphere, comparable with published values. There was also a significant correlation between MSL and VSI measured by MRI vs LSCM in the recovery region and normal contralateral hemisphere (p < 0.001). Our data suggest that a) morphological changes in the microvasculature can be measured noninvasively using MRI, and b) both MRI and LSCM give comparable information about both of these important parameters.
Keywords: Embolic Stroke, MRI, Brain Ischemia, Brain Imaging, Animal Models
1. Introduction
Experimental models of stroke confirm that angiogenesis has therapeutic role after focal cerebral ischemia (Cramer and Chopp, 2000; Cramer et al., 1997; Krupinski et al., 1994; Zhang et al., 1999; Zhang et al., 2000). Stroke patients with a higher density of blood vessels have reduced morbidity and survive longer (Cramer and Chopp, 2000; Cramer et al., 1997; Krupinski et al., 1994; Slevin et al., 2000). Angiogenesis in the penumbra is supported by functional imaging data on stroke patients showing increased cerebral blood flow and metabolism in the tissue surrounding focal brain infarcts (Cramer et al., 1997; Krupinski et al., 1994; Slevin et al., 2000). Our current understanding of treatment induced angiogenesis after stroke has been derived mainly from regional measurements of segment number, diameter, length and density of microvessels using histological and immunohistological methods in rats (Zhang et al., 2005; Zhang et al., 2002a). However, these techniques are highly invasive and do not allow dynamic in vivo assessment; moreover, only one measurement can be performed per animal. MRI has demonstrated a promising potential for detection of angiogenesis both in tumors (Brasch and Turetschek, 2000; Hawighorst et al., 1998; Pathak et al., 2001) and stroke following neurorestorative treatment (Jiang et al., 2005) by measuring cerebral blood flow (CBF) and volume (CBV) as well as vascular permeability. However, these MRI measurements are only indirect indices of angiogenesis and may have inherent flaws; for example, an increase in vessel diameter may result in a higher value for CBV that does not necessarily reflect a greater number of vessels as determined by mean vascular density (MVD). Direct measurement of macrovessel structure parameters such as MVD, mean segment length (MSL) and vessel size index (VSI) could provide valuable information about the development of angiogenesis. Quantitative methods of measuring MVD and VSI have been proposed (Troprès et al., 2004; Wu et al., 2004), based on changes in the transverse relaxation rate (ΔR2 and ΔR2*) [see Theory below] due to spin-spin interaction and heterogeneity of the local magnetic field caused by contrast injection, respectively (Dennie et al., 1998). ΔR2*/ΔR2 is a dimensionless ratio that depends on the vessel size distribution, water diffusion coefficient, and contrast concentration (Jensen and Chandra, 2000), which can be difficult to estimate accurately. For that reason (Jensen and Chandra, 2000) proposed the quantity Q (expressed in sec-⅓), which is sensitive to microvessel density and size. However, MRI measurements of MVD and VSI have focused on tumor research, and only a few groups have tried to detect angiogenesis during stroke recovery (Bosomtwi et al., 2008; Lin et al., 2008), nor has MRI been used to estimate MSL to our knowledge. In the present study, we hypothesized that MRI-MSL measurement is a good non-invasive indicator for determine the change in the microvasculature after stroke. We developed the MRI MSL theory for the first time to measure the changes in the microvasculature and the MRI results validated by histology. We also examine the VSI to characterize changes in the microvasculature after stroke.
2. Results
2.1. Appearance of ischemic lesions on T2, CBF and ADC maps
Following MCA occlusion (MCAo), ischemic lesions developed in the ipsilateral hemisphere, seen as decreased ADC and increased T2 in the territory supplied by the MCA 24 hours after stroke and increased ADC and T2 at 6 weeks, just before the animals were killed. Figure 1 shows changes in T2 (top row), CBF (middle row) and ADC (bottom row) 24 hours and 6 weeks after embolization. The ischemic areas were larger on the T2, CBF, and ADC maps at 24 hours compared with the lesions detected 6 weeks after MCAo. T2 and ADC in the recovery region (arrows) were normal at 6 weeks. Figure 2 illustrates a typical DCE-MRI parameter, CBF, CBV and mean transit time (MTT) for a representative animal at 24 hours and the last time point 6 weeks. The CBV map was used in the generation of the MSL-maps.
Figure 1.
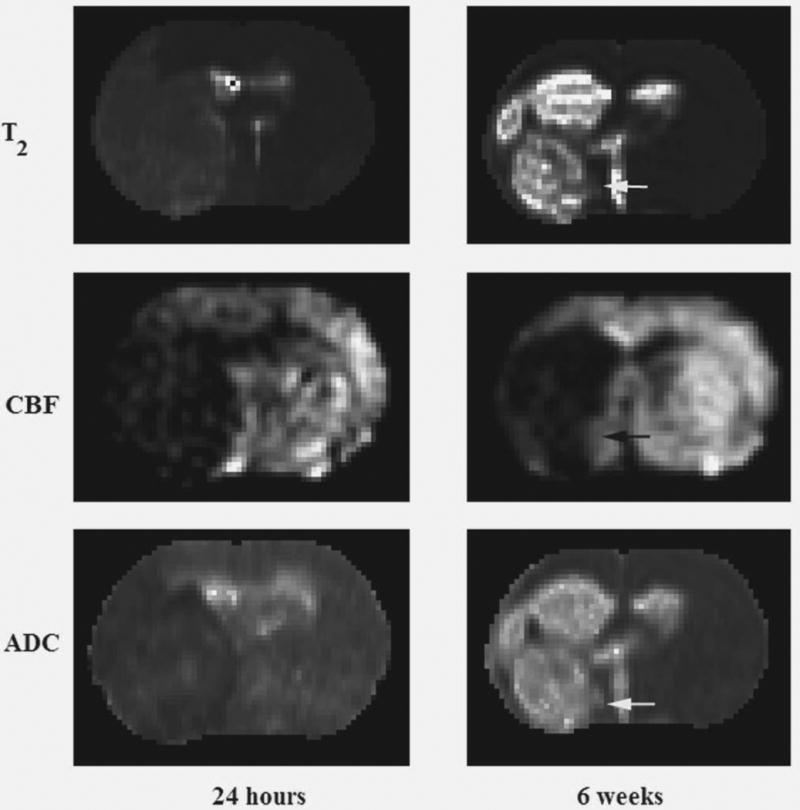
Representative T2- (top row), CBF- (middle row) and ADC-maps (bottom row) obtained 1 day and 6 weeks after embolization.
Figure 2.
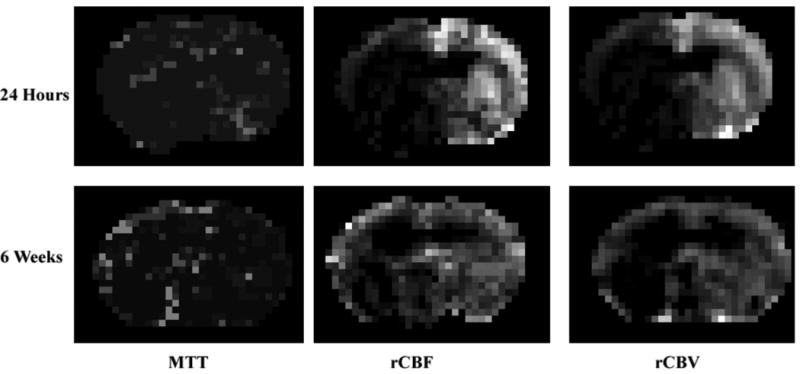
Representative rCBF-, rCBF- and MTT- maps obtained 1 day and 6 weeks after embolization.
2.2. Evaluation of VSI and MSL
Figure 3 compares representative MSL and VSI maps of the contralateral and ischemic recovery regions obtained by MRI 6 weeks after stroke with LSCM maps of the same slice. Both VSI and MSL suggest vascular remodeling in the recovery region. On MRI, VSI was 5.75 ± 0.54 μm and 4.81 ± 0.39 μm in the recovery region and contralateral ROI, respectively. The corresponding LSCM values were 6.73 ± 0.71 μm in the recovery region and 4.51 ± 0.43 μm in the contralateral ROI. Regression analysis of the combined data from both recovery and normal contralateral regions showed a strong linear correlation between MRI and LSCM (R2 = 0.7156; p < 0.001) (Figure 4A). Compared with LSCM, MRI was more accurate at the low end but higher at the top end. A similar strong correlation between MRI and LSCM was detected for each individual ROI in both the contralateral (R2 = 0.7287; p < 0.003) and recovery region (R2 = 0.7949; p < 0.003) (Figures 4B and 4C).
Figure 3.
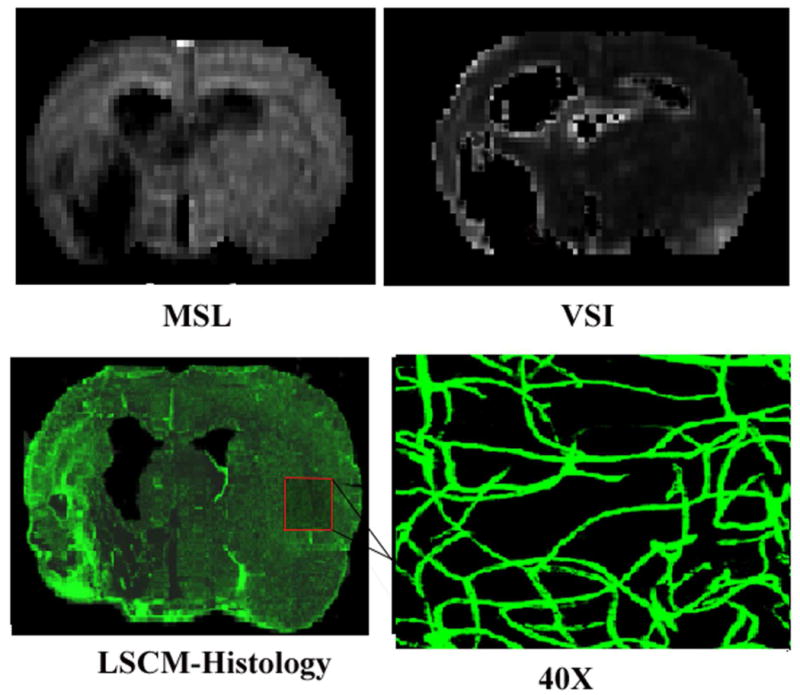
Representative MSL- and VSI- maps compared with LSCM histology in the contralateral hemisphere at 6 weeks (×40 magnification).
Figure 4.
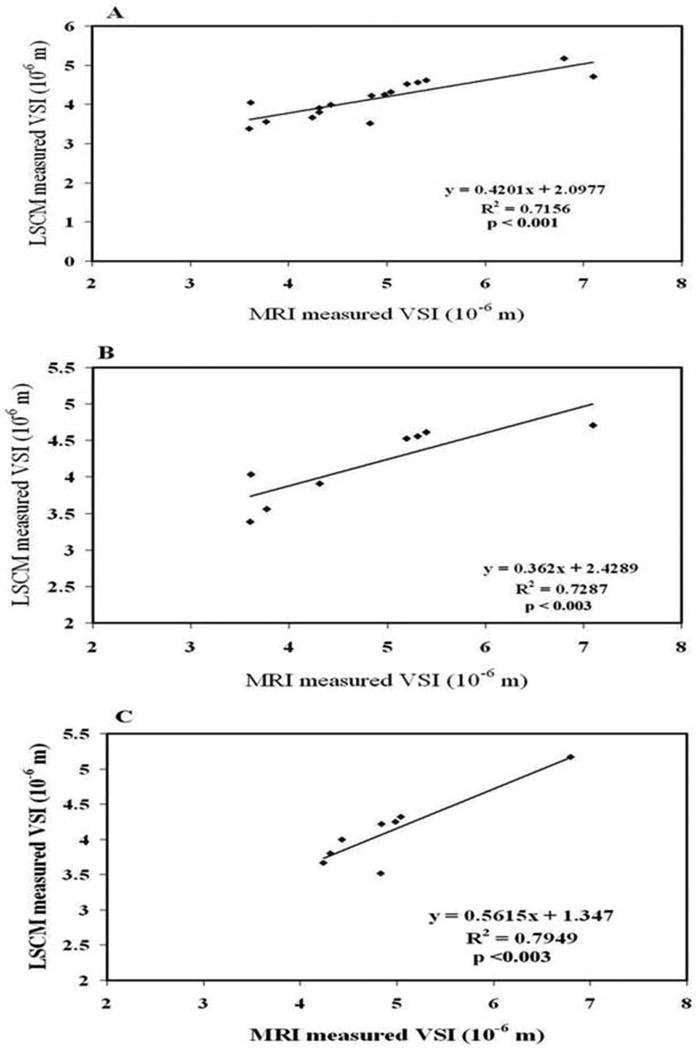
Figure 4A: Good correlation between LSCM and MRI measurements of VSI was observed in two regions of interest (ROIs), the recovery region and the normal contralateral region. Figure 4B: Good correlation between LSCM and MRI observed only in the normal contralateral region. Figure 4C: Good correlation between LSCM and MRI observed only in the recovery region.
On MRI, MSL was 16.61 ± 2.33 and 26.52 ± 3.20 μm in the recovery region and contralateral ROI, respectively, compared with 21.44 ± 3.68 and 30.39 ± 3.94 μm for LSCM. Regression analysis showed a strong linear correlation between MRI and LSCM for the combined data from both recovery and normal contralateral regions (R2 = 0.631; p < 0.001) (Figure 5A). And again, we found a strong correlation between the MRI and LSCM data for both the contralateral (R2 = 0.639; p < 0.02) and recovery region (R2 = 0.9044; p < 0.001) (Figures 5B and 5C).
Figure 5.
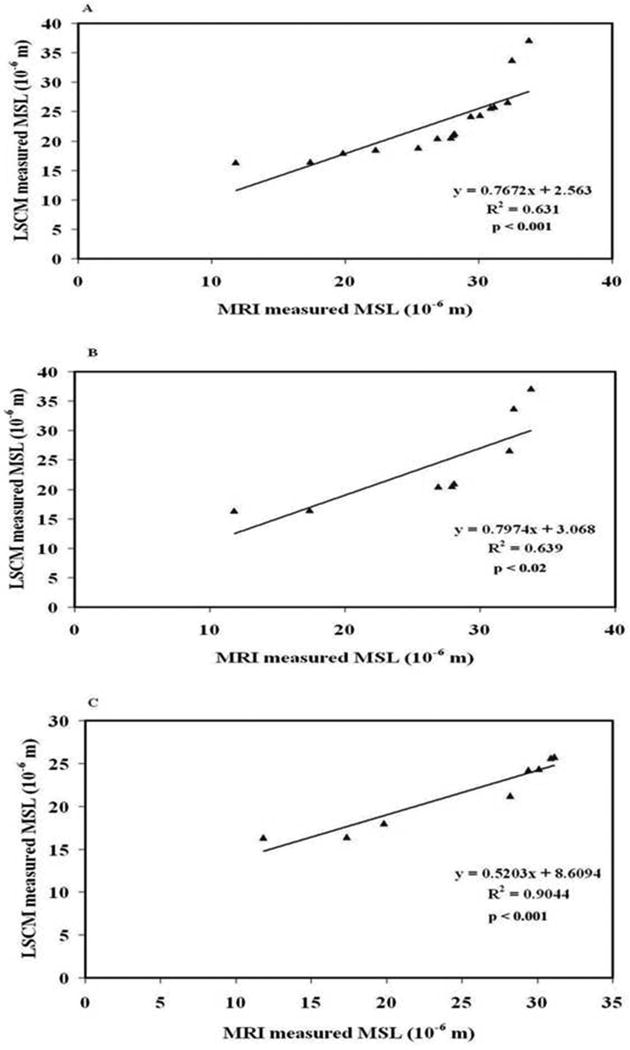
Figure 5A: Good correlation between LSCM and MRI measurements of MSL was observed in two regions of interest (ROIs), the recovery region and the normal contralateral region. Figure 5B: Good correlation between LSCM and MRI observed only in the contralateral region. Figure 5C: Good correlation between LSCM and MRI observed only in the recovery region.
3. Discussion
In this study we developed a theory to determine MSL and performed MSL measurements for the first time by MRI and validated MRI results by LSCM. Also we modified the method used to determine VSI to reduce its dependence on contrast concentration. We also validated our MRI measurements of VSI by LSCM using a model of embolic stroke in rats. Our results established that MRI measurements of MSL and VSI are comparable with LSCM.
The average VSI we obtained for normal tissue using MRI (4.81 ± 0.39 μm) is in good agreement with the LSCM values measured by both Zhang et al (2002b) (4.7 ± 0.1 μm) and Morris et al (2003) (3.7 ± 2.50 μm). Our average MSL on MRI (26.52 ± 3.20 μm) is lower than Zhang's (37.9 ± 2.70 μm) but agrees with Morris's (29.7 ± 14.70 μm), while our MRI values for VSI and MSL in the normal brain are comparable to published data (Morris et al., 2000; Morris et al., 2003; Zhang et al., 2002b). Moreover, our MRI and LSCM data showed good agreement in both the recovery region and normal brain. These findings suggest that both MSL and VSI could provide important physiological measurements of microvascular structures on MRI and may provide a direct means of detecting vascular remodeling after stroke.
VSI has been employed as a marker of tumor vasculature on MRI but has rarely been used to measure changes in the microvasculature in stroke recovery patients. Unlike previous studies, we directly compared VSI measured by MRI and LSCM in the same animal and found that MRI Q-, MSL- and VSI- maps based on CBV, ADC and shifts in the relaxation rate caused by contrast injection could be used to investigate changes in the cerebral microvasculature induced by ischemia. When MRI was performed 6 weeks after MCA occlusion, the VSI data showed that the vessels in the recovery region were significantly larger in diameter compared with homologous tissue in the contralateral hemisphere, and this was confirmed by LSCM 3D quantitative analysis. (Taguchi et al., 2004) reported that capillary diameter at the ischemic boundary became greatly enlarged by 4 weeks after occlusion, which seems to indicate that the interface between blood and neural tissues becomes thin and wide, which would be beneficial for exchanging substances between circulating blood and the ischemic tissue. We found that MRI and LSCM measurements of both VSI and MSL showed a strong correlation between the recovery region and normal contralateral tissue. We also reported previously that MRI values for mean microvascular density (MVD) correlate well with the histological measurements (Bosomtwi et al., 2008).
Several crucial questions remain unanswered in the field of neurorestorative treatment for neurological diseases such as stroke, traumatic brain injury and hemorrhage, among them how to noninvasively localize angiogenesis and follow its evolution during recovery from injury. Due to the noninvasive nature of MRI, the techniques developed in animal experiments can be translated to the clinic. New capillary formation through sprouting from pre-existing vessels involves the complex processes of angiogenesis and vasculogenesis (Risau, 1997). Angiogenesis is a multi-step process that comprises endothelial-cell proliferation, migration, tube formation, branching, and anastomosis (Risau, 1997). Vascular endothelial growth factor (VEGF) and VEGF receptor 2 (VEGFR2) initiate angiogenesis, while angiopoietins 1 and 2 and their receptor, Tie2 are involved in vessel maturation, stabilization, and remodeling (Chen et al., 2001; Zhang et al., 2002b) and mediate angiogenesis at the ischemic boundary (Zhang et al., 2000; Zhang et al., 2002b). These newly formed cerebral vessels are inherently leaky, as it can take several weeks to form a functional blood brain barrier (BBB). Monitoring changes in blood volume over time may reflect the growth of new blood vessels resulting from both angiogenesis and vasculogenesis (Hawighorst et al., 1998; Pathak et al., 2001). There is a significant correlation between dynamic contrast enhanced MRI measurements of blood volume and histological determination of MVD at sites of intense angiogenic activity (Hawighorst et al., 1998; Pathak et al., 2001). By combining MRI with 3D LSCM, we determined that restorative therapy of stroke in rats correlates with increased CBF, CBV and blood-to-brain transfer constant (Ki) for Gd-DTPA (Jiang et al., 2005). These MR measurements can identify areas of remodeling and angiogenesis. However, there is a flaw inherent in correlation of CBV with vascular remodeling, since the increased vessel diameter may result in a high blood volume fraction that does not necessarily reflect increased number of vessels as determined by mean vascular density (MVD) (Neeman, 2002). Nevertheless current MRI measurements of VSI and MSL can provide a full picture about changes in vasculature and can correct the flaw described above. We have also developed a model of total vessel surface area using histological data on MVD, MSL and VSI to evaluate differences in vascular morphology (Lu et al., 2004). By including the newly developed MRI MSL measurement, total vessel surface area can be measured noninvasively using the corresponding MRI values and could provide a sensitive vascular morphological parameter to detect vascular remodeling after stroke and other neurological injuries. The strength of this technique is that a complete set of morphological changes in the vasculature can be measured noninvasively using MRI and the results validated by LSCM using a 3DVQ program. Although our MRI measurements were performed in rats, all of them can be employed in the clinic thanks to their noninvasive nature.
One limitation of our method is that with lower doses of the contrast agent ΔR2 and ΔR2* become smaller, requiring an improved signal-to-noise ratio to maintain accuracy of the MRI data. This effect is probably apparent in tumoral and peritumoral tissues due to the heterogeneity of the lesion (Troprès et al., 2004). Our MRI estimates of MSL and VSI were based on the theoretical assumption that the vascular network is ideally made up of randomly distributed cylinders of infinite length having radii that vary widely, and this may deviate from actual values measured on histological section. Wu et al (Wu et al., 2004) assumed diffusion was isotropic, which may result in erroneous values for tissues such as white matter. Therefore we extended this theory by including the effects of diffusional anisotropy in our MRI calculations. The current steady-state MRI imaging technique to measure microvascular parameters using high contrast concentration is a weak point and can not apply to patient. The sufficiently high dose of the intravascular contrast agent require for the steady state in this study is unlikely to be feasible for human studies. However, one clinical study has found that doses up to 5mg Fe/kg of a similar superparamagnetic iron oxide contrast agent (NC100150) to be generally well tolerated (Leiner et al., 2003). A more practical method of obtaining MSL- and VSI-maps in humans may be to measure the relaxation rate shifts from images acquired during the first pass of an injected bolus, rather than in steady state, using an interleaved gradient echo/spin echo EPI sequence with a lower dose of contrast agent (Jensen et al., 2006).
The 3DVQ program also has some limitations. Sporadic disconnects in tiny capillary segments are occasionally observed when a single erythrocyte partially obstructs FITC perfusion, which can be overcome by adjusting the threshold of the collecting software and using a filter that digitally accommodates these artifacts (Morris et al., 2003). In summary, our studies demonstrate that MRI is capable of evaluating microvascular parameters such as MSL and VSI after embolic stroke and these MRI measurements are comparable with the data obtained by LSCM. Such MRI data could prove to be a very important tool for noninvasive quantitative analysis of vascular remodeling after stroke and other neurological diseases and could also be translated from experimental studies to the clinic.
4. Experimental procedures
All studies were performed in accord with institutional guidelines for animal research under a protocol approved by the Institutional Animal Care and Use Committee (IACUC) of Henry Ford Hospital.
4.1. Animal model and experiments
Eight male wistar rats weighing 300 to 450 g were subjected to embolic stroke by slowly injecting an aged white clot (prepared 24 h before ischemia) into the internal carotid artery to block the middle cerebral artery (MCA), which provides a reproducible and predictable infarct volume localized to the territory supplied by the MCA (Jiang et al., 1998; Zhang et al., 1997).
4.2. MRI measurements
MRI measurements were performed using a 7 T BRUKER MRI system with a 30-mm surface receiver coil and a 65-mm saddle transmitter coil that could be decoupled using a PIN diode switch. During MRI, stereotaxic ear bars were used to minimize movement and anesthesia was maintained using a mixture of N2O (70%), O2 (30%) and isoflurane (0.75–1%). Rectal temperature was kept at 37 ± 0.5°C using a feedback controlled water bath. A tri-pilot scan was used to reposition the rat in the magnet for each session. A complete set of images was obtained repeatedly for 24 hours after the onset of embolization and again 6 weeks later, measuring diffusion weighted imaging (DWI), cerebral blood flow (CBF), cerebral blood volume (CBV), mean transit time (MTT), and pre- and post-contrast-enhanced T2 and T2*. Contrast-enhanced T2 and T2* images were obtained by injecting 20 mg/kg Fe (P904; Guerbet, France).
4.2.1. Measurement of CBF
Arterial spin labeling (ASL) (Williams et al., 1992) was used to measure CBF in cerebral tissue. Adiabatic inversion of arterial water protons (Dixon et al., 1986) was accomplished via an Z axial gradient of ± 0.3 kHz/mm and a 1-second continuous wave (CW) RF power of 0.3 kHz at a frequency offset of ± 6 kHz, followed by an SE imaging sequence with TR/TE = 1000 ms/20 ms. The labeled slice was 2 cm distal from the imaging slice and 1 mm thick. In order to abolish asymmetry of the axial gradient and frequency, images were averaged by switching around the gradient and frequency polarities. The field of view (FOV) was 32 mm with a 64 × 64 matrix.
4.2.2. Measurement of CBV and MTT
Dynamic contrast enhancement using navigated echo-planar imaging (EPI) (Wan et al., 1997) was employed to estimate relative CBV (Ostergaard et al., 1996; Wan et al., 1997).The SE T2-weighted EPI images were produced with a 32mm FOV, 2mm slice thickness,5 slices, 64 × 64 matrix, TR = 750 msec. After 10 EPI images were acquired, a bolus of 0.2 mmol/kg Gd-DTPA was manually injected following a 0.4ml saline flush and 90 more EPI images were taken.
4.2.3. Measurement of T2
T2 was measured using a standard two-dimensional Fourier transform (2DFT) sequence with 13 slices and 6 echoes. Six sets of images (13 slices per set) were obtained using TEs of 15, 30, 45, 60, 75 and 90 ms and a TR of 5 s. Images were produced using a 32-mm FOV, 1mm slice thickness and 128 × 64 matrix. The entire sequence took 5.0 min.
4.2.4. Measurement of T*2
T2* was measured with a GE sequence using 13 slices and 6 echoes. Six sets of gradient echoes were obtained using TEs of 4.5, 9, 13.5, 27, 31.5 and 36 ms and a TR of 5 s. Images were produced using a 32-mm FOV, 1mm slice thickness and 128 × 64 matrix. The entire sequence took 5.0 min.
4.2.5. Measurement of trace ADCw
Trace ADCw was measured using a Stejskal-Tanner sequence that had three values for b (10, 800, and 1800 s/mm2) in three diffusion sensitizing directions with 13 slices, 1mm slice thickness, 32mm FOV, 128 × 64 matrix, TR = 1.5 s, TE = 40 ms. The entire sequence took 14.4 min.
4.3. Tissue preparation and histological assessment
To assess morphological changes in the cerebral microvessels, the rats were killed 6 weeks after stroke following injection of 1 ml fluoro-isothiocyanate dextran (FITC-dextran) (2×10⁶ mw, Sigma, St. Louis, MO; 50 mg/ml) into the right femoral vein. The brain was fixed in 4% paraformaldehyde at 4 °C for 48 h and coronal sections (100-μm thick) cut with a vibratome.
4.3.1. Image acquisition in three dimensions
Sections were analyzed with a Bio-Rad MRC 1024 (argon/krypton) LSCM system mounted on a Zeiss microscope (Bio-Rad; Cambridge, MA). Data were acquired with a ×40 oil immersion objective at an aperture of 1.3. Green fluorochromes (representing FITC-dextranlabeled microvessels) were excited with a laser beam at 488 nm and emissions detected with a photomultiplier tube after passing through a 522-nm filter. Because the size of fluorescent spots in a two-dimensional image depends on the laser power, iris, gain and sampling time, these parameters were fixed within each section during data acquisition. Areas of interest at the striatal and cortical boundaries of the infarct core on the ipsilateral side and homologous areas on the contralateral side were scanned using a 512×512-pixel matrix in the x–y direction using a 4× frame-scan average and 20 ± 2 thin optical slices at steps of 1.0 μm. Tissue volumes were 260.6 × 260.6 × 20 μm3.
4.4. MRI data analysis
MRI data were transferred to a workstation (SUN Microsystems) for off-line processing. Images were corrected for baseline and reconstructed with in-house software using a 128×128 matrix. All post-processing of the reconstructed images was performed with Eigentool image analysis software (Peck et al., 1992; Windham et al., 1988), including co-registration and analysis of the MRI maps and histological sections. T2-weighted images were taken as reference images for purposes of co-registration, warping, and determination of ischemic lesion size. For this, we considered all lesions on the post-stroke T2 maps with values above the mean ± 2 S.D. of the contralateral measurements (Bosomtwi et al., 2008; Ding et al., 2004). The mean absolute value of T2 in the normal tissue in the contralateral hemisphere is 55.7 + 10.2 ms (mean + 2SD). This value means that 95% of normal tissue is under this threshold. This method of getting the threshold is relatively reliable to determine the damaged tissue, hence core and recovery region could be determined. The difference between lesion size at 1 day (Figure 6A) and 6 weeks (Figure 6B) was considered the recovery area (Figure 6C). ROIs in the contralateral hemisphere homologous to the ischemic core and recovery area were also measured. For the reliability of the result absolute value of ADC in the normal tissue in the contralateral hemisphere is 7.58 × 10⁻⁴ mm2/sec.
Figure 6.
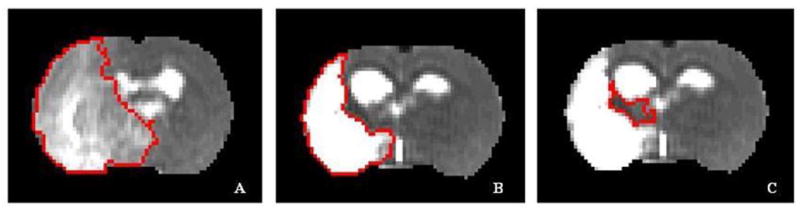
Representative T2 maps indicating the three ROIs. A) 24 hours; B) 6 weeks (excluding the ventricles); C) recovery region in the ipsilateral hemisphere at 6 weeks.
DCE-MRI data allow calculation of cerebral hemodynamic parameters from the time-course of signal changes induced by the first passage of a paramagnetic contrast agent after intravenous injection. The dynamic change of signal in perfused tissue during the first passage of a bolus of injected contrast agent was used to estimate hemodynamic parameters CBF, CBV and mean transit time (MTT). All the data generated from the MRI experiment were co-registered with the T2-map before the MSL and VSI evaluated. The MSL and the VSI –maps were generated using the relation derived from the theory. All the post processing data analyses were done by Eigentool image analysis software.
4.5. Co-registration or superimposition of MRI and histological data
To match MRI with histology, we first transferred the image volumes obtained by both methods into the same coordinate system using linear transformation as defined by registration methods and then compared their geometry by nonlinear mapping as defined by warping methods (Bosomtwi et al., 2008; Ghanei et al., 2000; Jacobs et al., 2000; Jacobs et al., 1999).
4.5.1. LSCM image analysis and reconstruction
To count the number of microvessels perfused with FITC-dextran, the LSCM images were analyzed by 3-D vessel quantification (3DVQ) (Hamid et al., 2005; Zhang et al., 2002b), measuring vessel diameter, vascular branching points, and lengths of vascular segments. All medial points of a given branch were labeled the same, and the starting (branching) node and ending node of each branch were identified. A branching node is a medial point whose cluster is immediately followed by more clusters having the same single-seeded code, while an ending node is a medial point not followed by a cluster. This program establishes “parent-and-child” relationships between medial points by measuring the Euclidean distance between subsequent medial points with increasing single-seeded field values. To remove spurious branches, a pruning technique is applied, based on the minimum length of real branches. The program then uses these “parent-and-child” relationships to merge branches that were initially labeled differently because of the spurious segments. The accuracy of this algorithm has been confirmed by comparison to cerebral vascular morphology as measured by light and electron microscopy (Jiang et al., 2004; Lu et al., 2004; Morris et al., 2003; Zhang et al., 2002b). Figures 7A and 7B are FITC-dextran images acquired from the original microscopy composites and Figures 7C-7F are the images generated by the 3DVQ program. Figures 7C and 7E correspond to computer generated images from the contralateral hemisphere, while Figures 7D and 7F represent the ipsilateral hemisphere.
Figure 7.
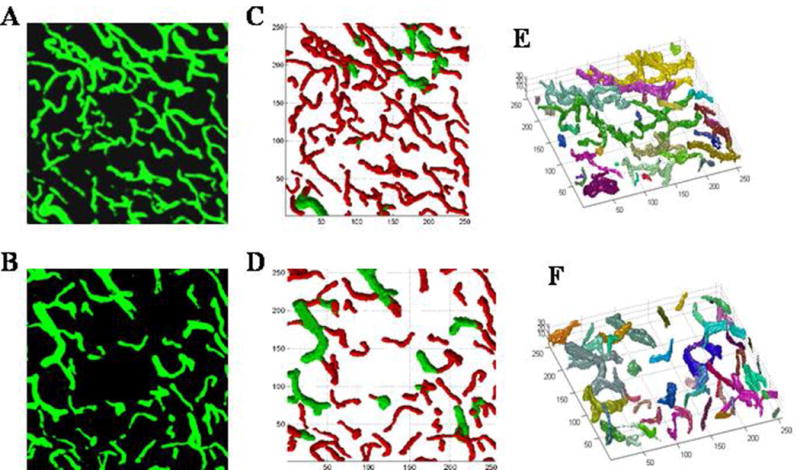
Top row: Contralateral hemispheres; Bottom row: Ipsilateral (recovery) region from LSCM images. A & B) FITC-dextran images acquired from the original microscopic composites for contralateral and ipsilateral respectively. C & D) representative skeleton 2-D plots and E & F) Rotational 3-D images of the microvasculature 6 weeks after stroke generated by the 3-D vessel quantification (3DVQ) program. All units are microns. In the 2D plots red indicates diameter ≤ 7.5 μm and green is ≥ 7.5 μm. In the 3-D images the different colors represent vessels that are not connected. The contralateral hemisphere shows a well-connected and uniform microvasculature, while the ipsilateral hemisphere exhibits disconnected microvessels of varying segment length and diameter as indicated in C &D.
4.6. Theory
Introduction of a paramagnetic or superparamagnetic contrast agent into the vascular compartment creates a susceptibility difference between blood vessels and surrounding tissues and induces long-range disturbances in the magnetic field that extend to adjacent tissues and increase the transverse relaxation rate constants R2 and R*2. Two phenomena affect the transverse relaxation rate of water contained in tissue following addition of a contrast agent to the blood pool (Kiselev and Posse, 1999; Yablonskiy and Haacke, 1994). First, disturbances in the magnetic field increase heterogeneity of the phase distribution across the voxel, causing reversible spin dephasing and signal loss in gradient-echo experiments (GE) and increasing R*2 though R2 remains unchanged in the absence of diffusional motion. Second, diffusion of water molecules along magnetic field gradients introduces two opposing effects: 1) irreversible loss of phase coherence and signal attenuation in spin echo experiments (SE); and possibly 2) averaging of phase differences by motional narrowing in the event of rapid spatial variations in the magnetic field, reducing T*2 and altering T2. Thus changes in R2 and R*2 depend on the size and architecture of the vascular compartment.
The blood fraction ξ0 may be determined from ΔR*2 if the contrast concentration in the blood (susceptibility difference Δχ) is known (Jensen and Chandra, 2000), using the equation
| (1) |
In turn SE can yield information on vessel size distribution (Tropres et al., 2001). VSI can be written as
| (2) |
However, the actual radius (r) cannot be measured without knowing the diffusion coefficient (D) and change in blood susceptibility (Δχ) caused by the contrast agent (Tropres et al., 2001; Troprès et al., 2004).
For a voxel containing n number of capillaries of mean length (l) and mean radius (r), n is defined as
| (3) |
where Ra is the maximum radius of the capillaries that bring blood into the voxel and ρ(R) is a density function such that . Assuming the capillaries are cylinders, CBV can be defined as
| (4) |
Using equations (3) and (4), we obtained
| (5) |
The relationship between the blood volume fraction ξ0 and total capillary length (TCL) can be expressed as
| (6) |
Substituting for ξ0 and r in equation (6),
| (7) |
Arranging the cylindrical capillary segments in a series (nl) suggests nl is practically equal to TCL. Therefore, using equations (5) and (7) the mean capillary radius (r) becomes
| (8) |
where Q is defined by
| (9) |
(Jensen and Chandra, 2000). Here r is independent of contrast concentration. For a unit voxel, r can be measured from known MRI parameters as
| (10) |
In this definition of CBV can be seen as a volume fraction: CBV (%) = 100 × (volume of blood in a voxel)/(volume of the voxel). CBF is net blood flow through the voxel divided by its volume and is measured in milliliters of blood per milliliter of tissue per minute. Mean transit time (MTT) describes the average amount of time it takes a given water molecule or particle of contrast agent to pass through the voxel vasculature. They are related according to the equation
| (11) |
(Weisskoff et al., 1993). Since diffusion does not proceed at a constant rate, it is necessary to apply the apparent diffusion coefficient or ADC in the measurements of MVD as shown below:
| (12) |
Mean capillary length (l) can be evaluated from equations (5) and (12) as
| (13) |
The above equations can be used to estimate mean radius, capillary length, and microvascular density in tissue.
4.7 Statistical analysis
VSI and MSL were measured using both MRI and 3D LSCM histological methods and a 3DVQ program, collecting data from two ROIs (contralateral and ischemia recovery regions). To determine the reliability of the MRI measurements, the intra-correlation coefficient (ICC) and its 95% lower bound (95% LB) between MRI and histological evaluation were estimated (Fleiss, 1986), adjusting for clustered regions (Legler et al., 1995). ICC ranging from 0 to 1 measures agreement beyond chance, where 1 indicates perfect agreement and 0 indicates no agreement between the two methods. The level of agreement can be categorized as low (ICC < 0.40), moderate (ICC 0.40 - 0.70), high (ICC > 0.70) or excellent (ICC > 0.90). ICC was calculated at each ROI where overall agreement was significant (p < 0.05). This involved testing for a region effect, followed by a pair-wise comparison between regions if a region effect was detected (p = 0.05).
Acknowledgments
This work was supported in part by NIH grants RO1 NS48349, P50 NS23393, PO1 NS42345, and Yerkes National Primate center base grant P51 RR000165 and Guerbet Company (France) for providing the contrast agent.
Footnotes
Disclosure/ Conflict of Interest.
Asamoah Bosomtwi: No disclosures
Michael Chopp: No disclosures
Li Zhang: No disclosures
Zheng Gang Zhang: No disclosures
Mei Lu: No disclosures
Quan Jiang: No disclosures
Publisher's Disclaimer: This is a PDF file of an unedited manuscript that has been accepted for publication. As a service to our customers we are providing this early version of the manuscript. The manuscript will undergo copyediting, typesetting, and review of the resulting proof before it is published in its final citable form. Please note that during the production process errors may be discovered which could affect the content, and all legal disclaimers that apply to the journal pertain.
References
- Bosomtwi A, Jiang Q, Ding GL, Zhang L, Zhang ZG, Lu M, Ewing JR, Chopp M. Quantitative evaluation of microvascular density after stroke in rats using MRI. Journal of Cerebral Blood Flow & Metabolism. 2008;28:1978–1987. doi: 10.1038/jcbfm.2008.85. [DOI] [PMC free article] [PubMed] [Google Scholar]
- Brasch R, Turetschek K. MRI characterization of tumors and grading angiogenesis using macromolecular contrast media: status report. Eur J Radiol. 2000;34:148–155. doi: 10.1016/s0720-048x(00)00195-9. [DOI] [PubMed] [Google Scholar]
- Chen J, Sanberg PR, Li Y, Wang L, Lu M, Willing AE, Sanchez-Ramos J, Chopp M. Intravenous administration of human umbilical cord blood reduces behavioral deficits after stroke in rats. Stroke. 2001;32:2682–2688. doi: 10.1161/hs1101.098367. [DOI] [PubMed] [Google Scholar]
- Cramer SC, Chopp M. Recovery recapitulates ontogeny. Trends Neurosci. 2000;23:265–271. doi: 10.1016/s0166-2236(00)01562-9. [DOI] [PubMed] [Google Scholar]
- Cramer SC, Nelles G, Benson RR, Kaplan JD, Parker RA, Kwong KK, Kennedy DN, Finklestein SP, Rosen BR. A functional MRI study of subjects recovered from hemiparetic stroke. Stroke. 1997;28:2518–2527. doi: 10.1161/01.str.28.12.2518. [DOI] [PubMed] [Google Scholar]
- Dennie J, Mandeville JB, Boxerman JL, Packard SD, Rosen BR, Weisskoff RM. NMR imaging of changes in vascular morphology due to tumor angiogenesis. Magn Reson Med. 1998;40:793–799. doi: 10.1002/mrm.1910400602. [DOI] [PubMed] [Google Scholar]
- Ding G, Jiang Q, Zhang L, Zhang ZG, Knight RA, Soltanian-Zadeh H, Lu M, Ewing J, Li QJ, Whitton P, Chopp M. Multiparametric ISODATA Analysis of Embolic Stroke. J Neurol Sci. 2004;223:135–143. doi: 10.1016/j.jns.2004.05.017. [DOI] [PubMed] [Google Scholar]
- Fleiss JL. The design and analysis of clinical experiments. John Wiley & Sons; New York: 1986. [Google Scholar]
- Ghanei A, Soltanian-Zadeh H, Jacobs MA, Patel S. Boundary-based warping of brain MR images. Journal of Magnetic Resonance Imaging. 2000;12:417–429. doi: 10.1002/1522-2586(200009)12:3<417::aid-jmri7>3.0.co;2-x. [DOI] [PubMed] [Google Scholar]
- Hamid SZ, Ali S, Mohammad-Mehdi K, Zheng GZ, Reza AZ, Mahnaz M, Michael C. 3-D quantification and visualization of vascular structures from confocal microscopic images using skeletonization and voxel-coding. Computers in biology and medicine. 2005;35:791–813. doi: 10.1016/j.compbiomed.2004.06.009. [DOI] [PubMed] [Google Scholar]
- Hawighorst H, Knapstein PG, Knopp MV, Weikel W, Brix G, Zuna I, Schonberg SO, Essig M, Vaupel P, van Kaick G. Uterine cervical carcinoma: comparison of standard and pharmacokinetic analysis of time-intensity curves for assessment of tumor angiogenesis and patient survival. Cancer Res. 1998;58:3598–3602. [PubMed] [Google Scholar]
- Jacobs MA, Knight RA, Soltanian-Zadeh H, Zheng ZG, Goussev AV, Peck DJ, Windham JP, Chopp M. Unsupervised segmentation of multiparameter MRI in experimental cerebral ischemia with comparison to T2, diffusion, and ADC MRI parameters and histopathological validation. Journal of Magnetic Resonance Imaging. 2000;11:425–437. doi: 10.1002/(sici)1522-2586(200004)11:4<425::aid-jmri11>3.0.co;2-0. [DOI] [PubMed] [Google Scholar]
- Jacobs MA, Windham JP, Soltanian-Zadeh H, Peck DJ, Knight RA. Registration and warping of magnetic resonance images to histological sections. Medical Physics. 1999;26:1568–1578. doi: 10.1118/1.598671. [DOI] [PubMed] [Google Scholar]
- Jensen JH, Chandra R. MR imaging of microvasculature. Magnetic Resonance in Medicine. 2000;44:224–230. doi: 10.1002/1522-2594(200008)44:2<224::aid-mrm9>3.0.co;2-m. [DOI] [PubMed] [Google Scholar]
- Jensen JH, Lu H, Inglese M. Microvessel density estimation in the human brain by means of dynamic contrast-enhanced echo-planar imaging. Magnetic Resonance in Medicine. 2006;56:1145–1150. doi: 10.1002/mrm.21052. [DOI] [PubMed] [Google Scholar]
- Jiang F, Zhang ZG, Katakowski M, Robin AM, Faber M, Zhang F, Chopp M. Angiogenesis induced by photodynamic therapy in normal rat brains. Photochem Photobiol. 2004;79:494–498. doi: 10.1562/2003-11-19-rc.1. [DOI] [PubMed] [Google Scholar]
- Jiang Q, Zhang ZG, Ding GL, Zhang L, Ewing JR, Wang L, Zhang R, Li L, Lu M, Meng H, Arbab AS, Hu J, Li QJ, Pourabdollah Nejad DS, Athiraman H, Chopp M. Investigation of neural progenitor cell induced angiogenesis after embolic stroke in rat using MRI. Neuroimage. 2005;28:698–707. doi: 10.1016/j.neuroimage.2005.06.063. [DOI] [PubMed] [Google Scholar]
- Jiang Q, Zhang ZG, Zhang RL, Ewing JR, Divine GW, Jiang P, Chopp M. Diffusion, perfusion, and T2 magnetic resonance imaging of anti- intercellular adhesion molecule 1 antibody treatment of transient middle cerebral artery occlusion in rat. Brain Research. 1998;788:191–201. doi: 10.1016/s0006-8993(97)01540-0. [DOI] [PubMed] [Google Scholar]
- Kiselev VG, Posse S. Analytical model of susceptibility-induced MR signal dephasing: effect of diffusion in a microvascular network. Magnetic Resonance in Medicine. 1999;41:499–509. doi: 10.1002/(sici)1522-2594(199903)41:3<499::aid-mrm12>3.0.co;2-o. [DOI] [PubMed] [Google Scholar]
- Krupinski J, Kaluza J, Kumar P, Kumar S, Wang JM. Role of angiogenesis in patients with cerebral ischemic stroke. Stroke. 1994;25:1794–1798. doi: 10.1161/01.str.25.9.1794. [DOI] [PubMed] [Google Scholar]
- Legler J, Lefkopoulou M, Ryan L. Efficiency and power of test for multiple binary outcome. J of The American Statistical Association. 1995;90(430):680–693. [Google Scholar]
- Leiner T, Ho K, Ho V, Bongartz G, Mali W, Rasch W, van Engelshoven J. Multicenter phase-II trial of safety and efficacy of NC100150 for steady-state contrast-enhanced peripheral magnetic resonance angiography. European Radiology. 2003;13:1620–1627. doi: 10.1007/s00330-002-1791-6. [DOI] [PubMed] [Google Scholar]
- Lin CY, Chang C, Cheung WM, Lin MH, Chen JJ, Hsu CY, Chen JH, Lin TN. Dynamic changes in vascular permeability, cerebral blood volume, vascular density, and size after transient focal cerebral ischemia in rats: evaluation with contrast-enhanced magnetic resonance imaging. Journal of Cerebral Blood Flow & Metabolism. 2008;28:1491–1501. doi: 10.1038/jcbfm.2008.42. [DOI] [PubMed] [Google Scholar]
- Lu M, Zhang ZG, Chopp M. Analysis of cerebral microvascular architecture--application to cortical and subcortical vessels in rat brain. Journal of Neuroscience Methods. 2004;138:81–87. doi: 10.1016/j.jneumeth.2004.03.011. [DOI] [PubMed] [Google Scholar]
- Morris DC, Davies K, Zhang Z, Chopp M. Measurement of cerebral microvessel diameters after embolic stroke in rat using quantitative laser scanning confocal microscopy. Brain Research. 2000;876:31–36. doi: 10.1016/s0006-8993(00)02543-9. [DOI] [PubMed] [Google Scholar]
- Morris DC, Yeich T, Mehdi Khalighi M, Soltanian-Zadeh H, Zhang ZG, Chopp M. Microvascular structure after embolic focal cerebral ischemia in the rat. Brain Research. 2003;972:31–37. doi: 10.1016/s0006-8993(03)02433-8. [DOI] [PubMed] [Google Scholar]
- Neeman M. Functional and molecular MR imaging of angiogenesis: Seeing the target, seeing it work. J Cell Biochem Suppl. 2002;39:11–17. doi: 10.1002/jcb.10399. [DOI] [PubMed] [Google Scholar]
- Ostergaard L, Weisskoff RM, Chesler DA, Gyldensted C, Rosen BR. High resolution measurement of cerebral blood flow using intravascular tracer bolus passages. Part I: Mathematical approach and statistical analysis. Magn Reson Med. 1996;36:715–725. doi: 10.1002/mrm.1910360510. [DOI] [PubMed] [Google Scholar]
- Pathak AP, Schmainda KM, Ward BD, Linderman JR, Rebro KJ, Greene AS. MR-derived cerebral blood volume maps: issues regarding histological validation and assessment of tumor angiogenesis. Magn Reson Med. 2001;46:735–747. doi: 10.1002/mrm.1252. [DOI] [PubMed] [Google Scholar]
- Peck DJ, Spickler EM, Knight RA, Hearshen DO, Windham JP. Analysis of the Evolution of Focal Cerebral Ischemia in the Rat using the Eigenimage Filter. Magnetic Resonance in Medicine. 1992;26:259–273. doi: 10.1002/mrm.1910260207. [DOI] [PubMed] [Google Scholar]
- Risau W. Mechanisms of angiogenesis. Nature. 1997;386:671–674. doi: 10.1038/386671a0. [DOI] [PubMed] [Google Scholar]
- Slevin M, Krupinski J, Slowik A, Kumar P, Szczudlik A, Gaffney J. Serial measurement of vascular endothelial growth factor and transforming growth factor-beta1 in serum of patients with acute ischemic stroke. Stroke. 2000;31:1863–1870. doi: 10.1161/01.str.31.8.1863. [DOI] [PubMed] [Google Scholar]
- Taguchi Y, Takashima S, Sasahara E, Inoue H, Ohtani O. Morphological changes in capillaries in the ischemic brain in Wistar rats. Archives of Histology and Cytology. 2004;67:253–261. doi: 10.1679/aohc.67.253. [DOI] [PubMed] [Google Scholar]
- Tropres I, Grimault S, Vaeth A, Grillon E, Julien C, Payen JF, Lamalle L, Decorps M. Vessel size imaging. Magnetic Resonance in Medicine. 2001;45:397–408. doi: 10.1002/1522-2594(200103)45:3<397::aid-mrm1052>3.0.co;2-3. [DOI] [PubMed] [Google Scholar]
- Troprès I, Lamalle L, Farion R, Segebarth C, Rémy C. Vessel size imaging using low intravascular contrast agent concentrations. Magnetic Resonance Materials in Physics, Biology and Medicine. 2004;17:313–316. doi: 10.1007/s10334-004-0067-3. [DOI] [PubMed] [Google Scholar]
- Wan X, Gullberg GT, Parker DL, Zeng GL. Reduction of geometric and intensity distortions in echo-planar imaging using a multireference scan. Magn Reson Med. 1997;37:932–942. doi: 10.1002/mrm.1910370619. [DOI] [PubMed] [Google Scholar]
- Weisskoff RM, Chesler D, Boxerman JL, Rosen BR. Pitfalls in MR measurement of tissue blood flow with intravascular tracers: which mean transit time? Magnetic Resonance in Medicine. 1993;29:553–558. doi: 10.1002/mrm.1910290420. [DOI] [PubMed] [Google Scholar]
- Williams D, Detre J, Leigh J, Koretsky A. Magnetic resonance imaging of perfusion using spin inversion of arterial water. Proc Nat'l Acad Sci USA. 1992;89:212–216. doi: 10.1073/pnas.89.1.212. [DOI] [PMC free article] [PubMed] [Google Scholar]
- Windham JP, Abd-Allah MA, Reimann DA, Froelich JW, Haggar AM. Eigenimage Filtering in MR Imaging. Journal of Computer Assisted Tomography. 1988;12:1–9. doi: 10.1097/00004728-198801000-00001. [DOI] [PubMed] [Google Scholar]
- Wu EX, Tang H, Jensen JH. High-resolution MR imaging of mouse brain microvasculature using the relaxation rate shift index Q. NMR Biomed. 2004;17:507–512. doi: 10.1002/nbm.921. [DOI] [PubMed] [Google Scholar]
- Yablonskiy DA, Haacke EM. Theory of NMR signal behavior in magnetically inhomogeneous tissues: the static dephasing regime. Magnetic Resonance in Medicine. 1994;32:749–763. doi: 10.1002/mrm.1910320610. [DOI] [PubMed] [Google Scholar]
- Zhang L, Zhang RL, Wang Y, Zhang C, Zhang ZG, Meng H, Chopp M. Functional recovery in aged and young rats after embolic stroke: treatment with a phosphodiesterase type 5 inhibitor. Stroke. 2005;36:847–852. doi: 10.1161/01.STR.0000158923.19956.73. [DOI] [PubMed] [Google Scholar]
- Zhang R, Wang Y, Zhang L, Zhang Z, Tsang W, Lu M, Chopp M. Sildenafil (Viagra) induces neurogenesis and promotes functional recovery after stroke in rats. Stroke. 2002a;33:2675–2680. doi: 10.1161/01.str.0000034399.95249.59. [DOI] [PubMed] [Google Scholar]
- Zhang Z, Zhang RL, Jiang Q, Raman SB, Cantwell L, Chopp M. A new rat model of thrombotic focal cerebral ischemia. Journal of Cerebral Blood Flow & Metabolism. 1997;17:123–135. doi: 10.1097/00004647-199702000-00001. [DOI] [PubMed] [Google Scholar]
- Zhang ZG, Chopp M, Goussev A, Lu D, Morris D, Tsang W, Powers C, Ho KL. Cerebral microvascular obstruction by fibrin is associated with upregulation of PAI-1 acutely after onset of focal embolic ischemia in rats. J Neurosci. 1999;19:10898–10907. doi: 10.1523/JNEUROSCI.19-24-10898.1999. [DOI] [PMC free article] [PubMed] [Google Scholar]
- Zhang ZG, Zhang L, Jiang Q, Zhang R, Davies K, Powers C, Bruggen N, Chopp M. VEGF enhances angiogenesis and promotes blood-brain barrier leakage in the ischemic brain. J Clin Invest. 2000;106:829–838. doi: 10.1172/JCI9369. [DOI] [PMC free article] [PubMed] [Google Scholar]
- Zhang ZG, Zhang L, Tsang W, Soltanian-Zadeh H, Morris D, Zhang R, Goussev A, Powers C, Yeich T, Chopp M. Correlation of VEGF and angiopoietin expression with disruption of blood-brain barrier and angiogenesis after focal cerebral ischemia. Journal of Cerebral Blood Flow & Metabolism. 2002b;22:379–392. doi: 10.1097/00004647-200204000-00002. [DOI] [PubMed] [Google Scholar]