

Abstract
G protein coupled receptors (GPCRs) are versatile signaling molecules that mediate the majority of physiologic responses to hormones and neurotransmitters. Recent high-resolution structural insights into GPCR structure and dynamics are beginning to shed light on the molecular basis of this versatility. We use energy landscapes to conceptualize the link between structure and function.
Introduction
G protein coupled receptors (GPCRs) evolved to be the principal line of communication between cells and tissues in higher organisms. Moreover, they contribute to communication between individuals through the senses of vision and olfaction. These common portals for information transfer have also been hijacked by HIV and other viruses for the purpose of cellular infection. This extraordinary functional versatility is accomplished through a common seven transmembrane structure and, consequently, GPCRs are also called seven transmembrane receptors and heptahelical receptors.
As a result of their broad influence over human physiology and behavior, GPCRs are promising candidates for the development of new and more effective small molecule therapeutics. However, the development of selective GPCR drugs is challenging for several reasons. First, there is a high degree of homology among many closely related receptor subtypes that can regulate diverse physiologic functions. Also, a single GPCR may couple to more than one G protein, signal through G protein independent pathways, undergo complex regulatory processes, and be allosterically regulated by small molecules, and other proteins, including other GPCRs. Moreover, the predominant signaling behavior of a GPCR may differ for different cells or organs. Finally, drugs may preferentially activate or inhibit specific signaling pathways. While this functional versatility is important for normal physiologic signaling, it makes identifying effective therapeutics very challenging.
The goal of this review is to interpret the functional versatility of GPCRs in terms of their structural plasticity, and to show how these concepts can be visualized as energy landscapes of individual GPCR protein molecules. Much of what is known about GPCR structure and mechanism of activation comes from work on a relatively few GPCRs including rhodopsin and several monoamine receptors. While the review will focus on these proteins, it is likely that the concepts will apply to most if not all members of this extensive family.
Evidence for Structural Plasticity
As noted above, individual GPCRs may mediate a spectrum of signaling and regulatory behavior that can be modulated in a ligand specific manner (23). As an example, Figure 1 illustrates the diverse signaling behavior observed for the human β2 adrenergic receptor (β2AR), a close relative of rhodopsin. The β2AR was one of the first GPCR signaling pathways to be characterized, and the first hormone activated GPCR to be cloned (13) and have its structure determined by crystallography (8, 37, 38). Early studies revealed the predominant signaling pathway to be from agonist-activated β2AR to Gs, the stimulatory G protein for adenylyl cyclase. However, it is now known that the β2AR couples to the G protein Gi (10, 12), as well as activating G protein independent pathways through arrestin (2, 41) and possibly other cellular signaling proteins. The activity of the β2AR can be modulated in different ways by small molecule ligands. The term efficacy is used to describe the effect of a ligand on the signaling behavior of a receptor (Figure 1 inset). Agonists fully activate the receptor; partial agonists produce a submaximal activity. Antagonists block the binding of other drugs, without altering the basal activity of the receptor. Like many GPCRs, the β2AR exhibits agonist-independent activity that can be suppressed by drugs classified as inverse agonists (Figure 1 inset). Further complicating the classification of drugs for a given GPCR is the observation that the efficacy of a panel of drugs may differ for different down stream signaling profiles (23, 24, 48).
Figure 1. Factors that influence the signaling behavior of the human β2AR.

Ligands with different efficacies (inset) can modulate a given signaling pathway. Moreover, the efficacy of a drug may differ for different down stream signaling profiles. For instance, certain drugs induce routes involving signaling and regulatory proteins (e.g. Gi, arrestin) that complement the predominant pathway through Gs. In addition to ligand binding, other factors as lipid bilayer composition, pH and salt gradients, membrane potential, protein-protein interactions, either within the membrane (homo- or hetero-oligomerization and interaction with other membrane proteins) or with extracellular and intracellular partners, or post-translational modifications, as glycosilation, phosphorylation or acylation, can also influence the signaling behavior of the receptor.
The remarkable versatility of β2AR signaling is not limited to this particular GPCR, but more representative of the larger family. The most notable exception is the namesake for Family A GPCRs, rhodopsin. In contrast to most GPCRs, rhodopsin exhibits a more restricted signaling behavior necessary for its highly specific role, the efficient detection of light. Nevertheless, even rhodopsin exhibits dynamic properties and different functional and structural states (21).
This functional versatility of GPCRs cannot be explained by a simple on-off switch model of receptor activation, and is more compatible with dynamic and adaptable structures. In fact, there is a growing body of biochemical and biophysical data that GPCRs are flexible, dynamic proteins and that functionally distinct ligands can stabilize specific receptor conformations (25). In the next section we will discuss these conformations in terms of their thermodynamic energy profile in the context of energy landscapes, and consider how physiologically relevant variables can change this energy landscape and thereby the signaling behavior of the receptor.
Energy landscapes as a tool to visualize protein activation
Protein structures elucidated through X-ray crystallography reveal a highly specific assembly of smaller domains (alpha helices, beta sheets, connecting loops) that may give the impression that proteins are rigid entities. On the contrary, proteins are dynamic and exhibit small-scale movements at the level of amino acid side chains and larger scale movements between domains, on time scales ranging from nanoseconds to seconds (20). As a result, proteins exist in an ensemble of conformations, each with a distinct energy resulting from intramolecular chemical bonds and ionic interactions. Conformations of lower energy (i.e. more stable) are more populated, following a Boltzmann distribution. In addition, the probability associated with the occupancy of each conformation (conformational entropy) also plays a role in how the conformational states are populated. Overall, the thermodynamically most favorable conformations (as a balance of internal energy and conformational entropy) predominate in the ensemble. These particularly stable structures correspond to those conformations likely to be captured in X-ray crystallography. Thus, our view of protein structure is biased towards these stable conformations. However, there is growing experimental evidence, primarily by NMR, suggesting that conformational states involved in activation occur at equilibrium even in the absence of agonist, yet they represent only a small fraction of the ensemble (19). Thus, the less stable (i.e. less populated) conformations are also important for function.
While the framework to relate structural flexibility and protein function has been developed primarily for enzymes, these concepts can also be applied to GPCRs. These proteins are remarkably versatile signaling molecules due to its flexible and dynamic three-dimensional structure (25). However, while the amount of structural information is increasing rapidly, we still do not understand how ligand binding is translated into the series of conformational changes that lead to activation. As a first approximation, ligand-receptor interplay can be visualized by representing the energy of the receptor conformations along the activation pathway. In their simplest form, these energy landscapes are two-dimensional curves (Figure 2). The middle panel shows a very simple situation of a receptor that in the absence of ligand exists in two conformations. The energy minima correspond to (meta)stable conformations, inactive (R) and active (R*), connected through a saddle point of higher energy that represents a particular conformational change. The relative population of the states and the rate of transition between them are determined, respectively, by their difference in energy and by the height of the barrier. In this example, the lower energy of R results in a higher population (Figure 2, middle right panel, where size is proportional to population). In addition, in this case, receptors that achieve the state R* (responsible for constitutive activity) revert back rapidly to the state R, due to the low energy barrier of the R* → R transition.
Figure 2. Ligand binding and receptor activation as 2D energy landscapes: induced-fit vs. conformational selection.

The left panels represent the energy of the receptor along the activation pathway. The minima in the landscapes correspond to stable conformations, connected through saddle points representing conformational changes. The right panels represent the stable conformations in each landscape, where size is proportional to population of the conformer. Translucent figures correspond to transient conformations. The middle panel shows a receptor that in the absence of ligand exists in two conformations, R and R*, with a higher population of the lowest energy conformer, R. In an induced-fit scenario (bottom), the ligand binds to the conformation R to create the R·L complex. Ligand binding alters the energy landscape of the complex (red line), which accelerates activation, stabilizes the complex and provides the energy to induce the conformational changes to R*·L (red arrows). These effects result in an increase of the population of the R*·L conformation. In conformational selection (top panel), the ligand binds to and stabilizes the active conformation R*. Alteration of the energy landscape (blue line) results in a population shift of the receptor conformations towards the R*·L active state.
These simplified energy landscapes can be used to illustrate the difference between receptor activation by an induced-fit mechanism or by conformational selection. In an induced-fit scenario (Figure 2, bottom panel), the ligand binds to the conformation R to create the R·L complex, which possess a different energy landscape (red line) than the “empty” receptor (grey line). In this case, ligand binding accelerates activation by lowering the energy of the conformational transition to R*·L. In addition, ligand-receptor interactions stabilize the complex resulting in a lower conformational energy of R*·L. Ligand binding also provides the energy to induce the conformational changes that allow crossing the energy barrier to R*·L (red arrows). These effects are ultimately translated in an increase of the population of the R*·L conformation (Figure 2, bottom right panel). On the other hand, in conformational selection (Figure 2, top panel), the ligand binds to and stabilizes (i.e. lowers the energy) the active conformation R*, resulting in a change of the energy landscape (blue line) for the R*L complex. In the new landscape, the transition to the inactive form R·L becomes unfavorable, due to the higher energy of the R·L complex and a higher energy barrier for this transition. Thus, alteration of the shape of the energy landscape results in a population shift of the receptor conformations towards the R*·L active state (Figure 2, top right panel).
Once an equilibrium state has been reached between ligand, receptor and the complex, activation by induced-fit or by conformational selection may result in completely indistinguishable states. The fundamental difference between these mechanisms resides in the first stages of ligand-receptor interaction and activation. The great structural diversity of the natural GPCR ligands, ranging from ions and small organic molecules to peptides and glycoprotein hormones, suggests important differences in those first stages, which may be related, to some extent, to different ligands activating the receptor either by induced-fit or conformational selection. For instance, while rhodopsin (6) and the angiotensin AT1 receptor (22) appear to operate primarily by an induced-fit mechanism, β2AR ligands may function by selecting specific receptor substates (25).
In the following sections we discuss the differences between these two models of activation in terms of energy landscapes, using rhodopsin and the β2AR as model systems.
Energy landscapes of rhodopsin activation
Most of our knowledge of GPCR activation has originated from rhodopsin. A variety of techniques, particularly spectroscopic methods, have revealed several metastable intermediates in the rhodopsin activation pathway (21). In addition, the two-dimensional energy landscape of this mechanism has been delineated by calorimetric and reaction kinetic experiments (9, 42). Rhodopsin activation implies a linear pathway along this energy landscape, which is schematically depicted in Figure 3, top panels. Inactive (dark) rhodopsin is trapped in a deep energy well (panel A, broken line). The stability of this conformation, which cannot overcome the energy barrier (i.e. change conformation) to populate active states, results in the absence of constitutive activity of rhodopsin. Retinal isomerization upon light absorption transforms the 11-cis retinal inverse agonist into the all-trans retinal agonist, generating a series of ligand-receptor steric clashes that increase the energy of the system and change the shape of the energy landscape (panel A, solid grey line). As the receptor structure relaxes, the intermediate active states (Batho, Lumi and Meta I) become energetically available and get populated. The crystal structures of Batho (32) and Lumi (33) show only small local structural changes in the binding pocket, and the electron cryomicroscopy density map of Meta I (39) reveals only a modest rearrangement in TM6 at the level of the binding site. Also, infrared spectroscopy on azido-labeled rhodopsin suggests a small rotation of TM6 and movement of the cytoplasmic side of TM5 at the Meta I stage(53). The ionic interaction between Arg135(3.50) and Glu247(6.30) (the Ballesteros-Weinstein general number (4) of residues is given in parenthesis), which has been suggested to stabilize the inactive conformation of GPCRs (3), is, in fact, relatively weak (49) and may become partially opened already in Meta I (53). These early intermediates are formed in microseconds, due to the low energy barriers between them, and the reaction displaces almost completely to the lower energy Meta I conformation. Subsequent transition to the Meta II states constitutes a rate-limiting step, due to a higher energy barrier. Activation proceeds by sequential formation of the Meta IIa, Meta IIb (by rigid-body movement of TM6) and Meta IIbH+ (by neutralization of Glu134(3.49) in the ERY motif of TM3) intermediates. These Meta species exist in a G protein-dependent equilibrium, reached after a few milliseconds. G protein binding to Meta IIb/Meta IIbH+ lowers the energy of the ternary complex (Figure 3B, solid black line) and displaces this equilibrium towards these forms (see (21) for a comprehensive review on this process). In summary, retinal isomerization provides the energy for the receptor to “jump” the high initial activation barrier and proceed through activation along the energy landscape through small structural changes to the Meta I state. Subsequently, larger-scale conformational rearrangements and changes in protonation states lead to formation of an equilibrium between the Meta forms. Finally, G protein binding further changes the energy landscape, displacing the equilibrium to the active form of the receptor, capable of catalyze the GDP-GTP exchange in the G protein. Other works (5) show that there are additional rhodopsin conformations (as Meta III) that create “bifurcations” in the activation pathway. The graphical representation of such a process as an energy landscape would require more than two dimensions (see below).
Figure 3. Energy landscapes of rhodopsin and β2AR activation.

A. Inactive (dark) rhodopsin is trapped in a deep energy well (broken line). Retinal isomerization provides the energy for the receptor to overcome the high initial activation barrier and proceed along the energy landscape through small conformational changes (Batho and Lumi) to the Meta I state (MI). Subsequently, activation proceeds by formation of the Meta IIa (MIIa), Meta IIb (MIIb, by rigid-body movement of TM6) and Meta IIbH+ (MIIbH+, by neutralization of Glu134(3.49) in the ERY motif of TM3) intermediates, and establishment of an equilibrium between the Meta forms. B. G protein binding further changes the energy landscape (black line), displacing the equilibrium to the active ternary complex, capable of catalyze the GDP-GTP exchange in the G protein. C. The β2AR possesses a shallow energy landscape, with several conformational states (R, R′, R″, that differ in small structural changes in TM5 and TM7) separated by relatively low energy barriers (broken line). This translates in an inherent flexibility that allows the ligand-free receptor to explore different conformations. Ligand binding to certain intermediates (R″ in this example) changes the shape of the energy landscape (solid line), and activation proceeds to populate conformations of lower energy (R‴L and R*L). These conformations probably involve a similar set of conformational changes than rhodopsin, i.e. rearrangement of TM6 and neutralization of Asp130(3.49) in the DRY motif of TM3. D. Binding of the G protein to these latter states further changes the energy landscape (black line), lowering the energy and stabilizing the active ternary complex.
According to this view, rhodopsin activation represents an extreme case of induced-fit: the ligand is covalently bound in an occluded binding site as an inverse agonist that is transformed into a covalently bound agonist upon absorption of a photon. The resulting ligand-receptor clashes and subsequent small-scale rearrangements in the receptor backbone and side chains to optimize the agonist-bound form end up stabilizing larger conformational changes, changes in protonation states and, ultimately, in the stabilization of an active state.
Energy landscapes of β2AR activation
There is substantial evidence for a common mechanism of activation between rhodopsin and the rest of Class A GPCRs. Members of this large and diverse family activate one or more members of the relatively small family of highly homologous G proteins. Accordingly, GPCRs display a higher sequence similarity in the cytoplasmic side of the transmembrane bundle (31), which contains the residues involved in receptor activation and in G protein coupling (28). A diversity of biophysical and biochemical studies in different families of GPCRs (see (11) for a review) provide direct evidence of similar conformational changes underlying GPCR activation. Thus, the considerable amount of information about rhodopsin activation, and its representation in terms of energy landscapes, can serve as a framework to discuss activation of other GPCRs using the β2AR as a model system.
Unlike rhodopsin, the β2AR is not trapped in a fully inactive conformation in the absence of agonist, but possesses an inherent conformational flexibility that allows the ligand-free receptor to explore different conformations (17, 36). This suggests a shallow energy landscape, with several conformational states separated by relatively low energy barriers (Figure 3C, broken line). On the other hand, the remarkable diversity of ligands and the low sequence conservation in the ligand-binding domains indicates the existence of profound differences in the process of ligand binding and ligand-receptor interactions among GPCRs. For a rhodopsin-like activation by induced-fit, the agonist would have to bind to the receptor with high affinity and use this high binding energy to initiate conformational changes (i.e. “jump” the first energy barrier, as in retinal isomerization). However, the relatively low affinity and rapid dissociation rates observed for β2AR agonists (16) are not consistent with induced-fit, and suggest conformational selection. In this scenario, an agonist would bind to a similar extent diverse conformations in the receptor ensemble. Most of the binding events are transient and the ligand can escape back to the solvent. However, when the agonist binds to certain conformational intermediates (R″ in Figure 3C), ligand-receptor interactions are more favorable and the complex is stabilized (i.e. lowers its energy). In this case, the binding event changes the shape of the energy landscape (solid line), and the ligand-receptor complex “proceeds forward” and populates conformations of lower energy (R‴L and R*L). Similarly to rhodopsin, binding of the G protein to these states further changes the energy landscape (Figure 3D), stabilizing (i.e. lowering the energy) of the ternary complex, which becomes the predominant conformation. The latter states in β2AR activation, which would be analogous to the Meta II states in rhodopsin activation, involve a similar set of conformational changes, i.e. rearrangement of TM6 and neutralization of Asp130(3.49) in the DRY motif of TM3 (11). In this case, the ionic interaction between TM3 and TM6, mediated by Arg131(3.50) and Glu268(6.30), is even weaker than in rhodopsin. The crystal structures of β1AR (50) and β2AR (38) show that this interaction is labile even in inactive states. In addition, molecular dynamics studies on the β2AR (14) suggest that this interaction exists in equilibrium between formed and broken states.
According to this view of activation, partial agonism can be visualized in different ways. On one hand, it has been shown that the duration of the binding event is correlated to agonist efficacy, i.e. partial agonists dissociate faster than full agonists, and, as a result, not all binding events last long enough to promote activation of the G protein cycle (46). Another non-excluding possibility is that partial agonists stabilize different intermediate conformations (17, 45, 52) that lead to alternate activation pathways and to non-optimal G protein activation (see below).
Extension to 3D energy landscapes
Two-dimensional energy landscapes, where energy is represented as a function of a single reaction coordinate (Figures 2 and 3), are relatively easy to interpret. However, they are not suitable to consider complex situations, as receptors with rich pharmacological properties (synthetic inverse agonists, antagonists, partial agonists and superagonists, in addition to natural full agonists), or dissection of the reaction pathway in discrete non-sequential conformational changes. In these cases, consideration of an additional reaction coordinate, i.e. the extension to three-dimensional (3D) energy landscapes, provides an additional degree of freedom that allows a more detailed study of the activation process. Specifically, the reaction coordinate (x axis in Figures 2 and 3) can be decomposed in two sets of conformational changes (e.g. activation pathways) that, in turn, can be used to visualize alternate routes of activation along the energy landscape. These sets of conformational changes can be extracted from the activation pathways depicted in Figure 4, which aggregate a series of smaller local conformational changes into specific activation pathways. For instance, in the 3D energy landscapes depicted in Figure 5 we represent energy in the z axis (color) as a function of the conformational changes in TM7 and TM6 (in the x axis), and of the conformational changes in TM5 and neutralization of Asp130(3.49) in the DRY motif of TM3 (in the y axis). Activation follows the path traced by the lines in the 3D landscapes. Slicing the 3D surface along these paths results into the simpler 2D landscapes depicted in the right panels.
Figure 4. Pathways in the activation mechanism of β2AR.

This figure represents epinephrine (shown as spheres) bound to the β2AR (TM5, green; TM6, blue; TM7/helix 8, cyan). Receptor activation comprises a series of conformational changes that aggregate into specific activation pathways. Agonists interact with a group of Ser residues on the extracellular side of TM5 (Ser203(5.42), Ser204(5.43) and Ser207(5.46)) involved in ligand binding and receptor activation (44, 45). This interaction disrupts the TM3/TM5 interface at the binding site (35), and these local changes are transmitted to the cytoplasmic side of the helix through the rearrangement of the Pro-induced distortion of TM5 (green arrow) (Sansuk et al., Mol Pharmacol under review)(47). Agonists also induce/stabilize the rigid body movement of TM6 (blue arrow) through their action on Trp(6.48). A complex hydrogen bond network between highly conserved residues and a cluster of water molecules in the TM2-TM6-TM7 interface seems responsible for stabilizing the pi-helix segment observed in the inactive state of rhodopsin(26). This network is most likely conserved in other Class A GPCRs (1), and has a structural and functional role (34). Specifically, we suggest that agonist binding induces changes in this network, which results in local structural changes in the NPxxY motif and in a relocation of the cytoplamic side of TM7 (cyan arrow). These pathways involve highly conserved residues, and are probably conserved in other Family A GPCRs. This figure has been created with PyMOL (DeLano, W.L. The PyMOL Molecular Graphics System (2002) on World Wide Web http://www.pymol.org).
Figure 5. Theoretical energy landscapes and activation pathways for the interaction between the β2AR and ligands of different efficacies.
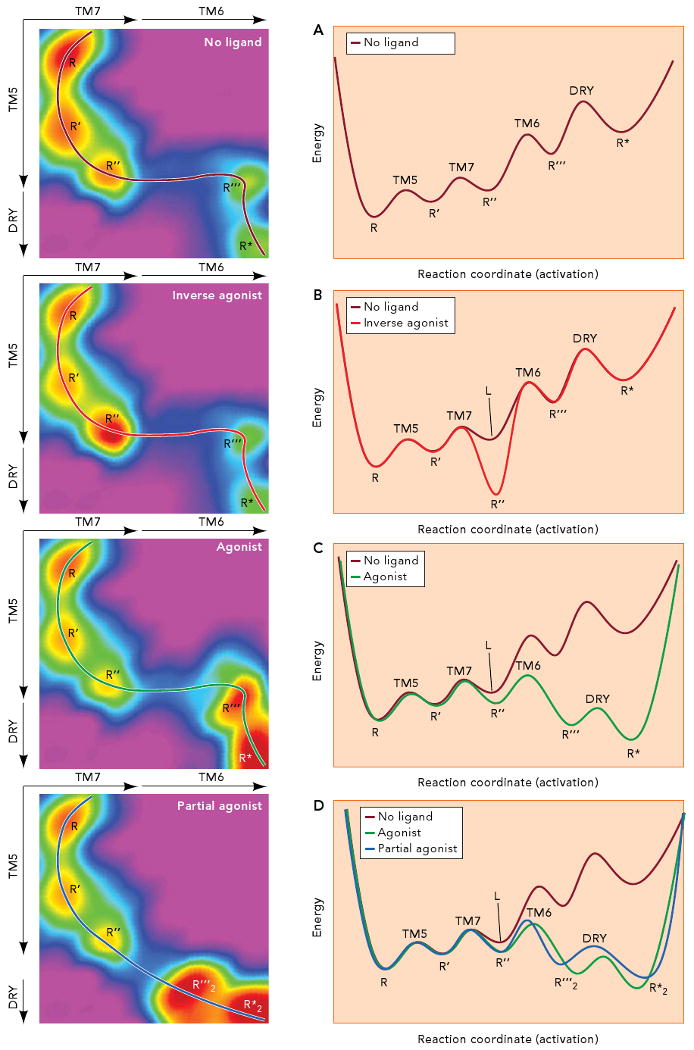
The left panels represent energy in the z axis (color) as a function of the conformational changes in TM7 and TM6 (in the x axis), and of the conformational changes in TM5 and neutralization of Asp130(3.49) in the DRY motif (in the y axis). Activation follows the path traced by the lines in the 3D landscapes. Slicing the 3D surface along these paths results into the simpler 2D landscapes depicted in the right panels. A. In the absence of ligand, small conformational changes in the TM3/TM5 interface and plasticity in the water cluster around the NPxxY motif result in a receptor population that fluctuates between the R, R′ and R″ conformations. The conformations R‴ and R* can get populated by movement of TM6 and neutralization of Asp130(3.49) in the DRY motif of TM3. The R* conformation is able to bind to and activate the G protein, resulting in certain constitutive activity. B. Binding of an inverse agonist stabilizes the R″ conformation, where TM5 and TM7 are slightly rearranged, resulting in a change of the receptor energy landscape (compare panels A and B). As a result, the receptor gets trapped in the R″ conformation. C. An agonist binds to and select the R″ conformation and changes the energy landscape in such a way that the barrier to reach R‴ (i.e. to move TM6) is lowered. The stabilized open crevice in the cytoplasmic side favors the neutralization of Asp130(3.49) in the DRY motif so Arg131(3.50) can reach the extended conformation needed for binding of the G protein. D. A partial agonist binds to and stabilizes R″ to induce a change in the energy landscape. In this case, a conformation R‴2, different from the R‴ conformation stabilized by agonists, becomes available. In this new energy landscape (compare panels C and D), the lower energy conformation corresponds to R*2, which can be somewhat different from R*, but with enough overlapping so it is also able to bind to and activate the G protein. Thus, the stabilization of a new energy landscape implies that the receptor must follow a different activation pathway (compare the black and grey lines in panels C and D).
Conformational changes of TM6 upon activation of different receptors have been measured from EPR and fluorescence spectroscopy. Also, structural changes in TM5 are evident in the opsin, adrenergic and adenosine structures. However, the basis and extent of the structural changes in TM7 upon activation have not been studied in detail yet. In rhodopsin, residues K296(7.43)-A299(7.46) form a short 310 helical segment that results in a strong local tightening of the helix, maintained by a complex inter-helical hydrogen bond network that involves water molecules (Li et al., J Mol Biol (2004) vol. 343 (5) pp. 1409-38). A detailed analysis of the crystal structures of opsin reveals that the tightening in TM7 due to the 310 segment is significantly reduced. Although only five water molecules per monomer were modeled in the refinement of the opsin structure due to weak electron density, and none of them in the TM2-TM3-TM6-TM7 pocket, the partial recovery of the local alpha-helical structure must result in the displacement of some of the waters observed in the structure of rhodopsin. These local changes ultimately result in the partial relocation of the side chain of Y306(7.53), part of the NPxxY motif, which gets closer to center of the transmembrane bundle. If the structures of dark rhodopsin and opsin are used to model the beginning and end of the activation process, we can hypothesize that plasticity in the water cluster around the NPxxY motif of TM7 results in conformational changes in the cytoplasmic side of this helix, which represents an additional pathway in rhodopsin activation (Figure 4, cyan arrow). Interestingly, in the currently available non-rhodopsin structures, which correspond to inactive states, the cytoplasmic sides of TM7 resembles the structure of opsin, resulting in Tyr(7.53) facing the protein core. Thus, the corresponding region in rhodopsin (with Tyr306(7.53) engaged in a aromatic-aromatic interaction with Phe313 in helix 8) may be partially responsible for locking rhodopsin in a totally inactive state, that cannot proceed further in the energy landscape to populate meta-active conformations.
According to this convention, Figure 5 depicts a number of theoretical 3D energy landscapes for the activation of β2AR. Panel A shows the energy landscapes of the receptor in the absence of ligand. The receptor population fluctuates between the low energy conformations R, R′ and R″, separated by low energy barriers. In terms of structure, conformational changes in the TM3/TM5 interface and plasticity in the water cluster around the NPxxY motif result in conformational changes in the cytoplasmic sides of TM5 and TM7 that stabilize different conformations. If the energy barrier that leads to R‴ (related to movement of TM6) is low enough, the conformation R‴ is kinetically available and can get populated. The “open” cytoplasmic side facilitates neutralization of Asp130(3.49) in the DRY motif of TM3, which stabilizes the R* conformation, able to bind to and activate the G protein. In this case, the receptor will show certain constitutive activity. Panel B depicts the effect of an inverse agonist on the receptor energy landscape. The crystal structure of the β2AR bound to carazolol (38) shows that this ligand stabilizes a conformation where TM5 and TM7 have rearranged compared to the crystal structure of rhodopsin, which we use as a reference of a GPCR “locked” in a purely inactive state. In our theoretical energy landscape, carazolol would bind (i.e. select) and stabilize conformation R″ and change the overall energy landscape of the receptor (compare panels A and B). As a result, the energy barriers to escape this conformation are higher, and the receptor gets trapped. This is a way to visualize the stabilizing effect of inverse agonists in receptor conformation. In this particular case, ligand binding precludes the movement of TM6, required to reach the active states. Panel C shows the possible effect of a full agonist on the β2AR energy landscape. An agonist can also bind to and select the R″ conformation. However, the optimized agonist-receptor interactions change the energy landscape in such a way that the barrier to reach R‴ (i.e. to move TM6) is lowered. The stabilized open crevice in the cytoplasmic side favors the neutralization of Asp130(3.49) in the DRY motif so Arg131(3.50) can reach the extended conformation needed for binding of the G protein, as seen in the structure of activated opsin (40). Panel D shows a possible mechanism for partial agonism in terms of energy landscapes. A partial agonist can also bind to and stabilize R″ to induce a change in the energy landscape. In this case, a conformation R‴2, different from the R‴ conformation stabilized by agonists, becomes available. In terms of structure, this could represent, for instance, a slightly different relocation of TM6. In this new energy landscape (compare panels C and D), the lower energy conformation corresponds to R*2, which can be somewhat different from R*, but with enough overlapping so it is also able to bind to and activate the G protein. Thus, the stabilization of a new energy landscape implies that the receptor must follow a different activation pathway (compare the black and grey lines in panels C and D). This last example shows how the use of 3D landscapes results in an easier way to depict activation by different ligands resulting in specific conformational changes that can be shown as new pathways in altered energy landscapes.
Conclusions
Activation of GPCRs occurs through a series of conformational intermediates, that can be visualized as wells in an energy landscape. Ligands influence GPCR function by shifting this conformational equilibrium and changing the shape of the landscapes.
In addition to ligand binding, there are many elements that can influence energy landscapes (Figure 1). One of the major factors is protein-protein interactions, either within the membrane (oligomerization and interaction with other membrane proteins) or with extracellular and intracellular partners. For instance, the SII peptide is able to trigger arrestin-specific activation pathways in the angiotensin II receptor (51) possibly by stabilizing certain conformations in a SII-specific energy landscape. The environment also influences GPCR function. For instance, protonation of Glu134(3.49) in the key (E/D)RY motif is a thermodynamic prerequisite for full receptor activation in membranes, but not in detergent (27). Moreover, it has been shown that changes in cell membrane tension and fluidity (7) and in membrane voltage (30) may modulate GPCR activation by affecting conformational dynamics and altering their ability to couple to the G protein. In addition, it has been extensively shown that GPCR activation is pH dependent (18, 29). Finally, post-translational modifications, as glycosilation, phosphorylation or acylation also have a role. For instance, phosphorylation of GPCRs by kinases stabilizes conformations that can be recognized by arrestins (43). These factors are key to translating the dynamic behavior of the protein into ordered function.
To characterize the energy landscapes of GPCR activation we need to identify the local energy minima in a given reaction pathway, i.e. the intermediate (meta)stable GPCR conformations along the activation process. These intermediates can be identified through X-ray crystallography (e.g. by crystallizing GPCR-effector complexes), electron microscopy (39) or, at a lower resolution, by fluorescence spectroscopy (25). In addition, we also need to determine the free energy of activation from the rates of interconversion as well as relative free energies of the sub-states from the relative populations. These kinetic and thermodynamic parameters can be obtained by Carr-Purcell-Meiboom-Gill (CPMG) nuclear magnetic resonance spectroscopy experiments (15). In addition, CPMG dispersions can detect transient conformers representing only 0.5% of the ensemble population. These rare conformational states are key steps in the activation pathways of GPCRs, but their structure is impossible to access by crystallography.
In summary, energy landscapes are a useful tool to connect GPCR structure, dynamics and function. Understanding how ligands stabilize different functional states on the energy landscape is key to understanding the structural basis of efficacy. Moreover, characterizing the reaction pathways and identifying intermediate conformational states, may facilitate the development of more selective drugs capable of modulating a specific signaling pathway, thereby improving therapeutic activity and minimizing undesirable side effects.
Acknowledgments
This work was supported by the Ministerio de Educación y Ciencia (Spain) through the Ramon y Cajal Program (to X.D.) and the National Institutes of Health Grant NS028471 and the Mathers Charitable Foundation (to B.K.K.)
Contributor Information
Xavier Deupi, Email: Xavier.Deupi@uab.cat.
Brian K. Kobilka, Email: kobilka@stanford.edu.
Bibliography
- 1.Angel TE, Chance MR, Palczewski K. Conserved waters mediate structural and functional activation of family A (rhodopsin-like) G protein-coupled receptors. Proc Natl Acad Sci U S A. 2009;106:8555–8560. doi: 10.1073/pnas.0903545106. [DOI] [PMC free article] [PubMed] [Google Scholar]
- 2.Azzi M, Charest PG, Angers S, Rousseau G, Kohout T, Bouvier M, Pineyro G. Beta-arrestin-mediated activation of MAPK by inverse agonists reveals distinct active conformations for G protein-coupled receptors. Proc Natl Acad Sci U S A. 2003;100:11406–11411. doi: 10.1073/pnas.1936664100. [DOI] [PMC free article] [PubMed] [Google Scholar]
- 3.Ballesteros JA, Jensen AD, Liapakis G, Rasmussen SG, Shi L, Gether U, Javitch JA. Activation of the beta 2-adrenergic receptor involves disruption of an ionic lock between the cytoplasmic ends of transmembrane segments 3 and 6. J Biol Chem. 2001;276:29171–29177. doi: 10.1074/jbc.M103747200. [DOI] [PubMed] [Google Scholar]
- 4.Ballesteros JA, Weinstein H. Integrated methods for the construction of three dimensional models and computational probing of structure function relations in G protein-coupled receptors. In: Sealfon SC, Conn PM, editors. Methods in Neurosciences. San Diego, CA: Academic Press; 1995. pp. 366–428. [Google Scholar]
- 5.Bartl FJ, Vogel R. Structural and functional properties of metarhodopsin III: recent spectroscopic studies on deactivation pathways of rhodopsin. Phys Chem Chem Phys. 2007;9:1648–1658. doi: 10.1039/b616365c. [DOI] [PubMed] [Google Scholar]
- 6.Brown MF, Salgado GF, Struts AV. Retinal dynamics during light activation of rhodopsin revealed by solid-state NMR spectroscopy. Biochim Biophys Acta. 2009 doi: 10.1016/j.bbamem.2009.08.013. [DOI] [PMC free article] [PubMed] [Google Scholar]
- 7.Chachisvilis M, Zhang YL, Frangos JA. G protein-coupled receptors sense fluid shear stress in endothelial cells. Proc Natl Acad Sci U S A. 2006;103:15463–15468. doi: 10.1073/pnas.0607224103. [DOI] [PMC free article] [PubMed] [Google Scholar]
- 8.Cherezov V, Rosenbaum DM, Hanson MA, Rasmussen SG, Thian FS, Kobilka TS, Choi HJ, Kuhn P, Weis WI, Kobilka BK, Stevens RC. High-resolution crystal structure of an engineered human beta2-adrenergic G protein-coupled receptor. Science. 2007;318:1258–1265. doi: 10.1126/science.1150577. [DOI] [PMC free article] [PubMed] [Google Scholar]
- 9.Cooper A. Rhodopsin photoenergetics: lumirhodopsin and the complete energy profile. FEBS Lett. 1981;123:324–326. doi: 10.1016/0014-5793(81)80319-5. [DOI] [PubMed] [Google Scholar]
- 10.Daaka Y, Luttrell LM, Lefkowitz RJ. Switching of the coupling of the beta2-adrenergic receptor to different G proteins by protein kinase A. Nature. 1997;390:88–91. doi: 10.1038/36362. [DOI] [PubMed] [Google Scholar]
- 11.Deupi X, Kobilka BK. Activation of g protein-coupled receptors. Adv Protein Chem. 2007;74:137–166. doi: 10.1016/S0065-3233(07)74004-4. [DOI] [PubMed] [Google Scholar]
- 12.Devic E, Xiang Y, Gould D, Kobilka B. Beta-adrenergic receptor subtype-specific signaling in cardiac myocytes from beta(1) and beta(2) adrenoceptor knockout mice. Mol Pharmacol. 2001;60:577–583. [PubMed] [Google Scholar]
- 13.Dixon RA, Kobilka BK, Strader DJ, Benovic JL, Dohlman HG, Frielle T, Bolanowski MA, Bennett CD, Rands E, Diehl RE, Mumford RA, Slater EE, Sigal IS, Caron MG, Lefkowitz RJ, Strader CD. Cloning of the gene and cDNA for mammalian beta-adrenergic receptor and homology with rhodopsin. Nature. 1986;321:75–79. doi: 10.1038/321075a0. [DOI] [PubMed] [Google Scholar]
- 14.Dror RO, Jensen MO, Shaw DE. Elucidating membrane protein function through long-timescale molecular dynamics simulation. Conf Proc IEEE Eng Med Biol Soc. 2009;1:2340–2342. doi: 10.1109/IEMBS.2009.5335057. [DOI] [PubMed] [Google Scholar]
- 15.Gardino AK, Kern D. Functional dynamics of response regulators using NMR relaxation techniques. Methods Enzymol. 2007;423:149–165. doi: 10.1016/S0076-6879(07)23006-X. [DOI] [PubMed] [Google Scholar]
- 16.Gether U, Lin S, Kobilka BK. Fluorescent labeling of purified beta 2 adrenergic receptor. Evidence for ligand-specific conformational changes. J Biol Chem. 1995;270:28268–28275. doi: 10.1074/jbc.270.47.28268. [DOI] [PubMed] [Google Scholar]
- 17.Ghanouni P, Gryczynski Z, Steenhuis JJ, Lee TW, Farrens DL, Lakowicz JR, Kobilka BK. Functionally different agonists induce distinct conformations in the G protein coupling domain of the beta 2 adrenergic receptor. J Biol Chem. 2001;276:24433–24436. doi: 10.1074/jbc.C100162200. [DOI] [PubMed] [Google Scholar]
- 18.Ghanouni P, Schambye H, Seifert R, Lee TW, Rasmussen SG, Gether U, Kobilka BK. The effect of pH on beta(2) adrenoceptor function. Evidence for protonation-dependent activation. J Biol Chem. 2000;275:3121–3127. doi: 10.1074/jbc.275.5.3121. [DOI] [PubMed] [Google Scholar]
- 19.Hansen DF, Vallurupalli P, Kay LE. Using relaxation dispersion NMR spectroscopy to determine structures of excited, invisible protein states. J Biomol NMR. 2008;41:113–120. doi: 10.1007/s10858-008-9251-5. [DOI] [PubMed] [Google Scholar]
- 20.Henzler-Wildman K, Kern D. Dynamic personalities of proteins. Nature. 2007;450:964–972. doi: 10.1038/nature06522. [DOI] [PubMed] [Google Scholar]
- 21.Hofmann KP, Scheerer P, Hildebrand PW, Choe HW, Park JH, Heck M, Ernst OP. A G protein-coupled receptor at work: the rhodopsin model. Trends Biochem Sci. 2009;34:540–552. doi: 10.1016/j.tibs.2009.07.005. [DOI] [PubMed] [Google Scholar]
- 22.Hunyady L, Vauquelin G, Vanderheyden P. Agonist induction and conformational selection during activation of a G-protein-coupled receptor. Trends Pharmacol Sci. 2003;24:81–86. doi: 10.1016/S0165-6147(02)00050-0. [DOI] [PubMed] [Google Scholar]
- 23.Kenakin T. Ligand-selective receptor conformations revisited: the promise and the problem. Trends Pharmacol Sci. 2003;24:346–354. doi: 10.1016/S0165-6147(03)00167-6. [DOI] [PubMed] [Google Scholar]
- 24.Kenakin TP. 7TM receptor allostery: putting numbers to shapeshifting proteins. Trends Pharmacol Sci. 2009;30:460–469. doi: 10.1016/j.tips.2009.06.007. [DOI] [PubMed] [Google Scholar]
- 25.Kobilka BK, Deupi X. Conformational complexity of G-protein-coupled receptors. Trends Pharmacol Sci. 2007;28:397–406. doi: 10.1016/j.tips.2007.06.003. [DOI] [PubMed] [Google Scholar]
- 26.Li J, Edwards PC, Burghammer M, Villa C, Schertler GF. Structure of bovine rhodopsin in a trigonal crystal form. J Mol Biol. 2004;343:1409–1438. doi: 10.1016/j.jmb.2004.08.090. [DOI] [PubMed] [Google Scholar]
- 27.Ludeke S, Mahalingam M, Vogel R. Rhodopsin activation switches in a native membrane environment. Photochem Photobiol. 2009;85:437–441. doi: 10.1111/j.1751-1097.2008.00490.x. [DOI] [PubMed] [Google Scholar]
- 28.Madabushi S, Gross AK, Philippi A, Meng EC, Wensel TG, Lichtarge O. Evolutionary trace of G protein-coupled receptors reveals clusters of residues that determine global and class-specific functions. J Biol Chem. 2004;279:8126–8132. doi: 10.1074/jbc.M312671200. [DOI] [PubMed] [Google Scholar]
- 29.Mahalingam M, Martinez-Mayorga K, Brown MF, Vogel R. Two protonation switches control rhodopsin activation in membranes. Proc Natl Acad Sci U S A. 2008;105:17795–17800. doi: 10.1073/pnas.0804541105. [DOI] [PMC free article] [PubMed] [Google Scholar]
- 30.Mahaut-Smith MP, Martinez-Pinna J, Gurung IS. A role for membrane potential in regulating GPCRs? Trends Pharmacol Sci. 2008;29:421–429. doi: 10.1016/j.tips.2008.05.007. [DOI] [PubMed] [Google Scholar]
- 31.Mirzadegan T, Benkö G, Filipek S, Palczewski K. Sequence analyses of G-protein-coupled receptors: similarities to rhodopsin. Biochemistry. 2003;42:2759–2767. doi: 10.1021/bi027224+. [DOI] [PMC free article] [PubMed] [Google Scholar]
- 32.Nakamichi H, Okada T. Crystallographic analysis of primary visual photochemistry. Angew Chem Int Ed Engl. 2006;45:4270–4273. doi: 10.1002/anie.200600595. [DOI] [PubMed] [Google Scholar]
- 33.Nakamichi H, Okada T. Local peptide movement in the photoreaction intermediate of rhodopsin. Proc Natl Acad Sci USA. 2006;103:12729–12734. doi: 10.1073/pnas.0601765103. [DOI] [PMC free article] [PubMed] [Google Scholar]
- 34.Pardo L, Deupi X, Dolker N, Lopez-Rodriguez ML, Campillo M. The role of internal water molecules in the structure and function of the rhodopsin family of G protein-coupled receptors. Chembiochem. 2007;8:19–24. doi: 10.1002/cbic.200600429. [DOI] [PubMed] [Google Scholar]
- 35.Patel AB, Crocker E, Reeves PJ, Getmanova EV, Eilers M, Khorana HG, Smith SO. Changes in interhelical hydrogen bonding upon rhodopsin activation. J Mol Biol. 2005;347:803–812. doi: 10.1016/j.jmb.2005.01.069. [DOI] [PubMed] [Google Scholar]
- 36.Peleg G, Ghanouni P, Kobilka BK, Zare RN. Single-molecule spectroscopy of the beta(2) adrenergic receptor: observation of conformational substates in a membrane protein. Proc Natl Acad Sci U S A. 2001;98:8469–8474. doi: 10.1073/pnas.151239698. [DOI] [PMC free article] [PubMed] [Google Scholar]
- 37.Rasmussen SG, Choi HJ, Rosenbaum DM, Kobilka TS, Thian FS, Edwards PC, Burghammer M, Ratnala VR, Sanishvili R, Fischetti RF, Schertler GF, Weis WI, Kobilka BK. Crystal structure of the human beta2 adrenergic G-protein-coupled receptor. Nature. 2007;450:383–387. doi: 10.1038/nature06325. [DOI] [PubMed] [Google Scholar]
- 38.Rosenbaum DM, Cherezov V, Hanson MA, Rasmussen SGF, Thian FS, Kobilka TS, Choi HJ, Yao XJ, Weis WI, Stevens RC, Kobilka BK. GPCR engineering yields high-resolution structural insights into beta2-adrenergic receptor function. Science. 2007;318:1266–1273. doi: 10.1126/science.1150609. [DOI] [PubMed] [Google Scholar]
- 39.Ruprecht JJ, Mielke T, Vogel R, Villa C, Schertler GF. Electron crystallography reveals the structure of metarhodopsin I. EMBO J. 2004;23:3609–3620. doi: 10.1038/sj.emboj.7600374. [DOI] [PMC free article] [PubMed] [Google Scholar]
- 40.Scheerer P, Park JH, Hildebrand PW, Kim YJ, Krauss N, Choe HW, Hofmann KP, Ernst OP. Crystal structure of opsin in its G-protein-interacting conformation. Nature. 2008;455:497–502. doi: 10.1038/nature07330. [DOI] [PubMed] [Google Scholar]
- 41.Shenoy SK, Drake MT, Nelson CD, Houtz DA, Xiao K, Madabushi S, Reiter E, Premont RT, Lichtarge O, Lefkowitz RJ. beta-arrestin-dependent, G protein-independent ERK1/2 activation by the beta2 adrenergic receptor. J Biol Chem. 2006;281:1261–1273. doi: 10.1074/jbc.M506576200. [DOI] [PubMed] [Google Scholar]
- 42.Shichida Y, Imai H. Visual pigment: G-protein-coupled receptor for light signals. Cellular and Molecular Life Sciences. 1998;54:1299–1315. doi: 10.1007/s000180050256. [DOI] [PMC free article] [PubMed] [Google Scholar]
- 43.Shukla AK, Violin JD, Whalen EJ, Gesty-Palmer D, Shenoy SK, Lefkowitz RJ. Distinct conformational changes in beta-arrestin report biased agonism at seven-transmembrane receptors. Proc Natl Acad Sci U S A. 2008;105:9988–9993. doi: 10.1073/pnas.0804246105. [DOI] [PMC free article] [PubMed] [Google Scholar]
- 44.Strader CD, Candelore MR, Hill WS, Sigal IS, Dixon RA. Identification of two serine residues involved in agonist activation of the beta-adrenergic receptor. J Biol Chem. 1989;264:13572–13578. [PubMed] [Google Scholar]
- 45.Swaminath G, Deupi X, Lee TW, Zhu W, Thian FS, Kobilka TS, Kobilka BK. Probing the beta2 adrenoceptor binding site with catechol reveals differences in binding and activation by agonists and partial agonists. J Biol Chem. 2005;280:22165–22171. doi: 10.1074/jbc.M502352200. [DOI] [PubMed] [Google Scholar]
- 46.Sykes DA, Dowling MR, Charlton SJ. Exploring the mechanism of agonist efficacy: a relationship between efficacy and agonist dissociation rate at the muscarinic M3 receptor. Mol Pharmacol. 2009;76:543–551. doi: 10.1124/mol.108.054452. [DOI] [PubMed] [Google Scholar]
- 47.Tate CG, Schertler GF. Engineering G protein-coupled receptors to facilitate their structure determination. Curr Opin Struct Biol. 2009;19:386–395. doi: 10.1016/j.sbi.2009.07.004. [DOI] [PubMed] [Google Scholar]
- 48.Violin JD, Lefkowitz RJ. Beta-arrestin-biased ligands at seven-transmembrane receptors. Trends Pharmacol Sci. 2007;28:416–422. doi: 10.1016/j.tips.2007.06.006. [DOI] [PubMed] [Google Scholar]
- 49.Vogel R, Mahalingam M, Ludeke S, Huber T, Siebert F, Sakmar TP. Functional role of the “ionic lock”--an interhelical hydrogen-bond network in family A heptahelical receptors. J Mol Biol. 2008;380:648–655. doi: 10.1016/j.jmb.2008.05.022. [DOI] [PubMed] [Google Scholar]
- 50.Warne T, Serrano-Vega MJ, Baker JG, Moukhametzianov R, Edwards PC, Henderson R, Leslie AG, Tate CG, Schertler GF. Structure of a beta1-adrenergic G-protein-coupled receptor. Nature. 2008;454:486–491. doi: 10.1038/nature07101. [DOI] [PMC free article] [PubMed] [Google Scholar]
- 51.Wei H, Ahn S, Shenoy SK, Karnik SS, Hunyady L, Luttrell LM, Lefkowitz RJ. Independent beta-arrestin 2 and G protein-mediated pathways for angiotensin II activation of extracellular signal-regulated kinases 1 and 2. Proc Natl Acad Sci U S A. 2003;100:10782–10787. doi: 10.1073/pnas.1834556100. [DOI] [PMC free article] [PubMed] [Google Scholar]
- 52.Yao XJ, Parnot C, Deupi X, Ratnala VR, Swaminath G, Farrens DL, Kobilka BK. Coupling ligand structure to specific conformational switches in the beta2-adrenoceptor. Nat Chem Biol. 2006;2:417–422. doi: 10.1038/nchembio801. [DOI] [PubMed] [Google Scholar]
- 53.Ye S, Zaitseva E, Caltabiano G, Schertler GF, Sakmar TP, Deupi X, Vogel R. Tracking G-protein-coupled receptor activation using genetically encoded infrared probes. Nature. 2010;464:1386–1389. doi: 10.1038/nature08948. [DOI] [PubMed] [Google Scholar]