

Abstract
Heparanase is an endoglycosidase that specifically cleaves heparan sulphate side chains of heparan sulphate proteoglycans, activity that is strongly implicated in cell migration and invasion associated with tumour metastasis, angiogenesis and inflammation. Heparanase up-regulation was documented in an increasing number of human carcinomas, correlating with reduced post-operative survival rate and enhanced tumour angiogenesis. Expression and significance of heparanase in human sarcomas has not been so far reported. Here, we applied the Ewing’s sarcoma cell line TC71 and demonstrated a potent inhibition of cell invasion in vitro and tumour xenograft growth in vivo upon treatment with a specific inhibitor of heparanase enzymatic activity (compound SST0001, non-anticoagulant N-acetylated, glycol split heparin). Next, we examined heparanase expression and cellular localization by immunostaining of a cohort of 69 patients diagnosed with Ewing’s sarcoma. Heparanase staining was noted in all patients. Notably, heparanase staining intensity correlated with increased tumour size (P = 0.04) and with patients’ age (P = 0.03), two prognostic factors associated with a worse outcome. Our study indicates that heparanase expression is induced in Ewing’s sarcoma and associates with poor prognosis. Moreover, it encourages the inclusion of heparanase inhibitors (i.e. SST0001) in newly developed therapeutic modalities directed against Ewing’s sarcoma and likely other malignancies.
Keywords: heparanase, Ewing’s sarcoma, age, tumour size, SST0001
Introduction
Ewing’s sarcoma is the second most common malignant bone tumour of childhood and adolescence, accounting for about one-third of the primary bone tumours and 2% of all cancers in children and young adults. Most cases (∼80%) appear before the age of 18 years, and most of the remaining 20% occur before the age of 30 years, although the disease can emerge at any age [1–3]. Together with the malignant peripheral primitive neuroectodermal tumours (pPNET) it comprises the Ewing’s Sarcoma Family of Tumors (ESFT). Similar to several other sarcomas, ESFT display an aggressive behaviour with a tendency towards recurrence following resection and pronounced tendency towards early haematogenous metastasis. As a result, the prognosis of chemoresistant and disseminated sarcomas remains excessively poor despite multimodal therapeutic approaches: 50% survival at 5 years (25% if metastases are present at diagnosis) and less than 30% survival at 10 years [1–4]. Thus, better understanding of the disease is required for the development of novel therapeutic modalities [5].
Heparanase is an endoglycosidase which cleaves heparan sulphate (HS) side chains at a limited number of sites, activity that is strongly implicated in cell dissemination associated with tumour metastasis, inflammation and angiogenesis [6–9]. In recent years, heparanase up-regulation was documented in an increasing number of human carcinomas [7, 10]. In many cases, heparanase induction correlated with increased tumour metastasis, vascular density and shorter post-operative survival of cancer patients, thus providing a strong clinical support for the pro-metastatic and pro-angiogenic functions of the enzyme. These results led to the development of heparanase inhibitors as anti-cancer drugs [9, 11–13], including compound SST0001 (N-acetylated glycol-split heparin) a non-anticoagulant chemically modified heparin [14], shown to effectively inhibit B16 melanoma lung colonization [15] and myeloma tumour growth [16, 17], exerting no detectable side effects [16, 17]. The same inhibitor was applied in this study and found to efficiently suppress TC71 Ewing’s sarcoma tumour growth.
Utilizing an ELISA method capable of detection and quantification of heparanase in urine and plasma samples [18, 19], we have recently reported that heparanase levels are significantly elevated in the plasma of paediatric cancer patients [20]. Notably, heparanase levels in the plasma of sarcoma patients, including Ewing’s sarcoma, correlated with therapy effectiveness [20], implying that plasma heparanase originates primarily from the tumour mass. Immunohistochmical analysis of heparanase in a large cohort of sarcoma patients and its clinical significance has not been so far reported. Here, we examined heparanase expression in a cohort of 69 Ewing’s sarcoma patients and correlated clinical and pathological data with heparanase immunostaining and cellular localization. We provide evidence that heparanase expression is elevated in all cases. Heparanase staining correlated with increased tumour size (P = 0.04) and patient age (P = 0.03), prognostic factors associated with disease severity and a worse outcome. Altogether, our preclinical and clinical studies indicate that heparanase plays a significant role in the pathogenesis of Ewing’s sarcoma.
Materials and methods
Cell culture
The Ewing’s sarcoma cell line TC71 was maintained in Iscove’s modified Dulbecco’s Medium (Lonza, Verviers, Belgium) supplemented with 10% foetal bovine serum at 37°C in 5% CO2 atmosphere. Cells, maintained in complete medium, were processed for total protein extraction and immuno blot analysis, as previously described [21]. Anti-HPA1 polyclonal antibody was purchased from Santa Cruz Biotechnology (Santa Cruz, CA, USA). Immunoreactive bands were revealed by enhanced chemiluminescence detection system (ECL) (GE Healthcare, UK). The heparanase inhibitor SST0001 was kindly provided by Sigma-Tau Research Switzerland S.A. (Mendrisio, CH, USA). Preparation and characterization of compound SST0001 (100NA, RO-H) was previously described in detail [14].
Matrigel invasion assay
Cells were seeded in complete medium and pre-treated with the indicated concentration of compound SST0001 for 24 hrs. Then, cells were harvested and transferred (2.4 × 10⁵) to the upper chamber of 24-well Transwell plates (Costar, Corning Inc., Corning, NY, USA) coated with Matrigel (BD Biosciences, San Jose, CA, USA) (12.5 μg per well). Compound SST0001 was added to the upper and lower chambers at the same concentrations used for cell pre-treatment. Human recombinant VEGF (Sigma, St. Louis, MO, USA) or human recombinant bFGF (Calbiochem, La Jolla, CA, USA) was added to the lower chamber at 50 ng/ml. After 24 hrs of incubation at 37°C, cells that invaded the Matrigel and migrated to the lower chamber were fixed in 95% ethanol, stained with 2% crystal violet in 70% ethanol and counted under an inverted microscope. Statistical analysis was performed by the Student’s 2-tailed t-test.
In vivo model of Ewing’s sarcoma
The in vivo experiments were carried out on 10-week-old, female, athymic Swiss nude mice (Charles River, Calco, Italy). Mice were maintained in laminar flow rooms, at constant temperature and humidity, with free access to food and water. Experiments were approved by the Ethics Committee for Animal Experimentation of the Fondazione IRCCS Istituto Nazionale Tumori, Milan, according to institutional guidelines. Mice were subcutaneously injected with exponentially growing human Ewing’s sarcoma TC71 cells. The tumour line was maintained by s.c. passages of tumour fragments (about 3 × 3 × 3 mm) in healthy mice. Tumour growth was followed by biweekly measurements of tumour diameters with a Vernier calliper. Tumour volume (TV) was calculated according to the formula: TV (mm3) = d2× D/2 where d and D are the shortest and the longest diameter, respectively. Drug treatment started 1 day after tumour inoculation. SST0001 was administered by two daily s.c. injections of 60 mg/kg for 23 consecutive days. Drug efficacy was assessed as: tumour weight inhibition percentage (TWI%) in drug-treated versus control mice, expressed as: TWI%= 100 – (mean TW treated/mean TW control × 100). The Student’s t-test (two-sided) was used for statistical comparison of tumour weights in treated versus control mice.
Human biopsy specimens
The study included 69 patients with Ewing’s sarcoma diagnosed at the Orthopedic Oncology National Department at the Tel Aviv Sourasky Medical Center (Tel Aviv, Israel) whose paraffin embedded pathological specimens were available for immunostaining. The study was approved by the Institutional Review Board. Informal consent for the study was provided by all patients. Clinical records included demographic data, tumour size, tumour localization, treatment modalities and patients’ status at the end of the study. Response to treatment was assessed according to the clinical and radiological evaluations of the patients during the treatment and the follow up, and was categorized as complete remission, partial remission or tumour progression [20].
Heparanase immunostaining
Staining of formalin-fixed, paraffin-embedded, 5-μm sections for heparanase was performed essentially as described [20, 22, 23]. Briefly, slides were deparaffinized and rehydrated, and endogenous peroxidase activity was quenched (30 min.) by 3% hydrogen peroxide in methanol. Slides were then subjected to antigen retrieval by boiling (20 min.) in 10 mM citrate buffer, pH 6. Slides were incubated with 10% normal goat serum in phosphate-buffered saline (PBS) for 60 min. to block non-specific binding and were incubated (20 hrs, 4°C) with anti-heparanase 733 antibody diluted 1:100 in blocking solution. Antibody 733, raised in rabbits against a peptide (KKFKNSTYSRSSVDC; termed KKDC) that maps at the N-terminus of the 50-kD heparanase subunit, preferentially recognizes the active enzyme versus the 65-kD latent proenzyme [24]. Slides were extensively washed with PBS containing 0.01% Triton X-100 and incubated with a secondary reagent (Envision) according to the manufacturer’s (Dako, Glostrup, Denmark) instructions. Following additional washes, colour was developed with AEC reagent (Dako), and sections were counterstained with haematoxylin and mounted, as described [20]. Specimens were examined by a senior pathologist blinded to the clinical data of patients and were scored according to intensity (0 = none; 1 = weak–moderate; 2 = strong), extent (i.e. percent of tumour cells that were stained: 0, <10%; 1, 10–50%; 2, >50%) and localization (cytoplasmic versus nuclear) of staining. Specimens that were similarly incubated with pre-immune serum or subjected to the above procedure without the primary antibody yielded no detectable staining. For statistical analysis, we compared cases exhibiting low staining intensity/extent to cases exhibiting strong heparanase staining.
Statistical analysis
Univariate associations between heparanase parameters (intensity/extent of staining, cellular localization) and clinical and pathological findings, as well as patient outcome, were analysed using chi-square test (Pearson and Fisher’s exact test). P-value <0.05 was considered as statistically significant.
Results
Inhibition of Ewing’s sarcoma cell invasion and tumour growth by an inhibitor of heparanase
Based on the increasing awareness that heparanase expression is associated with cell invasion and tumour progression [7, 10] and that circulating levels of heparanase could reflect responsiveness of Ewing’s sarcoma to chemotherapy [20], we investigated the effect of a specific inhibitor of heparanase enzymatic activity (compound SST0001) on Ewing’s sarcoma cell invasion and xenograft tumour growth. For this purpose, we used the TC71 cell line, a well-characterized model of human Ewing’s sarcoma [25]. This cell line was found to exhibit substantial expression of heparanase, with prevalence of the active 50 kD subunit (Fig. 1A, inset), and appreciable levels of VEGF and bFGF (not shown), pro-angiogenic factors which are relevant in the malignant behaviour of Ewing’s sarcoma [25]. The effect of heparanase inhibition was first tested on TC71 cell invasion through Matrigel, a reconstituted basement membrane containing HS proteoglycans. As demonstrated in Fig. 1A, the heparanase inhibitor SST0001 counteracted cell invasion induced by exogenous stimulation with bFGF and VEGF, both HS-binding growth factors. In subsequent studies, athymic nude mice were subcutaneously injected with human Ewing’s sarcoma TC71 cells. Compound SST0001 was administered by two daily s.c. injections (60 mg/kg) for 23 consecutive days and tumour growth was evaluated by biweekly measurements of tumour size. As shown in Figure 1B, daily administration of the heparanase inhibitor SST0001 resulted in a marked inhibition of tumour growth. Notably, no evidence of disease was noted in 25% (average) of the mice and no tumour regrowth was observed in animals exhibiting complete response (Table 1). The prolonged treatment was well tolerated with no manifestations of side effects. These results indicate that heparanase is an exploitable target for therapeutic intervention in Ewing’s sarcoma.
Fig 1.
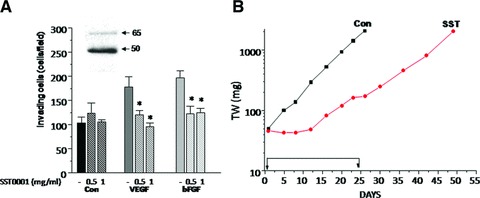
(A) Effect of SST0001 on the invasive ability of TC71 cells stimulated by exogenous VEGF or bFGF. Cells, pre-treated with the indicated concentration of SST0001 in complete medium for 24 hrs, were subjected to Matrigel invasion assay in serum-free medium with or without VEGF or bFGF (50 ng/ml). The number of invading cells per field is reported. Columns represent mean values ± S.D. of two replicates. One representative experiment is shown. *P < 0.0001. Inset: Expression of heparanase in TC71 cells. Whole cell lysate was subjected to immunoblotting with the anti-HPA1 antibody. Arrows indicate the latent (65 kD) and active (50 kD) heparanase forms. (B) Antitumor activity of SST0001 against TC71 tumour xenograft. SST0001 was dissolved in saline and administered by two daily s.c. injections of 60 mg/kg for 23 consecutive days. (▪), control; (•), SST0001.
Table 1.
Antitumor activity of SST0001 against TC71 Ewing’s sarcoma
Treatment: 60 mg/kg, s.c., twice daily for 23 consecutive days starting on day 1 after tumour inoculation.
TWI%= inhibition of tumour weight observed 4–8 days after the last treatment.
*NED = no evidence of disease at the end of the experiment.
#Toxic deaths.
Heparanase expression and cellular localization
To reveal the clinical significance of heparanase in Ewing’s sarcoma, we subjected tumour biopsies to immunohistochemical analysis. Sixty nine patients were included (30 females, 39 males); 39 (58%) were diagnosed before 18 years of age and the rest 42% at older ages (Table 3). All specimens stained positive for heparanase, and high staining extent (i.e. >50% of the cells stained positively; Table 2; Fig. 2A–D) was observed in 91% of the cases. Although this staining parameter appeared not to be significant clinically, likely due to the uniformity of staining among cases, it indicates that the majority of the tumour cells within the lesion overexpresses the enzyme. Adjacent, normal-looking tissue was largely devoid of staining (Fig. 2A–D). Strict differences were observed in the intensity of staining. Thus, 49% (34/69) of the cases were scored as low (+1) intensity (Fig. 2A, B; Table 2) whereas 51% (35/69) exhibited a strong (+2) staining intensity (Fig. 2C, D; Table 2). Closer examination revealed distinct cellular localization of heparanase. In addition to a diffused cytoplasmic staining (Fig. 2B, D), nuclear localization of heparanase was observed in 15% of the cases (10/68; Table 2; Fig. 2E).
Table 3.
Heparanase staining intensity is associated with patients’ age
| Parameter | Patients [n (%)] | Total | P-value | |
|---|---|---|---|---|
| Age | ||||
| Heparanase | <18 | ≥18 | ||
| 39 (58) | 29 (42) | 68* | ||
| Intensity | P = 0.03 | |||
| 1 | 24 (62) | 10 (35) | 34 | |
| 2 | 15 (38) | 19 (65) | 34 | |
| Extent | P = 0.7 | |||
| 1 | 3 (7.7) | 3 (10) | 6 | |
| 2 | 36 (92.3) | 26 (90) | 62 | |
| Localization | P = 0.8 | |||
| Nuclear | 6 (15) | 4 (14) | 10 | |
| Cytoplasmic | 33 (85) | 25 (86) | 58 | |
Data of one patient were missing.
Table 2.
Heparanase staining in Ewing’s sarcoma patients
| Heparanase | Total [n (%)] |
|---|---|
| Intensity | |
| 1 | 34 (49) |
| 2 | 35 (51) |
| Extent | |
| 1 | 6 (9) |
| 2 | 63 (91) |
| Localization* | |
| Nuclear | 10 (15) |
| Cytoplasmic | 56 (85) |
Data of three patients were missing.
Fig 2.
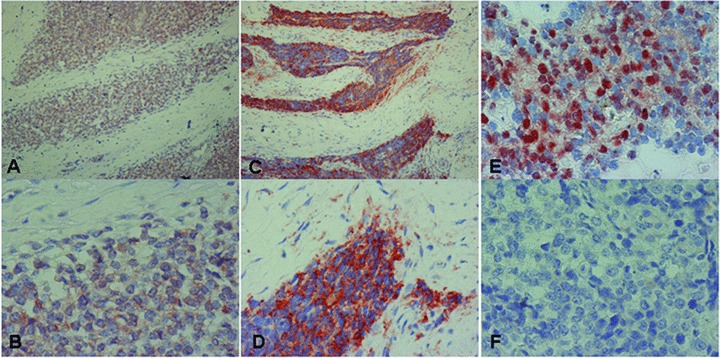
Immunohistochemical staining of heparanase in Ewing’s sarcoma specimens. Formalin-fixed, paraffin-embedded 5 μm sections were subjected to immunostaining, applying anti-heparanase polyclonal antibody (Ab 733), as described under ‘Materials and methods’. Shown are representative photomicrographs of heparanase-positive specimens categorized as weak (+1, A, B) or strong (+2, C, D) intensity. Nuclear localization of heparanase is shown in (E). Specimens that were similarly stained with pre-immune serum, or applying the above procedure but lacking the primary antibody, yielded no detectable staining (F). Original magnification: (A, C) 100×; (B, D–F) 400×.
Clinical data of the patients
Heparanase staining intensity correlated with patients’ age at diagnosis (Table 3). Thus, weak staining intensity (+1) was scored in the majority of patients (62%) diagnosed before the age of 18, whereas the remaining 38% exhibited strong (+2) heparanase staining (Table 3). Notably, the reverse ratio was found in patients diagnosed at later ages, where 65% of the patients exhibited strong (+2) staining intensity, differences that are statistically significant (P = 0.03) (Table 3). No correlation was found between the extent of staining or heparanase cellular localization and patients’ age. Furthermore, heparanase staining intensity correlated with the size of tumours (Table 4). Thus, weak staining intensity (+1) was scored in 62% of the specimens originating from small tumours (<5 cm) whereas the rest 38% were scored as strong intensity (+2; Table 4). In contrast, 75% of the cases originating from large tumours (>10 cm) were scored as strong intensity (+2; Table 4), differences that are statistically significant (P = 0.04). Even a higher significant relation (P = 0.01) was obtained when staining intensity was evaluated versus tumour size divided into two groups (<10 cm versus >10 cm; Table 4). No correlation was found between tumour size and heparanase cellular localization, whereas the extent of staining approached significance (P = 0.07; Table 4).
Table 4.
Heparanase staining intensity correlates with tumour size
| Parameter | Patients [n (%)] | Total | P-value | ||
|---|---|---|---|---|---|
| Tumour size | <5 cm | 5–10 cm | >10 cm | ||
| Heparanase | |||||
| 13 (19) | 35 (52) | 20 (29) | 68* | ||
| Intensity | P = 0.04 | ||||
| 1 | 8 (62) | 20 (57) | 5 (25) | 33 | **P = 0.01 |
| 2 | 5 (38) | 15 (43) | 15 (75) | 35 | |
| Extent | P = 0.07 | ||||
| 1 | 0 (0) | 5 (14) | 0 (0) | 5 | **P = 0.13 |
| 2 | 13 (100) | 30 (86) | 20 (100) | 63 | |
| Localization | P = 0.6 | ||||
| Nuclear | 3 (23) | 4 (11) | 3 (15) | 10 | **P = 0.34 |
| Cytoplasmic | 10 (77) | 31 (89) | 17 (85) | 58 | |
Data of one patient were missing.
*Tumour size ≤10 cm versus tumour size >10 cm.
Heparanase staining and cellular localization were further examined in relation to the response to treatment, categorized as complete remission (CR), partial remission (PR) or tumour progression (TP; Table 5). Notably, in all cases diagnosed as TP, heparanase staining appeared cytoplasmic. Similarly, cases exhibiting strong staining intensity appeared more prone to disease progression. Thus, 58% of the cases exhibiting complete remission were diagnosed as weak (+1) staining intensity (Table 5). In contrast, 63% (17/27) of the cases experiencing partial remission or tumour progression were stained strongly (+2) for heparanase. Although this trend only approached statistical significance (P = 0.09 for CR versus PR+TP; Table 5), it suggests that heparanase levels and cellular localization not only play a role in Ewing’s sarcoma progression but also, possibly, in patients’ response to treatment.
Table 5.
Heparanase staining in association with response to treatment
| Parameter | Patients [n (%)] | Total | P-value | ||
|---|---|---|---|---|---|
| Response to treatment | |||||
| Heparanase | CR | PR | TP | ||
| 38 (58) | 18 (28) | 9 (14) | 65* | ||
| Intensity | P = 0.14 | ||||
| 1 | 22 (58) | 8 (44) | 2 (22) | 32 | **P = 0.09 |
| 2 | 16 (42) | 10 (56) | 7 (78) | 33 | |
| Extent | P = 0.31 | ||||
| 1 | 4 (8) | 1 (6) | 0 (0) | 5 | |
| 2 | 34 (92) | 17 (94) | 9 (100) | 60 | |
| Localization | P = 0.24 | ||||
| Nuclear | 8 (21) | 2 (11) | 0 (0) | 10 | **P = 0.13 |
| Cytoplasmic | 30 (79) | 16 (89) | 9 (100) | 55 | |
Data of four patients were missing.
*CR versus PR+TP; CR = complete remission, PR = partial remission, TP = tumour progression.
Discussion
Compelling evidence indicate that heparanase expression is elevated in most, if not all human carcinomas, and is associated with poor prognosis, due to increased incidence of metastasis and bigger and more vascularized tumours [7, 10]. Only little attention was addressed to sarcomas, malignancy of mesenchymal origin. We have reported that heparanase levels are elevated in the plasma of sarcoma patients, among other types of paediatric cancers [20], demonstrating, for the first time, that heparanase levels are also elevated in malignancies of soft tissues and bones. This study encouraged the evaluation of heparanase expression levels and clinical significance in a large cohort of sarcoma patients. Heparanase staining was evident in essentially all Ewing’s sarcoma biopsies examined, exhibiting a high (+2) staining extent (i.e. >50% of the cells) in the majority (91%) of cases (Table 2). Although the extent parameter did not reach significance for patients’ age (Table 3) or response to treatment (Table 5), and only approached statistical significance in relation to tumour size (P = 0.07; Table 4), it indicates that heparanase expression is induced in the majority of the tumour cells. Ewing’s sarcoma is associated with unique chromosomal translocations that give rise to specific fusion genes comprising the EWS genes and members of the ETS transcription factors, primarily FLI (85%) [3, 26, 27]. In many cases, this t(11;22) chromosomal translocation is the only detected genetic event [3]. The high incidence of staining suggests that heparanase expression is regulated, directly or indirectly, by the EWS-FLI oncoprotein. This notion is supported by the identification of ETS binding sites in the heparanase promoter region, enhanced heparanase transcription following overexpression of ETS family members (i.e. ETS1, ETS2), and reduced heparanase transcription following transfection with a dominant-negative ETS gene construct [28].
In contrast with the relative uniformity of the extent criteria, staining intensity varied and was categorized as weak (+1; Fig. 2A, B) or strong (+2; Fig. 2C, D) intensity. The most important prognostic factor in ESFT is the presence of metastatic disease in presentation [29]. Only one patient in this study was diagnosed as such. Investigating the association of heparanase with tumour metastasis, the hallmark of heparanase function [8, 30], was therefore precluded. Notably, staining intensity correlated with other prognostic factors for Ewing’s sarcoma, namely tumour size and age of patients at diagnosis. Hence, strong staining intensity (+2) prevailed in patients diagnosed at older ages (i.e. >18; Table 3). This is significant because the disease tends to be more aggressive in older patients [2, 31]. Worse outcome is also observed in patients with larger tumours [2, 31]. Clearly, weak (+1) staining intensity was seen in 62% of the cases diagnosed with small tumours (<5 cm; Table 4) whereas strong heparanase staining intensity was scored in 75% of the cases harbouring large (>10 cm) tumours (Table 4), suggesting that heparanase levels are closely associated with Ewing’s sarcoma progression.
The staining intensity of heparanase appeared to be associated with response to treatment. This is because most instances (58%) experiencing complete remission following treatment were scored as low (+1) intensity, whereas 63% of the cases exhibiting only partial remission or tumour progression exhibited strong staining intensity of heparanase (Table 5). This is likely due to the release of HS-bound growth factors (i.e. PDGF and/or IGF, implicated in Ewing’s sarcoma cell proliferation) by the active enzyme, or to activation of signaling (i.e. Src, EGFR), survival (i.e. Akt) and angiogenic (i.e. VEGF) pathways by enzymatically active and inactive heparanase proteins [32–37]. Although the association between the response to treatment and heparanase staining intensity or cellular localization only approached statistical significance (Table 5), likely due to the low number of biopsies available for analysis, it highlights heparanase as a potential diagnostic marker in Ewing’s sarcoma. In this regards, nuclear localization of heparanase may simply sequester the protein from being secreted, or may be actively involved in gene regulation. Previous studies have shown that heparanase nuclear localization [38, 39] is associated with sustained cellular differentiation and favourable prognosis of head and neck, gastric and oesophageal cancer patients [39–42]. Ewing’s sarcoma, however, is typically poorly differentiated and thus less likely to undergo differentiation. The role of nuclear heparanase in Ewing’s sarcoma is yet to be elucidated.
Given the well-documented correlation between heparanase expression and the aggressive behaviour of tumours, it has been speculated that heparanase represents an important therapeutic target [11, 40–42]. Several compounds with anti-heparanase activity have been identified, and one, PI-88, is currently being evaluated in clinical trials [11, 12, 43, 44]. In this study, we applied a non-anticoagulant chemically modified heparin (N-acetylated and glycol-split heparin, termed SST0001), shown to specifically inhibit heparanase enzymatic activity [9, 14] and effectively suppress B16 melanoma lung colonization [15] and myeloma tumour growth, with no detectable side effects [17]. The inhibitory action of compound SST0001 is attributed to its tight binding to heparanase facilitated by the enhanced flexibility of heparin afforded by the glycol splitting, which opens the sugar ring [9, 16]. In addition, compound SST0001 is not cleaved by heparanase. SST0001 was applied to further substantiate the involvement of heparanase in Ewing’s sarcoma cell invasion and tumour progression and to elucidate its therapeutic potential. For this purpose, we applied the Ewing’s sarcoma TC71 cell line and demonstrated up to 50% inhibition of cell invasion through Matrigel (Fig. 1A). Moreover, tumour xenograft growth was markedly suppressed in mice treated with SST0001 relative to untreated animals (Fig. 1B). The dose and schedule of SST0001 treatment used in this study were chosen on the basis of previous preclinical studies, performed in murine tumour models and human myeloma xenografts [16, 17], indicating that the effect of compound SST0001 was dose-dependent. In spite of the high dose used in our experimental model, this dose level was well tolerated with the treatment schedule, using two daily s.c. injections. Lower doses or single daily injection were found less effective, presumably due to an estimated half-life time of SST0001 in plasma of about 1 hr (unpublished results). Notably, complete tumour response was observed in an appreciable percentage of the mice with no evidence of tumour regrowth at the end of experiment (around 3 months after the 24 days treatment period). The prolonged treatment was well tolerated with no manifestations of side effects.
These results indicate that heparanase is an exploitable target for therapeutic intervention in Ewing’s sarcoma and that flexible, chemically modified non-anticoagulant species of heparin constitute promising drug candidates, as also demonstrated for myeloma cells [16, 17]. The almost complete inhibition (∼90%) of tumour growth in mice treated with compound SST0001, directed against heparanase enzymatic activity, indicates that in the case of Ewing’s sarcoma, unlike, for example, U87 human glioma [33, 34], non-enzymatic activities of the heparanase protein [32–37] are playing a minor role in tumour progression.
Taken together, our results indicate that heparanase expression is markedly enhanced in Ewing’s sarcoma patients, associated with increased tumour size and patient age, two parameters that are closely associated with worse prognosis. Inhibition of heparanase enzymatic activity in Ewing’s sarcoma resulted in a profound inhibition of cell invasion and tumour growth, similar to a previous study with multiple myeloma [17]. Our study, combining a large cohort of human biopsy specimens, relevant clinical data and a xenograft model of Ewing’s sarcoma, contributes to our understanding of Ewing’s sarcoma tumour biology, suggesting that heparanase is a promising target for the development of anti-cancer therapeutics for sarcomas and, as previously demonstrated, carcinomas [43, 44] and haematological malignancies [17].
Acknowledgments
We are grateful to Sigma-Tau Research Switzerland S.A. (Mendrisio, CH, USA) for kindly providing compound SST0001 and to Dr. Sergio Penco for his continuous help and collaboration. This work was supported by grants from the Israel Science Foundation (grant 549/06); the National Cancer Institute, NIH (grant RO1-CA106456); the Ministry of Science and Technology of the State of Israel and the German Cancer Research Center (DKFZ) to I. Vlodavsky and the Associazione Italiana per la Ricerca sul Cancro (AIRC, Milan, Italy) to C. Lanzi. I. Vlodavsky is a Research Professor of the Israel Cancer Research Fund (ICRF).
Conflict of interest
IV and FZ received research funding from Sigma-Tau Research Switzerland. CP is employed by Sigma-Tau Industrie Farmaceutiche Riunite S.p.A. CP is listed as inventor on a patent for SST0001. IS, MWBA, JI, IM, IN, MT, GC, CL and NI declare no conflict of interest.
References
- 1.Esiashvili N, Goodman M, Marcus RB., Jr Changes in incidence and survival of Ewing sarcoma patients over the past 3 decades: surveillance epidemiology and end results data. J Pediatr Hematol Oncol. 2008;30:425–30. doi: 10.1097/MPH.0b013e31816e22f3. [DOI] [PubMed] [Google Scholar]
- 2.Leavey PJ, Collier AB. Ewing sarcoma: prognostic criteria, outcomes and future treatment. Expert Rev Anticancer Ther. 2008;8:617–24. doi: 10.1586/14737140.8.4.617. [DOI] [PubMed] [Google Scholar]
- 3.Riggi N, Stamenkovic I. The biology of Ewing sarcoma. Cancer Lett. 2007;254:1–10. doi: 10.1016/j.canlet.2006.12.009. [DOI] [PubMed] [Google Scholar]
- 4.Paulussen M, Bielack S, Jurgens H, et al. Ewing’s sarcoma of the bone: ESMO clinical recommendations for diagnosis, treatment and follow-up. Ann Oncol. 2009;20:140–2. doi: 10.1093/annonc/mdp155. [DOI] [PubMed] [Google Scholar]
- 5.Bernstein M, Kovar H, Paulussen M, et al. Ewing’s sarcoma family of tumors: current management. Oncologist. 2006;11:503–19. doi: 10.1634/theoncologist.11-5-503. [DOI] [PubMed] [Google Scholar]
- 6.Dempsey LA, Brunn GJ, Platt JL. Heparanase, a potential regulator of cell-matrix interactions. Trends Biochem Sci. 2000;25:349–51. doi: 10.1016/s0968-0004(00)01619-4. [DOI] [PubMed] [Google Scholar]
- 7.Ilan N, Elkin M, Vlodavsky I. Regulation, function and clinical significance of heparanase in cancer metastasis and angiogenesis. Int J Biochem Cell Biol. 2006;38:2018–39. doi: 10.1016/j.biocel.2006.06.004. [DOI] [PubMed] [Google Scholar]
- 8.Parish CR, Freeman C, Hulett MD. Heparanase: a key enzyme involved in cell invasion. Biochim Biophys Acta. 2001;1471:M99–108. doi: 10.1016/s0304-419x(01)00017-8. [DOI] [PubMed] [Google Scholar]
- 9.Vlodavsky I, Ilan N, Naggi A, et al. Heparanase: structure, biological functions, and inhibition by heparin-derived mimetics of heparan sulfate. Curr Pharm Des. 2007;13:2057–73. doi: 10.2174/138161207781039742. [DOI] [PubMed] [Google Scholar]
- 10.Vreys V, David G. Mammalian heparanase: what is the message. J Cell Mol Med. 2007;11:427–52. doi: 10.1111/j.1582-4934.2007.00039.x. [DOI] [PMC free article] [PubMed] [Google Scholar]
- 11.Ferro V, Hammond E, Fairweather JK. The development of inhibitors of heparanase, a key enzyme involved in tumour metastasis, angiogenesis and inflammation. Mini Rev Med Chem. 2004;4:693–702. doi: 10.2174/1389557043403729. [DOI] [PubMed] [Google Scholar]
- 12.McKenzie EA. Heparanase: a target for drug discovery in cancer and inflammation. Br J Pharmacol. 2007;151:1–14. doi: 10.1038/sj.bjp.0707182. [DOI] [PMC free article] [PubMed] [Google Scholar]
- 13.Miao HQ, Liu H, Navarro E, et al. Development of heparanase inhibitors for anti-cancer therapy. Curr Med Chem. 2006;13:2101–11. doi: 10.2174/092986706777935230. [DOI] [PubMed] [Google Scholar]
- 14.Naggi A, Casu B, Perez M, et al. Modulation of the heparanase-inhibiting activity of heparin through selective desulfation, graded N-acetylation, and glycol splitting. J Biol Chem. 2005;280:12103–13. doi: 10.1074/jbc.M414217200. [DOI] [PubMed] [Google Scholar]
- 15.Hostettler N, Naggi A, Torri G, et al. P-selectin- and heparanase-dependent antimetastatic activity of non-anticoagulant heparins. FASEB J. 2007;21:3562–72. doi: 10.1096/fj.07-8450com. [DOI] [PubMed] [Google Scholar]
- 16.Casu B, Vlodavsky I, Sanderson RD. Non-anticoagulant heparins and inhibition of cancer. Pathophysiol Haemost Thromb. 2008;36:195–203. doi: 10.1159/000175157. [DOI] [PMC free article] [PubMed] [Google Scholar]
- 17.Yang Y, MacLeod V, Dai Y, et al. The syndecan-1 heparan sulfate proteoglycan is a viable target for myeloma therapy. Blood. 2007;110:2041–8. doi: 10.1182/blood-2007-04-082495. [DOI] [PMC free article] [PubMed] [Google Scholar]
- 18.Shafat I, Pode D, Peretz T, et al. Clinical significance of urine heparanase in bladder cancer progression. Neoplasia. 2008;10:125–30. doi: 10.1593/neo.07875. [DOI] [PMC free article] [PubMed] [Google Scholar]
- 19.Shafat I, Zcharia E, Nisman B, et al. An ELISA method for the detection and quantification of human heparanase. Biochem Biophys Res Commun. 2006;341:958–63. doi: 10.1016/j.bbrc.2006.01.048. [DOI] [PMC free article] [PubMed] [Google Scholar]
- 20.Shafat I, Ben-Barak A, Postovsky S, et al. Heparanase levels are elevated in the plasma of pediatric cancer patients and correlate with response to anticancer treatment. Neoplasia. 2007;9:909–16. doi: 10.1593/neo.07673. [DOI] [PMC free article] [PubMed] [Google Scholar]
- 21.Cuccuru G, Lanzi C, Cassinelli G, et al. Cellular effects and antitumor activity of RET inhibitor RPI-1 on MEN2A-associated medullary thyroid carcinoma. J Natl Cancer Inst. 2004;96:1006–14. doi: 10.1093/jnci/djh184. [DOI] [PubMed] [Google Scholar]
- 22.Cohen E, Doweck I, Naroditsky I, et al. Heparanase is overexpressed in lung cancer and correlates inversely with patient survival. Cancer. 2008;113:1004–11. doi: 10.1002/cncr.23680. [DOI] [PMC free article] [PubMed] [Google Scholar]
- 23.Cohen-Kaplan V, Naroditsky I, Zetser A, et al. Heparanase induces VEGF C and facilitates tumor lymphangiogenesis. Int J Cancer. 2008;123:2566–73. doi: 10.1002/ijc.23898. [DOI] [PMC free article] [PubMed] [Google Scholar]
- 24.Zetser A, Levy-Adam F, Kaplan V, et al. Processing and activation of latent heparanase occurs in lysosomes. J Cell Sci. 2004;117:2249–58. doi: 10.1242/jcs.01068. [DOI] [PubMed] [Google Scholar]
- 25.Zhou Z, Reddy K, Guan H, et al. VEGF(165), but not VEGF(189), stimulates vasculogenesis and bone marrow cell migration into Ewing’s sarcoma tumors in vivo. Mol Cancer Res. 2007;5:1125–32. doi: 10.1158/1541-7786.MCR-07-0174. [DOI] [PubMed] [Google Scholar]
- 26.Janknecht R. EWS-ETS oncoproteins: the linchpins of Ewing tumors. Gene. 2005;363:1–14. doi: 10.1016/j.gene.2005.08.007. [DOI] [PubMed] [Google Scholar]
- 27.Ordonez JL, Osuna D, Herrero D, et al. Advances in Ewing’s sarcoma research: where are we now and what lies ahead. Cancer Res. 2009;69:7140–50. doi: 10.1158/0008-5472.CAN-08-4041. [DOI] [PubMed] [Google Scholar]
- 28.Lu WC, Liu YN, Kang BB, et al. Trans-activation of heparanase promoter by ETS transcription factors. Oncogene. 2003;22:919–23. doi: 10.1038/sj.onc.1206201. [DOI] [PubMed] [Google Scholar]
- 29.Heare T, Hensley MA, Dell’Orfano S. Bone tumors: osteosarcoma and Ewing’s sarcoma. Curr Opin Pediatr. 2009;21:365–72. doi: 10.1097/MOP.0b013e32832b1111. [DOI] [PubMed] [Google Scholar]
- 30.Vlodavsky I, Friedmann Y. Molecular properties and involvement of heparanase in cancer metastasis and angiogenesis. J Clin Invest. 2001;108:341–7. doi: 10.1172/JCI13662. [DOI] [PMC free article] [PubMed] [Google Scholar]
- 31.Cotterill SJ, Ahrens S, Paulussen M, et al. Prognostic factors in Ewing’s tumor of bone: analysis of 975 patients from the European Intergroup Cooperative Ewing’s Sarcoma Study Group. J Clin Oncol. 2000;18:3108–14. doi: 10.1200/JCO.2000.18.17.3108. [DOI] [PubMed] [Google Scholar]
- 32.Ben-Zaken O, Gingis-Velitski S, Vlodavsky I, et al. Heparanase induces Akt phosphorylation via a lipid raft receptor. Biochem Biophys Res Commun. 2007;361:829–34. doi: 10.1016/j.bbrc.2007.06.188. [DOI] [PMC free article] [PubMed] [Google Scholar]
- 33.Cohen-Kaplan V, Doweck I, Naroditsky I, et al. Heparanase augments epidermal growth factor receptor phosphorylation: correlation with head and neck tumor progression. Cancer Res. 2008;68:10077–85. doi: 10.1158/0008-5472.CAN-08-2910. [DOI] [PMC free article] [PubMed] [Google Scholar]
- 34.Fux L, Feibish N, Cohen-Kaplan V, et al. Structure-function approach identifies a COOH-terminal domain that mediates heparanase signaling. Cancer Res. 2009;69:1758–67. doi: 10.1158/0008-5472.CAN-08-1837. [DOI] [PMC free article] [PubMed] [Google Scholar]
- 35.Fux L, Ilan N, Sanderson RD, et al. Heparanase: busy at the cell surface. Trends Biochem Sci. 2009;34:511–9. doi: 10.1016/j.tibs.2009.06.005. [DOI] [PMC free article] [PubMed] [Google Scholar]
- 36.Gingis-Velitski S, Zetser A, Flugelman MY, et al. Heparanase induces endothelial cell migration via protein kinase B/Akt activation. J Biol Chem. 2004;279:23536–41. doi: 10.1074/jbc.M400554200. [DOI] [PubMed] [Google Scholar]
- 37.Zetser A, Bashenko Y, Edovitsky E, et al. Heparanase induces vascular endothelial growth factor expression: correlation with p38 phosphorylation levels and Src activation. Cancer Res. 2006;66:1455–63. doi: 10.1158/0008-5472.CAN-05-1811. [DOI] [PubMed] [Google Scholar]
- 38.Schubert SY, Ilan N, Shushy M, et al. Human heparanase nuclear localization and enzymatic activity. Lab Invest. 2004;84:535–44. doi: 10.1038/labinvest.3700084. [DOI] [PubMed] [Google Scholar]
- 39.Takaoka M, Naomoto Y, Ohkawa T, et al. Heparanase expression correlates with invasion and poor prognosis in gastric cancers. Lab Invest. 2003;83:613–22. doi: 10.1097/01.lab.0000067482.84946.bd. [DOI] [PubMed] [Google Scholar]
- 40.Doweck I, Kaplan-Cohen V, Naroditsky I, et al. Heparanase localization and expression by head and neck cancer: correlation with tumor progression and patient survival. Neoplasia. 2006;8:1055–61. doi: 10.1593/neo.06577. [DOI] [PMC free article] [PubMed] [Google Scholar]
- 41.Kobayashi M, Naomoto Y, Nobuhisa T, et al. Heparanase regulates esophageal keratinocyte differentiation through nuclear translocation and heparan sulfate cleavage. Differentiation. 2006;74:235–43. doi: 10.1111/j.1432-0436.2006.00072.x. [DOI] [PubMed] [Google Scholar]
- 42.Ohkawa T, Naomoto Y, Takaoka M, et al. Localization of heparanase in esophageal cancer cells: respective roles in prognosis and differentiation. Lab Invest. 2004;84:1289–304. doi: 10.1038/labinvest.3700159. [DOI] [PubMed] [Google Scholar]
- 43.Liu CJ, Lee PH, Lin DY, et al. Heparanase inhibitor PI-88 as adjuvant therapy for hepatocellular carcinoma after curative resection: a randomized phase II trial for safety and optimal dosage. J Hepatol. 2009;50:958–68. doi: 10.1016/j.jhep.2008.12.023. [DOI] [PubMed] [Google Scholar]
- 44.Ferro V, Dredge K, Liu L, et al. PI-88 and novel heparan sulfate mimetics inhibit angiogenesis. Semin Thromb Hemost. 2007;33:557–68. doi: 10.1055/s-2007-982088. [DOI] [PubMed] [Google Scholar]