Abstract
MalY represents a bifunctional pyridoxal 5′-phosphate-dependent enzyme acting as a β–cystathionase and as a repressor of the maltose regulon. Here we present the crystal structures of wild-type and A221V mutant protein. Each subunit of the MalY dimer is composed of a large pyridoxal 5′-phosphate-binding domain and a small domain similar to aminotransferases. The structural alignment with related enzymes identifies residues that are generally responsible for β–lyase activity and depicts a unique binding mode of the pyridoxal 5′–phosphate correlated with a larger, more flexible substrate-binding pocket. In a screen for MalY mutants with reduced mal repressor properties, mutations occurred in three clusters: I, 83–84; II, 181–189 and III, 215–221, which constitute a clearly distinguished region in the MalY crystal structure far away from the cofactor. The tertiary structure of one of these mutants (A221V) demonstrates that positional rearrangements are indeed restricted to regions I, II and III. Therefore, we propose that a direct protein–protein interaction with MalT, the central transcriptional activator of the maltose system, underlies MalY-dependent repression of the maltose system.
Keywords: crystal structure/gene regulation/MalT/maltose regulon/protein–protein interaction
Introduction
The Escherichia coli maltose regulon consists of 10 genes encoding proteins responsible for the uptake and metabolism of maltose and maltodextrins (Boos and Shuman, 1998). In E.coli, the mal genes are controlled by the positive activator MalT, which, together with the cyclic AMP–catabolite gene activator protein (cAMP–CAP) complex, the inducer maltotriose and ATP, is required for mal gene transcription (Raibaud et al., 1989). Several regulatory circuits modulate MalT function. In addition to the dependence on cAMP–CAP (Chapon, 1982), malT expression is itself regulated by Mlc acting as a glucose-inducible repressor (Decker et al., 1998). Moreover, MalT is negatively affected in its activity by the interaction with at least three proteins, namely MalK, the ATP-hydrolysing subunit of the high-affinity maltose transport system (Kühnau et al., 1989), Aes, an acetyl esterase with homology to lipases (Peist et al., 1997), and MalY (Zdych et al., 1995).
malY is part of the malI malX malY gene cluster located at 36 minutes on the E.coli chromosome. malX and malY form an operon that is not dependent on MalT (i.e. malX malY is not part of the maltose regulon) and that is controlled by the adjacent gene product of malI, which acts as a LacI-type repressor (Reidl et al., 1989). The malI gene (I for induction) was found in a genetic screen for mutations that reduce the high expression of a malK–lacZ fusion (Ehrmann and Boos, 1987). The observed mutation in malI led to the constitutive expression of the malX malY operon, which in turn represses the mal system. It is the de-repressed synthesis of MalY that causes the reduction in mal gene expression (Reidl and Boos, 1991). malX, the first gene in the operon, encodes an IIBC-type subunit of the phosphotransferase system (PTS) that shows homology to the corresponding transport systems for glucose and N–acetylglucosamine. While glucose transport via MalX can be demonstrated, it is clear that glucose cannot be the natural substrate of MalX. The substrate of the MalX–MalY system awaits identification. However, the malI malX malY gene cluster is conserved in some other bacteria such as Corynebacterium glutamicum (Rossol and Puhler, 1992) and Vibrio furnissii (Bouma and Roseman, 1996). In the latter organism, MalX functions as the major glucose transport system. MalY from V.furnissii exhibits the same enzymatic activity as the E.coli protein (see below) but does not function as a repressor of the E.coli maltose system despite high sequence homology (Zdych et al., 1995).
MalY is a pyridoxal 5′–phosphate (PLP)-dependent enzyme showing weak similarity to aminotransferases [ATs, α–family as defined by Christen and co-workers (Alexander et al., 1994)] including seven of 12 invariant characteristic residues (Reidl and Boos, 1991; Mehta and Christen, 1993). In a sequence alignment based on the X-ray structure of cystathionine β–lyase (CBL; Clausen et al., 1996), MalY also shows homology to trans-sulfuration enzymes that are involved in sulfur transfer from cysteine to methionine and constitute the γ–family of PLP enzymes. Thus, MalY represents an evolutionary link between these two families of PLP-containing enzymes. In MalY, the cofactor is covalently attached by an aldimine linkage to Lys233, which is part of the conserved PLP-binding site. MalY exhibits the same catalytic activity as CBL, including the same pH optimum, substrate preference and kinetic constants. malI mutants that constitutively express MalY suppress the auxotrophic phenotype of metC mutants, demonstrating the in vivo β–cystathionase activity of MalY. This allowed the selection of mutations in MalY that still exhibit Cβ–Sγ lyase activity but are no longer able to inhibit mal gene expression (Zdych et al., 1995). Furthermore, the mutation of the active site lysine to isoleucine (K233I) revealed that the CBL activity of MalY is not necessary for mal repression.
The way in which MalY interferes with mal gene expression in E.coli is still poorly understood. Here we report the X–ray structure of MalY, which allows the interpretation of repressor mutations in terms of protein–protein interactions of MalY with MalT.
Results and discussion
Quality of the MalY wild-type and A221V mutant crystal structures
The tertiary structure of wild-type MalY from E.coli was solved by the multiple anomalous dispersion (MAD) method and refined to an R–factor of 20.1% (Rfree =26.2%) at 2.5 Å resolution (Table I). The final model of MalY consists of an α2 dimer with 361 and 366 residues per monomer, respectively, and 167 water molecules. Parts of the N–terminal segment of the wild-type structure (monomer A: 1–29; monomer B: 1–5, 11–29) are not properly defined by electron density and were omitted from the refinement.
Table I. Refinement statistics.
| Wild type | A221V | |
|---|---|---|
| Resolution range (Å) | 15–2.5 | 15.0–2.04 |
| No. of reflections in refinement | 24 213 | 96 150 |
| Rfactor (%)a | 20.1 | 22.7 |
| Rfree (%)b | 26.2 | 28.6 |
| No. of active atoms in refinement | 5914 | 13 320 |
| protein atoms | 5717 | 12 296 |
| PLP atoms | 30 | 60 |
| sulfate atoms | 30 | |
| solvent molecules | 167 | 934 |
| R.m.s.d. from ideal stereochemistry | ||
| bond lengths (Å) | 0.008 | 0.010 |
| bond angles (°) | 1.42 | 1.43 |
| dihedrals (°) | 23.1 | 23.2 |
| improper (°) | 1.2 | 1.2 |
| R.m.s.d. for bonded Bs | 2.7 | 2.5 |
| R.m.s. values on NCS restraints | ||
| distance | 0.114 | 0.375 |
| ΔB-factors | 35.7 | 29.9 |
| Average B-factors (Å2) | 47.2 | 40.2 |
| main chain | 46.4 | 39.2 |
| side chain | 48.4 | 41.2 |
| PLP | 39.2 | 32.4 |
| sulfate | 50.7 | |
| solvent | 42.5 | 41.2 |
aRfactor is the conventional R-factor with Rfactor = Σ ∣∣Fobs∣–∣Fcalc∣∣/Σ∣Fobs∣
bRfree is the R-value calculated with 5% of the data that were not used for the refinement.
The structure of the A221V mutant enzyme, which crystallized in a different space group, was solved by Patterson search techniques using the wild-type model. The final crystallographic R–factor for data from 8.0 to 2.05 Å was 22.7% (Rfree = 28.6%). In contrast to the wild-type structure, the N–terminal loop was clearly visible in the 2Fo – Fc electron density map. Thereafter, the model of the A221V mutant consists of two α2 dimers (constructed by monomers A/B and C/D) with 391 residues per monomer (Table I). The defined Cα atoms of both structures fit well to their counterparts (r.m.s. deviation =0.33 Å), with the exception of the loop harbouring the mutation at position 221. Due to this overall similarity, the description of the MalY structure is based on the high-resolution data obtained with the A221V mutant crystal form.
As estimated from a Luzatti plot, the mean positional error of the atoms of the wild-type and A221V mutant proteins are 0.32 and 0.30 Å, respectively. In the Ramachandran plot, 89.5% of the residues were found to be in the most favourable, 9.4% in the favourable, 0.8% in the generously allowed and only Thr321 in the disallowed region. Thr321 is an active site residue and has well defined electron density. A sulfate ion could be identified in the active site of MalY. Its B–factors are of the same order of magnitude as the average B–factor of neighbouring residues, indicating a high occupancy. The MalY atomic coordinates have been deposited in the Protein Data Bank with PDB code 1D2F.
Overall structure of MalY
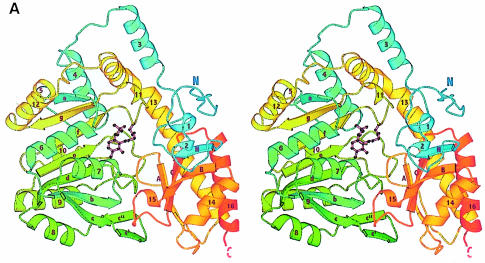
Secondary structure elements were assigned with the program DSSP (Kabsch and Sander, 1983) on the basis of characteristic hydrogen-bonding patterns and φ/ψ backbone torsion angles, and are illustrated in Figure 1A. Like most other PLP enzymes, each MalY subunit consists of two domains, a large PLP-binding domain and a small domain comprising the C- and N–terminal portions of the polypeptide chain. Both domains are constructed as open α/β structures and are connected by helix 3 (residues 44–56) and the long α–helix 13 (residues 271–310), which has a kink near Pro286. The complete monomer has an approximate size of 45 Å×55 Å×60 Å.
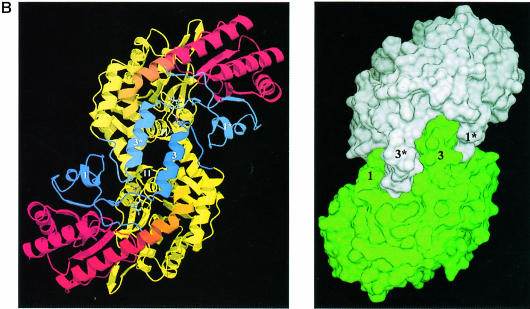
Fig. 1. Overall fold of MalY. (A) Stereo ribbon presentation of the MalY monomer, emphasizing the course of the polypeptide chain and the domain organization. The colour ramp starts at the N–terminus with blue and ends at the C–terminus with red. Both protein termini are labelled, as well as the nomenclature of the secondary structure elements. PLP and the PLP-binding lysine are shown in a ball-and-stick representation. Helices 2, 5, 10, 11 and 15 exhibit characteristics typical for 310 helices. (B) Active dimer of MalY viewed along the non-crystallographic 2–fold axis. In the ribbon presentation on the left, portions of the three segments are in blue (N–terminal), yellow (PLP-binding domain) and red (C–terminal). Helices that are central to dimer formation are marked. On the right, the dimer surface is illustrated in order to emphasize the zipper-like interaction interface between helices 1, 3*, 3, 1* and their associated loops. The colouring is based on the two monomers in the active dimer. The drawings were produced with MOLSCRIPT (Kraulis, 1991), RASTER3D (Merritt and Murphy, 1994) and DINO (Philippsen, 1999), respectively.
The N–terminal segment, comprising residues 1–56, contributes to the small domain and consists of an extended arm (residues 1–15), three helices and one β–strand. Helix 3 of this segment plays a pivotal role in dimer stabilization. The large domain is constituted by residues 57–286 and has as its central part a seven-stranded β–sheet with strand order a, g, f, e, d, b and c, which is observed in all known structures of the AT family of PLP enzymes (Jansonius, 1998). The β–strands are wound to the left around helices 6 and 7 and have directions +, –, +, +, +, +, +, with all crossovers being right-handed. At the interdomain interface, a two-stranded antiparallel β–sheet (c′ and c′′) after strand c interacts with the C–terminal loop of the long connector helix 13. The β–sheet is sandwiched between nine helices, with helices 4, 5, 8, 9 and 10 situated at the solvent-accessible side and helices 6, 7, 11 and 12 on the opposite side forming part of the interdomain (helices 7 and 11) and intersubunit interfaces (helices 6, 7 and 12), respectively. PLP is bound covalently to Lys233 in a cleft between the PLP-binding site and the small domain. The latter domain is constructed as a hybrid of C–terminal (287–391) and N–terminal residues (1–56). In the centre of the small domain an extended five-stranded β–sheet is observed in which a parallel two-stranded (N and B) and an antiparallel three-stranded β–sheet (B, C and A) are combined. Strand B participates in both sheets, and strand N originates from the N–terminal segment of MalY. The five-stranded β–sheet is flanked on the solvent-exposed side by the C–terminal part of the kinked helix 13, by helices 14, 15 and 16 and by the N–terminal helices 1 and 2.
Although it was suggested that the monomer is the native oligomeric state of MalY (Reidl and Boos, 1991), both the wild-type and A221V crystal forms reveal the presence of an α2 dimer (Figure 1B) and demonstrate that the dimer is the physiologically active state of MalY. The two monomers are in close contact around a non-crystallographic 2–fold axis. The interaction surface between the two monomers is large. Approximately 14.8% (2540 Å2) of the solvent-accessible surface area of each subunit is buried upon dimerization. Intimate contacts between the subunits are manifested by a total of 30 hydrogen bonds, four salt bridges and extensive hydrophobic interactions. Central in dimerization is the zipper-like organization of helices 1, 3*, 3 and 1* (where the asterisk indicates elements from the neighbouring subunit in the active dimer) and their associated loops (Figure 1B). Between these segments, 22 hydrogen bonds are observed, including residues 9/13/14/16/20/23/37/42 and 53/56/57/61/63/65/68. Furthermore, a large hydrophobic patch is formed between helices 3, 3* and helices 11, 11* comprising residues 8/42/47/50/54/57/58/59/240/272. This interplay enables helix 3 to guide Tyr61 to the active site of the neighbouring subunit where it binds strongly to the PLP phosphate group. Further intersubunit hydrogen bonds are found between helix 6, helix 12 and their associated loops, of which some involve main chain atoms, confirming the close contact of the two monomers. Additional clamping is achieved by Trp14, which protrudes into a hydrophobic pocket of the partner monomer lined with residues Val271, Leu274, Thr275 and Ile278.
Comparison with related structures
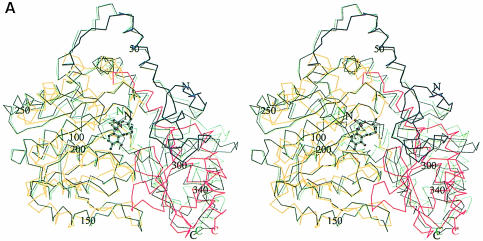
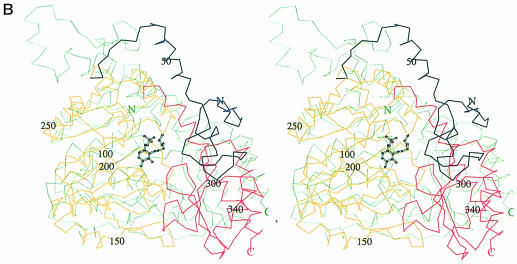
The overall fold of the MalY monomer from E.coli is similar to that of other PLP-dependent enzymes of the AT family. In the search for structural homologues, the DALI algorithm (Holm and Sander, 1993) was employed. A multiple structural alignment indicates six structural subclasses (data not shown) and is consistent with the classification of Käck et al. (1999). An overlay of the Cα traces of MalY and aspartate aminotransferase (AAT; PDB code 1AJS, z–score 29.5), which exhibits the highest structural similarity to MalY, is shown in Figure 2A, and an overlay with CBL (PDB code 1CL1, z–score 18.6), which catalyses a similar reaction, is shown in Figure 2B.
Fig. 2. Stereo plot of the DALI superpositions of the MalY monomer with (A) the open (black) and closed (green) form of AAT and (B) CBL. The different segments of MalY are coloured as in Figure 1B. The numbering of MalY, its cofactor and the individual polypeptide termini is indicated. The figures were generated with MOLSCRIPT.
Interestingly, MalY aligns better to the closed than to the open conformation of AAT, both of which are present in the deposited 1AJS dimer structure. The DALI superpositions have 343 (r.m.s. deviation 3.0 Å) and 280 (r.m.s. deviation 2.9 Å) aligned Cα atoms, respectively. Unlike the closed conformation, the open form fits only partially to the small domain of MalY. Only strands A and C of the five-stranded β–sheet align with MalY. The largest differences are found in the parallel portion of the mixed β–sheet (strands N and B) and the neighbouring α–helices 1, 2, 14 and 16. The components that were proposed to be mainly responsible for the AAT active site closure (Rhee et al., 1997) are absent in MalY. Neither the solvent-exposed hydrophobic residues Pro14–Val15–Leu16–Val17–Phe18 nor the substrate-binding Arg292 have counterparts in the MalY crystal structure, indicating that the open–closed formalism of AAT is not relevant to MalY. Further evidence for an alternative enzymatic mechanism stems from the observation that, although strikingly similar to the closed AAT form, the active site of MalY is highly accessible. In addition, two enlarged loops of the MalY small domain, following strand A (residues 327–335) and strand B (residues 352–365), are absent in AAT and are strongly involved in the interdomain interface. The hydrophobic patch including Phe363, Trp325 and Trp147 and the hydrogen bonds between Asp327/Tyr356/Asp359 and Thr118/Tyr125/Lys142/Asn173 appear to stabilize the orientation of the PLP binding relative to the small domain, thereby hindering domain movement.
Two regions of the MalY PLP domain deviate significantly from AAT: residues 78–89 and 207–224. Unclassified coil structure and two short 310 helices (5 and 10) are observed in the MalY structure, while in AAT regular helices are formed that are also located differently. Remarkably, none of the PLP enzyme structures deposited in the PDB showed homology to these two regions, which seem to be unique for MalY and are of major importance for its repressor function (see below).
Although both CBL and MalY catalyse Cβ–Sγ lysis with similar substrate preference, CBL is not the closest structural homologue to MalY. In the DALI superposition, only 279 Cα atoms of one CBL monomer could be aligned to MalY (r.m.s. deviation 3.4 Å). Structural homology between CBL and MalY starts with residue 60, which is located in the loop preceding α–helix 4. This residue is the first that is common to all aligned PLP enzymes and should, therefore, be regarded as the starting point of the characteristic PLP-binding domain. CBL is even missing helix 3, which is central in dimer formation and is found in all enzyme structures of the α–family of PLP-dependent enzymes. The area of greatest similarity between MalY and CBL is the core of the PLP-binding domain, whereas significant differences are found in the small domain. Only the antiparallel part of the β–sheet (strands A, C and B) and helices 13 (C–terminal part), 14 and 16 align.
MalY as a βC–S lyase
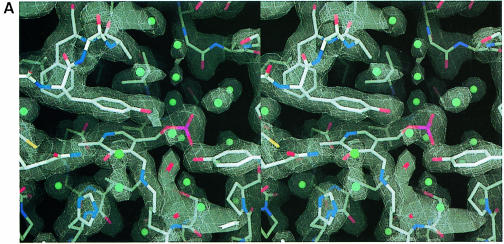
The PLP cofactor of MalY is located at the bottom of a wide catalytic cleft that is assembled by residues from both subunits. Similarly to other PLP enzymes of the AT family, the scaffold of the large domain is well configured for binding PLP at the C–terminal end of its seven-stranded β–sheet. The opposite wall of the active site adjacent to the bound sulfate ion is made up of segments of the small domain (residues 33–38 and 353–368), while the active site entrance near the phosphate group of the cofactor is formed by the interdomain hinge of the second subunit (loops between helices 3/4 and 12/13 with residues Tyr61 and Ser267/Ser268, respectively). The cofactor is covalently bound to the enzyme by condensation of its 4′–aldehyde group, with the ɛ–amino group of Lys233 forming a Schiff base linkage (Figure 3A). The characteristic electron-sink character of the PLP is ensured by ring stacking interactions of the pyridine ring with Tyr121 and the electrostatic stabilization of the positively charged pyridine N1, which forms a strong salt bridge/hydrogen bond (2.6 Å) with the carboxylate Oδ of Asp201. The active site structure of MalY was superimposed with corresponding residues of AAT (Figure 3B) and with CBL (Figure 3C) using the program O (Jones et al., 1991).
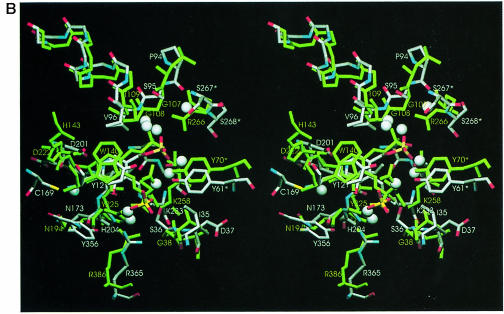
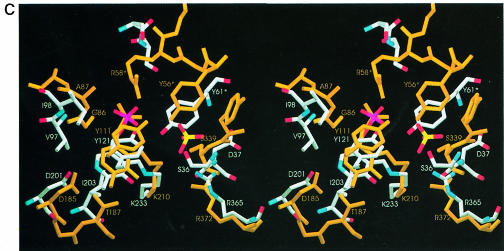
Fig. 3. Active site of MalY. (A) Stereo plot of the final electron density of the PLP cofactor and the immediate protein vicinity (colour coded by atom type). The 2Fo – Fc map is contoured at 1.1σ and calculated at 2.05 Å with the A221V reflection data. Water molecules are indicated by cyan balls. (B) Detailed comparison of the active site of MalY (colour coded by atom type) and AAT (green), resulting from a least-squares superposition as described in the text. Some important water molecules of the MalY active site are represented as grey balls. The residue labels of both structures are indicated. (C) Overlay of mechanistically important active site residues of MalY and CBL (orange). (B) and (C) were generated with SETOR (Evans, 1993), (A) and all the subsequent figures were generated with DINO.
One striking difference from AAT is the high pKa of the internal aldimine of MalY (>9; T.Clausen, unpublished results). The imine pKa is thought to be determined mainly by the environment around the deprotonated hydroxyl group O3′ (Goldberg et al., 1991; Yano et al., 1993). In AAT, Tyr225 and Asn194 are hydrogen bonded to O3′, thereby stabilizing its negative charge and reducing the basicity of the aldimine nitrogen. In MalY, Asn173 and His204 are oriented properly to interact with O3′ in a similar manner. The hydrogen bond distances to O3′ are 2.7 and 3.5 Å, respectively. Furthermore, the side chain of Asn173 is held in place by Tyr356, which has no counterpart in AAT. As shown by the high pKa, the electron-withdrawing capacity of Asn173 and His204 seems to be dominated by electrostatic stabilization of the positively charged imine nitrogen. This may be the result of the high polarity in the substrate-binding pocket, caused mainly by the bound sulfate ion. In MalY, the guanidinium group of Arg365 anchors the sulfate ion by a doubly hydrogen-bonded ion pair in proximity to the nitrogen of the Schiff base (5.7 Å). The doubly negatively charged anion should compensate the charge of Arg365 as well as increase the polarity in the substrate-binding pocket. Although sulfate was used in the crystallization trial, the affinity of this binding site for small anions should generally be substantial. The deprotonated imine nitrogen is not a prerequisite for initiating the first step in transaldimination, the deprotonation of the substrate amino group. Alternative mechanisms have been proposed that are based on partial deprotonation of the amino group of the incoming substrate (AAT; Hayashi and Kagamiyama, 1997; Hayashi et al., 1998) or on the existence of an additional active site base (CBL; Clausen et al., 1997).
Unique to the active site of the MalY is the binding mode of the PLP phosphate group, which is bound primarily by five water molecules (Figure 3A and B). The only interaction with a protein residue is with Tyr61* of the neighbouring subunit, which is located within close hydrogen-bonding distance (2.5 Å). The increased distance between the N–terminus of helix 6 and the phosphate group may be the consequence of the steric requirement of the Val96 side chain. Other AT members exhibit a highly conserved glycine at this position. The participation of only one MalY residue in the interplay with the PLP phosphate group, the main anchor of the cofactor, is indicative of weak binding of the cofactor. The corresponding motional flexibility is further suggested by the difference in the atomic B–factors of the cofactor and the surrounding residues. The average B–factors are 32.4 and 27.5 Å2, respectively. Indeed, during optimization of purification, we noticed that MalY tended to lose the cofactor at high salt concentrations. Another special feature of MalY is the loose fixing of the Asp201 carboxylate group for interaction with the pyridine N1. Only one weak hydrogen bond is formed to the main chain NH of Ile203 (3.5 Å). In other members of the AT family, the corresponding aspartate is held in place by an extended hydrogen-bonding network involving histidines, serines, threonines and water molecules.
Zdych et al. (1995) demonstrated the catalytic similarity between MalY and CBL. Both enzymes are Cβ–Sγ lyases but, unlike CBL, MalY favours cystine over cystathionine as substrate. Comparison of the active sites of AAT, CBL and MalY indicates that the latter two enzymes exhibit a serine residue in close contact with the PLP-binding lysine (MalY, Ser36; and CBL, Ser339) while AAT has a glycine (Gly38) at this position. It should be this serine that directs the catalytic process after α–proton abstraction towards β–elimination. Analysis of random MalY mutants that were not able to utilize cystathionine revealed that residues Lys233, Asp201 and Ser36 are essential for the β–lyase activity. Therefore, the course of β–elimination can be described as follows: after formation of the external aldimine, the released deprotonated amino group of Lys233 abstracts the substrate Cα proton. The resulting carbanionic intermediate is stabilized by the electron-withdrawing capacity of the pyridine ring, which is mediated by Asp201 and Tyr121. Finally, Ser36 guides the amino group of Lys233 to the substrate Sγ. After protonation of Sγ and release of homocysteine (cystathionine as substrate) or cysteine persulfide (cystine as substrate), reverse transaldimination leads to iminopropionate, which is hydrolysed to pyruvate and ammonia outside the active site.
MalY as mal repressor
In order to isolate MalY mutants defective in mal gene expression, we made use of the observation that the β–cystathionase activity of MalY is able to complement the methionine requirement of a metC mutant (Zdych et al., 1995). Plasmid pJR115 that carries malY under the control of an isopropyl-β–d–thiogalactopyranoside (IPTG)-inducible promoter was mutagenized by passing it through a mutD (mutator) strain. The mutated plasmid was used to transform E.coli strain EZ7. This mutant contains malK–lacZ as an indicator of mal gene expression, and a metC mutation to obtain only mutations in malY whose products still exhibit sufficient cystathionase activity for the complementation of the methionine auxotrophy. Table II shows the result of the mutant analysis. Most of the mutations still allowed repression to some extent, particularly after IPTG induction. Only one mutation, I215T, was nearly negative in terms of repression even after IPTG induction. All mutant MalY proteins were produced in amounts similar to the wild type, and exhibit equivalent cystathionase activities with the exception of MalY A84T. This mutant protein could be detected in Western blots only after growth in the absence of IPTG, but it was severely degraded after IPTG induction. Looking at the position where the mutations had occurred, three clusters could be identified: class I comprised amino acids 83–84; class II, 181–189; and class III, 215–221. Since several mutations were obtained more than once in independent experiments, the mutant search resulting in this particular phenotype must be close to saturation.
Table II. Residues involved in the MalT interaction patch as deduced by mutational screening of repressor-negative MalY mutants.
| Plasmid | β-galactosidase activitya |
|
|---|---|---|
| before inductionb | after inductionc | |
| Wild-type | 0.03 | 0.005 |
| Null (vector) | 2.17 | 2.68 |
| T83A | 1.29 | 0.03 |
| T83Id | 1.16 | 0.47 |
| A84T | 0.29 | unstable |
| A84V | 1.11 | 0.01 |
| C181Rd | 0.99 | 0.01 |
| C181T | 1.43 | 0.02 |
| C181T, T244Y | 0.26 | unstable |
| E185G | 1.16 | 0.02 |
| A188T | 0.92 | 0.002 |
| D189G | 0.58 | 0.001 |
| I215Td | 1.46 | 1.26 |
| S218R | 1.43 | 0.22 |
| N219D | 1.26 | 0.01 |
| A221Vd | 1.45 | 0.33 |
aSpecific β-galactosidase activity of the malK–lacZ fusion of strain EZ7 after growth overnight in minimal medium with glycerol as the carbon source. Specific activity is given in μmol substrate hydrolysed/min/mg protein.
bThe reduction of MalY-related repressor function is proportional to the value of β-galactosidase activity before induction with IPTG.
cInduction was with 100 μM IPTG.
dMutation that was obtained more than once.
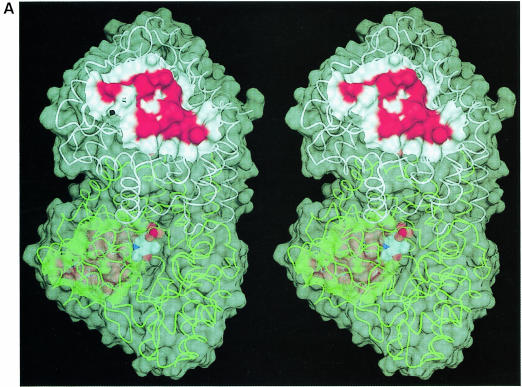
The genetic approach was helpful in deducing the likely region of interaction with MalT. When the mutational pattern was mapped onto the MalY crystal structure, a clear delimited surface was apparent although the three clusters are widespread over the primary sequence. This patch is situated on the solvent-accessible side of the seven-stranded β–sheet and has a circular, convex shape with a hydrophobic core at its centre, surrounded by highly polar residues. Since the PLP cofactor is bound far off at the opposite side of the large domain β–sheet, any contribution of PLP to MalT repression can be excluded (Figure 4A). Remarkably, most of the residues found in the negative repressor mutants are also involved in crystal contacts, suggesting their propensity to interact with other proteins.
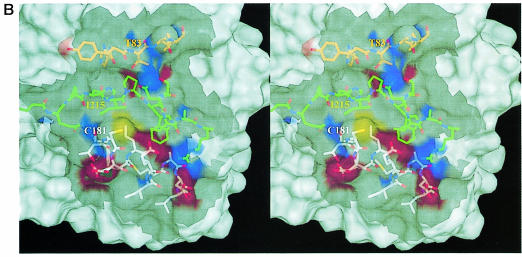
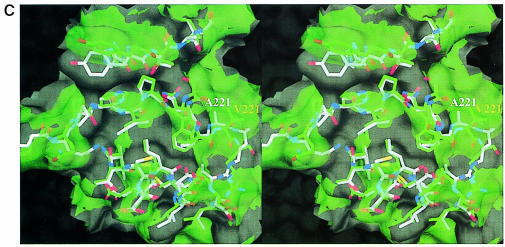
Fig. 4. MalT-binding site. (A) The active dimer of MalY illustrating the location of the MalT interaction patch. The Cα traces of both monomers (white and green) are overlaid with a transparent surface. The MalT interaction regions are emphasized by a solid surface that was defined on the basis of the negative repressor mutants (drawn in red). The PLP cofactor is shown in a van der Waals representation. Note that the MalT-binding surface and the active site entrance to the PLP cofactor are located on opposite sides of the individual MalY monomers. (B) Spatial structure of the MalT-binding patch, which is constructed from the three segments I, II and III as described in the text. The C atoms of segments I, II and III are coloured orange (residues 81–85), white (residues 179–191) and green (residues 212–222), respectively. For each segment, the most important residue regarding MalT repression (Table II) is labelled. The model is overlaid with a transparent surface that is colour coded by atom type. (C) Overlay of the wild-type and A221V MalT interaction segments I, II and III. The wild-type model and the corresponding surface are in white, the A221V mutant in green. Obviously, the mutation Ala221 to Val221 results in a concerted structural reorientation of all three segments. The orientations of (B) and (C) are identical.
The putative MalT-binding site is constructed by residues Thr83, Ala84, Cys181, Glu185, Ala188, Asp189, Ile215, Ser218, Asn219 and Ala221, and residues in their vicinity, i.e. those whose Cα is within 6 Å (Figure 4B). Thus, the MalT-binding patch is comprised of three regions: I, the C–terminal loop after helix 4 (residues 81–86); II, the N–terminal half of helix 9 (residues 181–190); and III, the extended loop initiated by Pro213 proceeding to Arg222 and including the short 310 helix 10. The extended loop III is wedged in between regions I and II and forms the central part of the patch. Not surprisingly, the strongest repressor mutations (I215T, S218R and A221V) are located on this loop. The most important residue, Ile215, sets up, together with Leu184 and Val220, a hydrophobic patch at the bottom of the groove. This hydrophobic pocket is enclosed by a hydrogen-bonding network involving Glu185, Asp189, Arg222, Asn219 and Thr83. The hydrogen bonds are established between residues from different segments (Glu185/Asp189 with Arg222 and Thr83 with Asn219), which should stabilize the relative orientation of I, II and III to each other. The sulfhydryl group of Cys181 does not participate in this network, but seems to be of major importance for the MalY repressor properties. The significance of regions I, II and III as the MalT interaction patch is strengthened further by the structure of a mutant protein (A221V) that is unable to repress mal gene function. The observed structural changes of the A221V mutant are restricted to the mutated region, as indicated by the overall r.m.s. deviation of 0.33 Å and the r.m.s. deviation for segment III of 0.90 Å. The reorientation of this segment is especially pronounced for residues Asn219–Arg222, leading to a disorder of the described peripheral hydrogen-bonding network between I, II and III (Figure 4C). The observed structural changes are caused by the steric requirement of Val221. In order to stay in van der Waals contact with Trp225, the side chain of Val221 pushes itself and loop III to the outside. The A221V structure clearly indicates that slight changes to segments I, II and III lead to dramatic effects on the repression potential of MalY. This behaviour can be anticipated for a receptive protein–protein interaction and therefore strengthens the hypothesis of a direct MalY–MalT interaction.
The physiological substrate
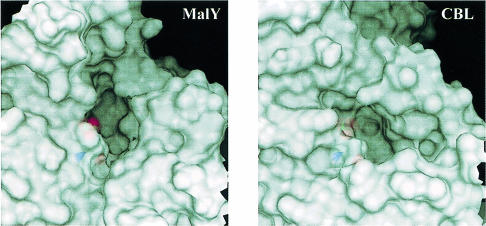
The question remains as to the natural substrate and the physiological activity of MalY. Cystine and cystathionine seem to be artificial substrates, indicating solely the type of catalysed reaction. When looking at the active site, the unique phosphate-binding mode as well as the absence of the network fixing the Asp201 side chain attests to an unusual PLP-binding mode. This may be the consequence a lack of evolutionary pressure on the catalytic efficiency or may indicate interaction with a sterically demanding substrate. As mentioned above, MalY is encoded by the malY gene of the malI malX malY gene cluster, which does not belong to the maltose regulon. Since malX encodes a specific enzyme II of the PTS, at least two different scenarios for MalY action should be considered. (i) In analogy to other PTS transporters, MalY utilizes the sugar phosphate that is transported by MalX. The active site morphology is well suited to bury a sugar residue substituted as a side chain of an amino acid, preferentially a cysteine. At least it is strikingly obvious that the active site pocket of MalY is much larger than those of related enzymes (Figure 5). Therefore, the physiological substrate of MalY could be an amino acid–sugar conjugate with a sulfur atom in the β–position. (ii) MalX imports a sugar derivative that can be metabolized by the cell, making other sugar sources dispensable. In this case, malY was simply recruited in the operon to cross-talk with the maltose system and, by chance, a PLP enzyme was elected for interaction with MalT. Thereafter, the PLP is required only to keep MalY in a conformation capable of interacting with MalT. Probably, the availability of a MalY derivative carrying mutations in the PLP-binding residues Tyr61, Lys233 and Asp201 will answer this question.
Fig. 5. Active site entrances of MalY (left) and CBL (right). The orientation and scaling of both figures are identical. The corresponding PLP cofactors are shown in a van der Waals representation below the surface. Part of the phosphate group of the MalY cofactor is directly accessible in the active site cleft.
Conclusions
MalY mediates its regulatory function by direct interaction with MalT, the positive activator of the maltose system. As is evident from the mutational and X-ray structure analyses, MalY contains a potential protein–protein interaction site that affects the MalT-dependent transcriptional activation. Dynamic light scattering (C.Steegborn, personal communication) and gel filtration experiments (Schreiber and Richet, 1999) indicate that MalT exists in an equilibrium of an inactive monomeric and an active oligomeric state. Each compound capable of influencing this equilibrium should lead to a variation in mal gene expression. Indeed, MalY competes with maltotriose for MalT binding, thereby restraining the oligomeric state and the activation potential of MalT, and stabilizes the inactive monomeric form of MalT (Schreiber et al., 2000). Consistent with this regulatory mechanism involving antagonistic binding of positive and negative effectors are the following observations: (i) MalY-mediated repression in vivo is sensitive to the amount of the endogenous inducer maltotriose. In a malQ mutant strain that exhibits an elevated level of inducer (Decker et al., 1993, 1999), a higher concentration of MalY is required to repress mal gene expression. (ii) Mutations in malT resulting in constitutive expression of all mal genes have an effect on both types of MalT effectors: the affinity for maltotriose is increased (Debarbouille et al., 1978; Dardonville and Raibaud, 1990) while the negative influence of MalK, MalY and Aes is strongly reduced (Reyes and Shuman, 1988; Zdych et al., 1995; Peist et al., 1997). Most probably, the three repressor proteins share a common structural motif that is required for effective binding to MalT. However, any kind of sequence similarity of MalK and Aes to the known region in MalY is lacking, pointing to a very specific interaction surface that each of these proteins adopted convergently.
Materials and methods
Purification and crystallization
Recombinant MalY was overexpressed according to Zdych et al. (1995). In brief, E.coli EZ5/pJR115 were grown in 3 l Erlenmeyer flasks with 650 ml of Luria broth containing 150 μg/ml ampicillin. After shaking at 37°C to an OD600 of 0.8, 1 mM IPTG was added, and the cultures were maintained at 37°C for another 20 h. Cells were harvested by centrifugation in a Beckman JS4.2 rotor at 4200 r.p.m. for 20 min, resuspended in 10 ml/l original culture of buffer A (100 mM Tris–HCl pH 7.8, 20 μM PLP and 2 mM EDTA) and stored at –70°C until further processing. All the following purification steps were carried out at 4°C. The course of purification was followed by SDS–PAGE and by monitoring the MalY cystathionase activity. Initially, the cells from a 5 l culture were lysed by ultrasonic treatment. After removal of the cell debris by centrifugation (70 000 g, 20 min, 4°C), the supernatant was loaded on a DEAE–Sepharose FF (500 ml; Pharmacia) column equilibrated with buffer A. The column was washed with two bed volumes of buffer A, and the proteins were eluted with a linear gradient from 0 to 0.2 M (NH4)2SO4 in buffer A. Active fractions were pooled, adjusted to 1.0 M (NH4)2SO4 and applied to a Phenyl–Sepharose HP (100 ml; Pharmacia) column equilibrated with buffer A containing 1.0 M (NH4)2SO4. Contaminants were removed by washing with 0.7 M (NH4)2SO4 in buffer A and elution was done by a linear salt gradient from 0.7 to 0.2 M (NH4)2SO4. MalY-containing fractions were pooled, concentrated with centripreps (Amicon) to 30 mg/ml and loaded on a Sephacryl S200 (300 ml; Pharmacia) gel filtration column, equilibrated with 10 mM Tris–HCl pH 7.8 and 20 μM PLP (buffer B). MalY was eluted with buffer B, pooled and concentrated to a final concentration of 25 mg/ml. The purified protein was shock-frozen with liquid nitrogen and stored at –70°C without loss of activity over months. From 5 l of culture, 200 mg of homogeneous protein were obtained.
Crystallization was carried out at 4°C using the sitting drop vapour diffusion method. Prior to crystallization, it was necessary to pre-incubate the protein (10 mg/ml) for 2 h on ice with buffer B containing 3 mM dithiothreitol. The drops were composed of 5 μl of protein and 3 μl of reservoir containing 100 mM MES/Tris pH 7.1 and 1.8 M (NH4)2SO4. The volume of the reservoir was 5 ml. Yellow plate-like crystals with dimensions of 30 × 300 × 300 μm3 appeared after 3 days. The crystals belong to space group P212121 with cell constants a = 60.6, b = 107.5 and c = 256.6 Å and showed a strong pseudo-C-centring. The degree of pseudo-symmetry was different for each crystal as judged from the ratio of even and odd (h + k) reflections. This ratio varied from 2 to 20. This anisomorphy problem was circumvented by reducing the (NH4)2SO4 content of the crystal mother liquor from 1.8 to 1.2 M, transforming all crystals to space group C2221 with cell constants of a = 56.5, b = 107.2 and c = 255.7 Å.
All initial crystal trials with the C181R, C181T, C181S, I215T and A221V mutants using Hampton Screen I/II and our in-house factorial solutions at different temperatures and different drop ratios failed. Only for the A221V mutant was it possible to grow crystals by microseeding. Wild-type crystal seeds were introduced into trials, containing 50 mM MES/Tris pH 6.5 and 1.5 M (NH4)2SO4, 36–39 h after setting up the drops. Two days later, small hexagonal plates developed belonging to space group P21 with cell constants of a = 58.2, b = 255.7, c = 60.4 Å and β = 118.2°.
Both crystal forms, C2221 and P21, have a low solvent content of 41% (VM = 2.1 Å3/Da) corresponding to two and four monomers per asymmetric unit, respectively. At synchrotron radiation, they diffract to at least 1.8 Å. Unfortunately, the special orientation of the long 256 Å axis (with respect to crystal morphology) in combination with a high mosaicity (>1°) restricted data collection for the wild-type enzyme to 2.5 Å and for the A221V mutant to 2.05 Å.
Data collection and MAD phasing
Initial heavy atom derivative screens were performed by soaking wild-type crystals in 100 mM MES/Tris pH 7.1 and 1.2 M (NH4)2SO4 including appropriate amounts of heavy atoms. ErCl3 was found to be a potential heavy atom derivative. Difference Patterson analysis yielded five Er sites corresponding to an overall phasing power of 1.5 for data between 15 and 3 Å. After backsoaking of MalY–ErCl3 crystals with heavy atom-free solution, one Er site was still well occupied, enabling structure solution by the MAD method.
X-ray diffraction data for MAD phasing of the wild type and for the molecular replacement solution of the A221V mutant were collected at the wiggler beamline BW6 at DORIS (DESY, Hamburg, Germany). Initially, an X–ray fluorescence spectrum was recorded in the vicinity of the Er absorption edge. Subsequently, diffraction data were collected at three different wavelengths using an MAR image plate detector (X–ray Research) at the maximum of f′′(1.4834 Å), the minimum of f′ (1.4840 Å) and at a remote wavelength (1.1 Å). Only for the f′′ wavelength were Friedel opposites in inverse beam geometry measured. All data collections at the BW6 beamline were done with one frozen crystal at 100 K using a cryostream (Oxford Cryosystems) and 25% glycerol in 1.2 M (NH4)2SO4, 0.1 M MES/Tris pH 7.1 as cryo-buffer. The diffraction data were processed and scaled with the programs DENZO and SCALEPACK (Otwinowski and Minor, 1993). Later stages of refinement were performed with a native data set collected at room temperature at an MAR image plate detector equipped with a rotating Cu anode operating at 120 mA and 50 kV. The data collection statistics are summarized in Table III.
Table III. Data collection and phasing statistics.
| Native | Erλ1 | Erλ2 | Erλ3 | A221V | |
|---|---|---|---|---|---|
| Data collectiona | |||||
| Space group | C2221 | C2221 | P21 | ||
| Cell constants (Å) | a = 60.6 | a = 56.8 | a = 58.2 | ||
| b = 107.5 | b = 106.5 | b = 255.7 β = 118.2° | |||
| c = 256.6 | c = 256.6 | c = 60.4 | |||
| Resolution range (Å) | 30.0–2.50 | 30.0–2.50 | 30.0–2.04 | ||
| Wavelength (Å) | 1.5418 | 1.4834 | 1.4840 | 1.1000 | 1.1000 |
| Observed reflections | 94 388 | 189 030 | 95 680 | 87 407 | 187 495 |
| Unique reflections | 24 839 | 25 204 | 23 902 | 22 321 | 96 350 |
| Whole range | |||||
| completeness (%) | 94.9 | 96.3 | 91.3 | 85.3 | 99.4 |
| Rmergeb | 8.3 | 5.2 | 4.4 | 4.3 | 4.0 |
| Iσ(I) | 11.4 | 28.7 | 21.1 | 27.9 | 20.8 |
| Last shell | |||||
| resolution range (Å) | 2.55–2.5 | 2.55–2.5 | 2.55–2.5 | 2.55–2.5 | 2.07–2.04 |
| completeness (%) | 88.7 | 92.4 | 90.5 | 83.3 | 99.2 |
| Rmerge | 30.3 | 25.7 | 22.3 | 22.0 | 26.9 |
| Iσ(I) | 3.3 | 7.1 | 5.0 | 7.3 | 4.3 |
| Phasing (15.0–2.5Å) | |||||
| phasing power (iso) | 0.80 | – | 0.87 | ||
| phasing power (ano) | 0.98 | 0.90 | 0.66 | ||
| Rcullis (iso)c | 0.87 | – | 0.80 | ||
| Rcullis (ano) | 0.74 | 0.80 | 0.81 | ||
| Figure of merit (before/after solvent flattening) | 0.444/0.786 |
aThe data for the native crystals were obtained at 298 K in-house, while those for the heavy atom derivatives and A221V mutant form were cryo collected (100 K) at BW6, DESY, Hamburg, Germany.
bRmerge = Σ∣I – <I>∣/ΣI.
cRcullis = <phase integrated lack of closure>/∣FPH – FP∣
Structure determination
The complete phasing procedure was carried out with programs of the CCP4 program suite (Collaborative Computational Project No. 4, 1994). Anomalous difference Patterson syntheses were calculated from the f′′ data set. Using the program RSPS, one strong Er site (12σ above 3σ) was localized. Difference Fourier maps based on this site yielded two minor Er sites. Refinement of heavy atom parameters and phase calculation from all MAD data sets were performed with MLPHARE (Table III). Subsequently, 20 cycles of solvent flattening and histogram matching were performed with the program DM assuming a solvent content of 40%. The solvent-flattened electron density map showed clear molecular boundaries and allowed the recognition of several secondary structural elements. Partial similarity of the PLP-binding domain to E.coli CBL was helpful in distinguishing between individual elements of the two MalY subunits and tracing the loop regions. After extraction of the non-crystallographic symmetry (NCS) operators with LSQMAN (Kleywegt, 1996) and 2–fold averaging of the original density with RAVE (Jones, 1992; Kleywegt and Jones, 1994), the resulting electron density map was of excellent quality and enabled the incorporation of a complete model with the exception of 30 N–terminal residues. The initial model had a crystallographic R–factor of 47% for all reflections in the resolution range 10–2.5 Å.
Initial phases for the A221V MalY crystal form were obtained by molecular replacement with the refined wild-type coordinates as a model. Using data up to 3.5 Å, rotation/translation searches were performed with the AMoRe package (Navaza, 1994) and yielded one solution well above the background, with a combined R-factor and correlation coefficient of 41 and 65%, respectively.
Refinement
The initial model was refined by energy-restrained crystallographic refinement with XPLOR (Brünger, 1992) using the parameters developed by Engh and Huber (1991). Use was made of the conventional least-squares refinement procedure on positional parameters and on B-factors. Bulk solvent, overall anisotropic B–factor corrections and NCS restraints were introduced based on the behaviour of the free R–factor index. Refinement proceeded in several cycles, which were interrupted for manual rebuilding with the program O (Jones et al., 1991). Since the refinement of the MAD data converged at an R–factor of 32% (Rfree 38%), the final refinement steps were carried out with an in-house collected wild-type data set. To fit the temperature factors of the model, a grouped B–factor refinement was carried out initially. Two B–factors were assigned to each residue, one for the side chain atoms and one for the main chain atoms. At later stages in refinement, the group constraints on the B–factor values were released to allow restrained individual refinement of isotropic B–factor values. Due to a peculiar crystal packing, the two NCS monomers of MalY exhibit large differences in their average B–factors (see Table I), impairing the use of NCS restraints on B–values. When the R–value was 28%, solvent molecules were introduced in stereochemically reasonable positions with high difference electron densities. During the whole refinement, the R–factor decreased from 47.0 to 20.1%, and the Rfree, calculated by setting aside 5% of the reflection data, from 47.5 to 26.2%. The stereochemistry of the model was validated with PROCHECK (Laskowski et al., 1993).
A similar refinement procedure to that for the wild-type protein was employed for the A221V crystal structure. Rounds of simulated annealing, positional and B–factor optimization with NCS restraints using XPLOR were alternated with manual refitting with the program O. In contrast to the wild-type model, electron density for the 30 N–terminal residues showed up and was fitted to the sequence. The sulfate ions were included only in the last round. Due to the high-resolution data obtained with the A221V crystal form, the NCS restraints on coordinates were omitted in the last cycles.
Screen for MalY repressor mutants
malY on plasmid pJR115 (Zdych et al., 1995) was subjected to in vivo MutD5 mutagenesis (Schaaper, 1988). After plasmid preparation, the pool of mutated plasmids was transformed into EZ7 (Zdych et al., 1995) and grown on minimal medium with 0.4% glycerol, 100 μg/ml ampicillin, 100 μM IPTG (for malY induction) and 40 μg/ml 5-bromo-4-chloro-3-indolyl-β–d–galactopyranoside (X–Gal). The screen was for darker colonies to gain mutants with reduced ability to repress malT. All mutations listed in Table II were derived from independent mutational events. The introduced mutations were confirmed by sequencing.
Acknowledgments
Acknowledgements
We thank Snezan Marinkovic (MPI Biochemistry, Martinsried) for excellent technical assistance and Evelyne Richet (Institut Pasteur, Paris) for helpful discussions.
References
- Alexander F.W., Sandmeier, E., Mehta, P.K. and Christen, P. (1994) Evolutionary relationships among pyridoxal-5′-phosphate-dependent enzymes. Regio-specific α, β and γ families. Eur. J. Biochem., 219, 953–960. [DOI] [PubMed] [Google Scholar]
- Boos W. and Shuman, H. (1998) Maltose/maltodextrin system of Escherichia coli: transport, metabolism and regulation. Microbiol. Mol. Biol. Rev., 62, 204–229. [DOI] [PMC free article] [PubMed] [Google Scholar]
- Bouma C.L. and Roseman, S. (1996) Sugar transport by the marine chitinolytic bacterium Vibrio furnissii–molecular cloning and analysis of the glucose and N-acetylglucosamine permeases. J. Biol. Chem., 271, 33457–33467. [DOI] [PubMed] [Google Scholar]
- Brünger A.T. (1992) XPLOR (Version 3.1) Manual. Yale University Press, New Haven, CT. [Google Scholar]
- Chapon C. (1982) Role of the catabolite activator protein in the maltose regulon of Escherichia coli. J. Bacteriol., 150, 722–729. [DOI] [PMC free article] [PubMed] [Google Scholar]
- Clausen T., Huber, R., Laber, B., Pohlenz, H.D. and Messerschmidt, A. (1996) Crystal structure of the pyridoxal-5′-phosphate dependent cystathionine β-lyase from Escherichia coli at 1.83 Å. J. Mol. Biol., 262, 202–224. [DOI] [PubMed] [Google Scholar]
- Clausen T., Laber, B. and Messerschmidt, A. (1997) Mode of action of cystathionine β-lyase. Biol. Chem., 378, 321–326. [PubMed] [Google Scholar]
- Collaborative Computational Project No. 4 (1994) The CCP4 suite: programs for protein crystallography. Acta Crystallogr. D, 50, 760–763. [DOI] [PubMed] [Google Scholar]
- Dardonville B. and Raibaud, O. (1990) Characterization of malT mutants that constitutively activate the maltose regulon of Escherichia coli. J. Bacteriol., 172, 1846–1852. [DOI] [PMC free article] [PubMed] [Google Scholar]
- Debarbouille M., Shuman, H.A., Silhavy, T.J. and Schwartz, M. (1978) Dominant constitutive mutations in malT, positive regulator gene of maltose regulon in Escherichia coli. J. Mol. Biol., 124, 359–371. [DOI] [PubMed] [Google Scholar]
- Decker K., Peist, R., Reidl, J., Kossmann, M., Brand, B. and Boos, W. (1993) Maltose and maltotriose can be formed endogenously in Escherichia coli from glucose and glucose-1-phosphate independently of enzymes of the maltose system. J. Bacteriol., 175, 5655–5665. [DOI] [PMC free article] [PubMed] [Google Scholar]
- Decker K., Plumbridge, J. and Boos, W. (1998) Negative transcriptional regulation of a positive regulator: the expression of malT, encoding the transcriptional activator of the maltose regulon of Escherichia coli, is negatively controlled by Mlc. Mol. Microbiol., 27, 381–390. [DOI] [PubMed] [Google Scholar]
- Decker K., Gerhardt, F. and Boos, W. (1999) The role of the trehalose system in regulating the maltose regulon of Escherichia coli. Mol. Microbiol., 32, 777–788. [DOI] [PubMed] [Google Scholar]
- Ehrmann M. and Boos, W. (1987) Identification of endogenous inducers of the Mal regulon in Escherichia coli. J. Bacteriol., 169, 3539–3545. [DOI] [PMC free article] [PubMed] [Google Scholar]
- Engh R.A. and Huber, R. (1991) Accurate bond and angle parameters for X-ray protein structure refinement. Acta Crystallogr. A, 47, 392–400. [Google Scholar]
- Evans S.V. (1993) SETOR–hardware-lighted 3-dimensional solid model representations of macromolecules. J. Mol. Graph., 11, 134–138. [DOI] [PubMed] [Google Scholar]
- Goldberg J.M., Swanson, R.V., Goodman, H.S. and Kirsch, J.F. (1991) The tyrosine-225 to phenylalanine mutation of Escherichia coli aspartate-aminotransferase results in an alkaline transition in the spectrophotometric and kinetic pKa values and reduced values of both kcat and Km. Biochemistry, 30, 305–312. [DOI] [PubMed] [Google Scholar]
- Hayashi H. and Kagamiyama, H. (1997) Transient-state kinetics of the reaction of aspartate aminotransferase with aspartate at low pH reveals dual routes in the enzyme–substrate association process. Biochemistry, 36, 13558–13569. [DOI] [PubMed] [Google Scholar]
- Hayashi H., Mizuguchi, H. and Kagamiyama, H. (1998) The imine–pyridine torsion of the pyridoxal 5′-phosphate Schiff base of aspartate aminotransferase lowers its pKa in the unliganded enzyme and is crucial for the successive increase in the pKa during catalysis. Biochemistry, 37, 15076–15085. [DOI] [PubMed] [Google Scholar]
- Holm L. and Sander, C. (1993) Protein structure comparison by alignment of distance matrices. J. Mol. Biol., 233, 123–138. [DOI] [PubMed] [Google Scholar]
- Jansonius J.N. (1998) Structure, evolution and action of vitamin B-6-dependent enzymes. Curr. Opin. Struct. Biol., 8, 759–769. [DOI] [PubMed] [Google Scholar]
- Jones T.A. (1992) A, yaap, asap, @#*? A set of averaging programs. In Dodson,E.J., Gover,S. and Wolf,W. (eds), Molecular Replacement. SERC Daresbury Laboratory, Warrington, UK, pp. 91–105. [Google Scholar]
- Jones T.A., Zou, J.Y., Cowan, S.W. and Kjeldgaard, M. (1991) Improved methods for building protein models in electron-density maps and the location of errors in these models. Acta Crystallogr. A, 47, 110–119. [DOI] [PubMed] [Google Scholar]
- Kabsch W. and Sander, C. (1983) Dictionary of protein secondary structure–pattern-recognition of hydrogen-bonded and geometrical features. Biopolymers, 22, 2577–2637. [DOI] [PubMed] [Google Scholar]
- Käck H., Sandmark, J., Gibson, K., Schneider, G. and Lindqvist, Y. (1999) Crystal structure of diaminopelargonic acid synthase: evolutionary relationships between pyridoxal-5′-phosphate-dependent enzymes. J. Mol. Biol., 291, 857–876. [DOI] [PubMed] [Google Scholar]
- Kleywegt G.J. (1996) Use of non-crystallographic symmetry in protein structure refinement. Acta Crystallogr. D, 52, 842–857. [DOI] [PubMed] [Google Scholar]
- Kleywegt G.J. and Jones,T.A. (1994) Halloween… masks and bones. In Bailey,S., Hubbard,R. and Waller,D. (eds), From First Map to Final Model. SERC Daresbury Laboratory, Warrington, UK, pp. 59–66. [Google Scholar]
- Kraulis P.J. (1991) MOLSCRIPT: a program to produce both detailed and schematic plots of protein structures. J. Appl. Crystallogr., 24, 946–950. [Google Scholar]
- Kühnau S., Reidl, J. and Boos, W. (1989) The endogenous regulation of the maltose regulon is affected by Malk and Mali. Biol. Chem. Hoppe Seyler, 370, 925–935. [Google Scholar]
- Laskowski R.A., Macarthur, M.W., Moss, D.S. and Thornton, J.M. (1993) PROCHECK: a program to check the stereochemical quality of protein structures. J. Appl. Crystallogr., 26, 283–291. [Google Scholar]
- Mehta P.K. and Christen, P. (1993) Homology of pyridoxal-5′-phosphate-dependent aminotransferases with the cobC (cobalamin synthesis), nifS (nitrogen-fixation), pabC (p-aminobenzoate synthesis) and malY (abolishing endogenous induction of the maltose system) gene products. Eur. J. Biochem., 211, 373–376. [DOI] [PubMed] [Google Scholar]
- Merritt E.A. and Murphy, M.E.P. (1994) RASTER3D version 2.0: a program for photorealistic molecular graphics. Acta Crystallogr. D, 50, 869–873. [DOI] [PubMed] [Google Scholar]
- Navaza J. (1994) AMoRe: an automated package for molecular replacement. Acta Crystallogr. A, 50, 157–163. [Google Scholar]
- Otwinowski Z. and Minor,W. (1993) DENZO: A Film Processing Program For Macromolecular Crystallography. Yale University Press, New Haven, CT. [Google Scholar]
- Peist R., Koch, A., Bolek, P., Sewitz, S., Kolbus, T. and Boos, W. (1997) Characterization of the aes gene of Escherichia coli encoding an enzyme with esterase activity. J. Bacteriol., 179, 7679–7686. [DOI] [PMC free article] [PubMed] [Google Scholar]
- Philippsen A. (1999) Visualizing structural biology. http://www.bioz.unibas.ch/~xray/dino.
- Raibaud O., Vidalingigliardi, D. and Richet, E. (1989) A complex nucleoprotein structure involved in activation of transcription of two divergent Escherichia coli promoters. J. Mol. Biol., 205, 471–485. [DOI] [PubMed] [Google Scholar]
- Reidl J. and Boos, W. (1991) The malX malY operon of Escherichia coli encodes a novel enzyme II of the phosphotransferase system recognizing glucose and maltose and an enzyme abolishing the endogenous induction of the maltose system. J. Bacteriol., 173, 4862–4876. [DOI] [PMC free article] [PubMed] [Google Scholar]
- Reidl J., Romisch, K., Ehrmann, M. and Boos, W. (1989) MalI, a novel protein involved in regulation of the maltose system of Escherichia coli, is highly homologous to the repressor proteins GalR, CytR and LacI. J. Bacteriol., 171, 4888–4899. [DOI] [PMC free article] [PubMed] [Google Scholar]
- Reyes M. and Shuman, H.A. (1988) Overproduction of MalK protein prevents expression of the Escherichia coli Mal regulon. J. Bacteriol., 170, 4598–4602. [DOI] [PMC free article] [PubMed] [Google Scholar]
- Rhee S., Silva, M.M., Hyde, C.C., Rogers, P.H., Metzler, C.M., Metzler, D.E. and Arnone, A. (1997) Refinement and comparisons of the crystal structures of pig cytosolic aspartate aminotransferase and its complex with 2-methylaspartate. J. Biol. Chem., 272, 17293–17302. [PubMed] [Google Scholar]
- Rossol I. and Puhler, A. (1992) The Corynebacterium glutamicum aecd gene encodes a C–S lyase with α-β-elimination activity that degrades aminoethylcysteine. J. Bacteriol., 174, 2968–2977. [DOI] [PMC free article] [PubMed] [Google Scholar]
- Schaaper R.M. (1988) Mechanism of mutagenesis in the Escherichia coli mutator MutD5: role of DNA mismatch repair. Proc. Natl Acad. Sci. USA, 85, 8126–8130. [DOI] [PMC free article] [PubMed] [Google Scholar]
- Schreiber V. and Richet, E. (1999) Self-association of the Escherichia coli transcription activator MalT in the presence of maltotriose and ATP. J. Biol. Chem., 274, 33220–33226. [DOI] [PubMed] [Google Scholar]
- Schreiber V., Steegborn,C., Clausen,T., Boos,W. and Richet,E. (2000) A new mechanism for the control of a procaryotic transcriptional regulator: antagonistic binding of positive and negative effectors. Mol. Microbiol., in press. [DOI] [PubMed] [Google Scholar]
- Yano T., Mizuno, T. and Kagamiyama, H. (1993) A hydrogen-bonding network modulating enzyme function–asparagine-194 and tyrosine-225 of Escherichia coli aspartate-aminotransferase. Biochemistry, 32, 1810–1815. [DOI] [PubMed] [Google Scholar]
- Zdych E., Peist, R., Reidl, J. and Boos, W. (1995) MalY of Escherichia coli is an enzyme with the activity of a β-C–S lyase (cystathionase). J. Bacteriol., 177, 5035–5039. [DOI] [PMC free article] [PubMed] [Google Scholar]


