

Abstract
A genome-wide association study was performed using the Affymetrix 6.0 chip to identify genes associated with diabetic nephropathy in African Americans. Association analysis was performed adjusting for admixture in 965 type 2 diabetic African American patients with end-stage renal disease (ESRD) and in 1029 African Americans without type 2 diabetes or kidney disease as controls. The top 724 single nucleotide polymorphisms (SNPs) with evidence of association to diabetic nephropathy were then genotyped in a replication sample of an additional 709 type 2 diabetes-ESRD patients and 690 controls. SNPs with evidence of association in both the original and replication studies were tested in additional African American cohorts consisting of 1246 patients with type 2 diabetes without kidney disease and 1216 with non-diabetic ESRD to differentiate candidate loci for type 2 diabetes-ESRD, type 2 diabetes, and/or all-cause ESRD. Twenty-five SNPs were significantly associated with type 2 diabetes-ESRD in the genome-wide association and initial replication. Although genome-wide significance with type 2 diabetes was not found for any of these 25 SNPs, several genes, including RPS12, LIMK2, and SFI1 are strong candidates for diabetic nephropathy. A combined analysis of all 2890 patients with ESRD showed significant association SNPs in LIMK2 and SFI1 suggesting that they also contribute to all-cause ESRD. Thus, our results suggest that multiple loci underlie susceptibility to kidney disease in African Americans with type 2 diabetes and some may also contribute to all-cause ESRD.
Introduction
Diabetes-associated nephropathy is the most common cause of end-stage renal disease (ESRD) in the United States, accounting for 44.6% of incident cases (1). African Americans (AA) have a disproportionately high risk for developing diabetic nephropathy (DN). Compared to Caucasian Americans (CA), AAs have a 3.7-fold greater incidence rate of developing ESRD and at least a 1.9-fold greater incidence rate compared to other racial and ethnic minorites in the United States (1). Many studies have shown that there is a genetic component to ESRD as reviewed by Bowden, 2003 (2). Familial aggregation of DN and diabetic ESRD has been demonstrated in CAs (3–5), and AAs (6). Clustering occurred in these families without significant differences in glycemic control (4). However, marked racial and ethnic disparities in familial clustering exist. CAs with a close relative who has ESRD face a 2.7-fold increased risk of developing ESRD (5); whereas AAs who have a close relative with ESRD have a 9-fold increased risk of developing ESRD (6). This significant difference in rates of renal complications between CAs and AAs is observed after controlling for differences in socio-economic status (5, 6).
Several studies have attempted to detect genetic variants influencing risk of DN and diabetic ESRD. The first genome-wide association study (GWAS) for DN was a low density (80K SNPs) gene-based study performed in a Japanese population (7). This was followed by a study using a DNA pooling method investigating 115K SNPs in Pima Indians with DN (8). More recently, a GWAS was conducted for type 1 diabetes-associated nephropathy in a CA population (9), and multiple studies have assessed for association with chronic kidney disease (CKD), and glomerular filtration rate (GFR) in non-diabetic populations of European ancestry (10–12). There have been no prior reports of GWAS in AAs with T2DM-ESRD. Herein, we report the first GWAS investigating 832K SNPs for association with type 2 diabetes-associated ESRD (T2DM-ESRD) in AAs.
Results
Clinical characteristics of the study samples
The clinical characteristics of the study samples used in the GWAS, replication, and trait discrimination phases are shown in Table 1. The GWAS and replication populations are broadly similar. In both groups, the age at enrollment for the T2DM-ESRD subjects is older than for the control groups. However, the age at enrollment for the control groups in the GWAS and replication phases is older than the age of T2DM diagnosis in the T2DM-ESRD and T2DM subjects. All of the case groups with T2DM (T2DM-ESRD and T2DM) have a higher proportion of females; possibly reflecting the increased prevalence of T2DM among AA women (13), participation bias, and survival. On average, all of the groups were overweight or obese at the time of enrollment. Subjects with ESRD lacking T2DM (non-T2DM ESRD subjects) had the lowest average body mass index (BMI; 27.0 kg/m², Table 1), and the T2DM subjects without nephropathy (T2DM) had the highest average BMI (33.5 kg/m², Table 1).
Table 1. Clinical Characteristics of Study Samples.
Values are presented as trait mean and standard deviation.
| GWAS | Replication | Trait Discrimination | ||||
|---|---|---|---|---|---|---|
| T2DM-ESRD | Control | T2DM-ESRD | Control | T2DM | non-T2DM ESRD | |
| n | 965 | 1029 | 709 | 690 | 1246 | 1216 |
| Female (%) | 61.20% | 57.30% | 55.70% | 51.30% | 64.00% | 44.70% |
| Age at Enrollment (years) | 61.6 ± 10.5 | 49.0 ± 11.9 | 60.2 ± 10.4 | 48.5 ± 12.8 | 57.2 ± 11.7 | 53.0 ± 14.5 |
| Age at T2D diagnosis (years) | 41.6 ± 12.4 | ― | 39.4 ± 12.5 | ― | 46.1 ± 12.6 | ― |
| Age at ESRD diagnosis (years) |
58.0 ± 10.9 | ― | 56.7 ± 10.9 | ― | ― | 47.7 ± 15.5 |
| T2D to ESRD duration (years) |
16.2 ± 10.9 | ― | 20.4 ± 10.5 | ― | ― | ― |
| BMI (kg/m²) | 29.7 ± 7.0 | 30.0 ± 7.0 | 29.8 ± 6.9 | 29.4 ± 7.6 | 33.5 ± 7.6 | 27.0 ± 7.0 |
GWAS
After the application of SNP and sample quality control metrics, 832,357 autosomal SNPs were analyzed in 965 AA T2DM-ESRD case subjects and 1,029 AA non-diabetic, non-nephropathy controls. A summary of the association results is shown in Figure 1 and the corresponding quantile-quantile plot is shown in Supplemental Figure 1. The results shown are adjusted for admixture; however, the primary inferences remain the same adjusting for admixture, age, and gender. The top hit was rs5750250 located on chromosome 22 in the MYH9 (non-muscle myosin heavy chain 9) gene (P = 3.00 ×10⁻⁷, Figure 1). This gene has been previously associated with non-diabetic and diabetic forms of ESRD (14–17). In total, there were 126 SNPs with P values <1.0×10⁻⁴ (Figure 1). The flow of the study through the GWAS, replication, combined and trait discrimination phases is outlined in Table 2.
Figure 1. Genome-Wide Association Study Results.
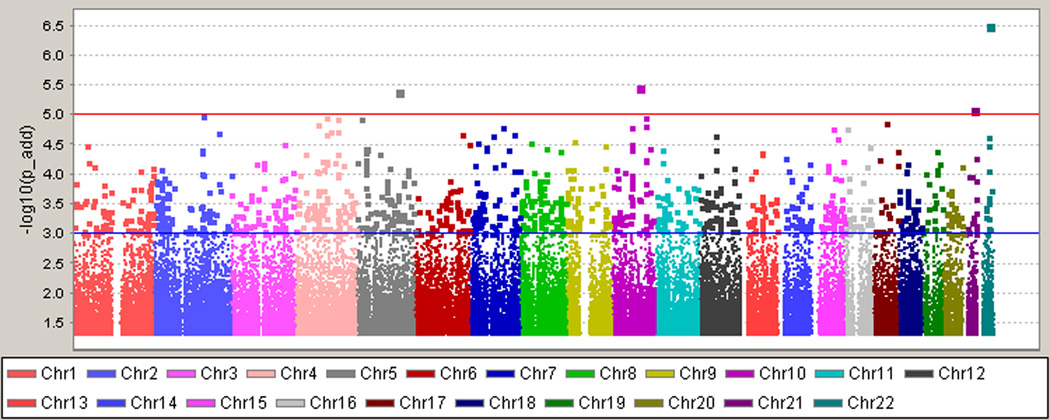
The top hit was rs5750250 located on chromosome 22 in the MYH9 gene (P =3.00×10⁻⁷). Results are adjusted for admixture using PC1 as a covariate in the analysis. P values are shown under the additive model.
Table 2. Study Design and Progression.
| Step | Stage | Sample |
Description | ||
|---|---|---|---|---|---|
| Total | Cases | Controls | |||
| 1 | GWAS | 1994 | 965 T2DM-ESRD Cases | 1029 non-diabetic, non-nephropathy Controls |
GWAS scan with 832,357 SNPs |
| 2 | Replication | 1399 | 709 T2DM-ESRD Cases | 690 non-diabetic, non-nephropathy Controls |
Test 724 SNPs from Step 1 for replication |
| 3 | Combined Analysis (GWAS + Replication) |
3393 | 1674 T2DM-ESRD Cases | 1719 non-diabetic, non-nephropathy Controls |
Identify SNPs with the strongest evidence of association with T2DM-ESRD |
| 4 | Trait Discrimination: Test for T2DM or T2DM- ESRD |
2920 | 1674 T2DM-ESRD Cases | 1246 T2DM (lacking nephropathy) Cases |
Test 67 SNPs from Step 3 to differentiate between T2DM-ESRD & T2DM loci |
| 5 | Test for non-T2DM ESRD | 2935 | 1216 non-T2DM ESRD Cases |
1719 non-diabetic, non-nephropathy Controls |
Test 67 SNPs from Step 3 for association with All-cause ESRD |
| 6 | Test for All-Cause ESRD | 4609 | 2890 ESRD Cases (1674 T2DM-ESRD and 1216 non-T2DM ESRD) |
1719 non-diabetic, non-nephropathy Controls |
Test 67 SNPs from Step 3 for association with All-cause ESRD in the largest sample set |
Replication and Combined Analysis of T2DM-ESRD cases and non-diabetic, non-nephropathy controls
In an effort to replicate the GWAS results, 724 top scoring SNPs were genotyped in an independent sample of 709 AA T2DM-ESRD cases and 690 AA non-diabetic, non-nephropathy controls (Study Design, Table 2; Results, Supplemental Table 1). The 724 SNPs that were selected for testing in the replication sample were SNPs with the strongest P values for association and with high quality scores for genotyping, i.e. missing rate less than 0.02 (or missing rate less than 0.05 but missing rate between cases and controls not significantly different). In addition, P values for Hardy-Weinberg proportions for cases were > 0.0001 and for controls > 0.01. SNPs were prioritized on significance of the additive genetic model unless there was a priori evidence for follow-up, e.g. MYH9. In this replication analysis, 67 SNPs showed nominal evidence of replication: additive P value <0.05 with association in the same direction (Supplemental Table 1). Table 3 summarizes the association results for 25 SNPs at 19 potential T2DM-ESRD loci. T2DM-ESRD loci were identified during the trait discrimination analyses as shown in Table 2 and were based on the following criteria: 1) associated in the replication phase, 2) associated in the T2DM-ESRD v T2DM, non-nephropathy comparison (Table 4), and 3) showed no or nominal association (P >0.01) in the T2DM, non-nephropathy v Controls comparison (Table 4). Table 3 shows P values for association in the GWAS, the replication sample, and the combined cohort: 1,674 T2DM-ESRD cases and 1,719 non-diabetic, non-nephropathy controls. No SNP reached genome-wide significance (P ≤ 5×10⁻⁸), P values ranged from 1.24×10⁻⁴ to 7.04×10⁻⁷, Table 3, Combined analysis.
Table 3. Diabetic Nephropathy Candidate Loci.
GWAS, Replication, and Combined (GWAS+Replication) P values for diabetic nephropathy candidate loci across the genome.
MAF: Minor Allele Frequency. OR: Odds Ratio. 95% CI: 95% Confidence Interval.
| Locus |
GWAS T2DM-ESRD (n=965) Controls (n=1029) |
Replication T2DM-ESRD (n=709) Controls (n=690) |
Combined T2DM-ESRD (n=1674) Controls (n=1719) |
|||||||||
|---|---|---|---|---|---|---|---|---|---|---|---|---|
| Marker | Chr | Position | Nearest Gene(s) |
Minor Allele (Major Allele) |
MAF T2DM- ESRD |
MAF Control |
Additive P value |
MAF T2DM- ESRD |
MAF Control |
Additive P value |
Additive P value |
OR (95% CI) |
| rs10888287 | 1 | 246,184,039 | OR2L13 | G(T) | 0.439 | 0.503 | 5.03E-04 | 0.444 | 0.495 | 0.0482 | 5.97E-05 | 0.82 (0.75–0.90) |
| rs4260465 | 3 | 164,231,046 | No gene | G(C) | 0.364 | 0.414 | 4.31E-04 | 0.381 | 0.421 | 0.0382 | 4.50E-05 | 0.81 (0.74–0.90) |
| rs11730446 | 4 | 96,382,267 | UNC5C | G(A) | 0.459 | 0.403 | 6.23E-04 | 0.459 | 0.424 | 0.0465 | 1.24E-04 | 1.21 (1.10–1.33) |
| rs891382 | 4 | 147,371,790 | SLC10A7/LSM6 | G(A) | 0.085 | 0.059 | 3.19E-04 | 0.081 | 0.065 | 0.0183 | 2.42E-05 | 1.49 (1.24–1.80) |
| rs7697691 | 4 | 182,853,951 | No gene | G(A) | 0.243 | 0.285 | 0.0016 | 0.243 | 0.285 | 0.0127 | 7.37E-05 | 0.80 (0.72–0.89) |
| rs3822908 | 6 | 97,706,333 | C6orf167 | C(T) | 0.125 | 0.162 | 3.63E-04 | 0.121 | 0.147 | 0.0462 | 4.52E-05 | 0.75 (0.65–0.86) |
| rs7760831 | 6 | 102,071,536 | GRIK2 | C(T) | 0.176 | 0.222 | 2.55E-04 | 0.193 | 0.224 | 0.0455 | 3.48E-05 | 0.77 (0.69–0.87) |
| rs208865 | 6 | 130,114,249 | C6orf191/ARHGAP18 | T(C) | 0.118 | 0.082 | 2.14E-04 | 0.115 | 0.091 | 0.0364 | 2.90E-05 | 1.41 (1.20–1.66) |
| rs9493454 | 6 | 133,186,322 | RPS12 | C(A) | 0.439 | 0.376 | 4.91E-04 | 0.453 | 0.395 | 0.0089 | 1.72E-05 | 1.24 (1.13–1.37) |
| rs7769051 | 6 | 133,188,489 | RPS12 | A(C) | 0.349 | 0.289 | 4.06E-04 | 0.362 | 0.3 | 0.0012 | 2.20E-06 | 1.28 (1.16–1.42) |
| rs6930576 | 6 | 148,746,647 | SASH1 | A(G) | 0.337 | 0.276 | 1.87E-05 | 0.319 | 0.274 | 0.0099 | 7.04E-07 | 1.31 (1.18–1.45) |
| rs773506 | 9 | 93,015,292 | AUH | A(G) | 0.179 | 0.233 | 3.27E-04 | 0.174 | 0.223 | 0.0130 | 6.45E-06 | 0.76 (0.67–0.85) |
| rs11175885 | 12 | 64,400,897 | C12orf66/TMEM5 | G(A) | 0.181 | 0.234 | 0.0013 | 0.19 | 0.249 | 0.0106 | 2.18E-05 | 0.77 (0.68–0.87) |
| rs2358944 | 12 | 64,403,825 | MSRB3/HMGA2 | A(G) | 0.178 | 0.232 | 9.48E-04 | 0.188 | 0.256 | 0.0018 | 3.54E-06 | 0.75 (0.67–0.85) |
| rs2904532 | 12 | 65,582,311 | GRIP1/CAND1 | G(A) | 0.141 | 0.183 | 8.17E-04 | 0.148 | 0.184 | 0.0172 | 4.87E-05 | 0.76 (0.67–0.87) |
| rs11176482 | 12 | 65,582,814 | GRIP1/CAND1 | C(T) | 0.141 | 0.184 | 7.08E-04 | 0.147 | 0.182 | 0.0202 | 4.79E-05 | 0.76 (0.67–0.87) |
| rs12302041 | 12 | 76,654,356 | NAV3 | A(G) | 0.085 | 0.055 | 3.09E-04 | 0.088 | 0.06 | 0.0149 | 1.15E-05 | 1.54 (1.27–1.87) |
| rs1978243 | 14 | 86,596,160 | No gene | T(C) | 0.22 | 0.274 | 7.53E-04 | 0.221 | 0.274 | 0.0105 | 1.61E-05 | 0.78 (0.70–0.87) |
| rs6494387 | 15 | 61,132,579 | TPM1 | A(G) | 0.367 | 0.311 | 2.32E-04 | 0.358 | 0.32 | 0.0209 | 1.80E-05 | 1.25 (1.13–1.39) |
| rs1034589 | 22 | 29,909,233 | RNF185 | C(T) | 0.036 | 0.062 | 0.0010 | 0.033 | 0.065 | 0.0055 | 1.06E-05 | 0.59 (0.46–0.74) |
| rs2106294 | 22 | 29,975,759 | LIMK2 | C(T) | 0.035 | 0.062 | 7.49E-04 | 0.031 | 0.064 | 0.0028 | 4.11E-06 | 0.57 (0.45–0.72) |
| rs4820043 | 22 | 29,977,094 | LIMK2 | A(G) | 0.036 | 0.062 | 0.0010 | 0.031 | 0.065 | 0.0026 | 5.07E-06 | 0.57 (0.45–0.73) |
| rs5749286 | 22 | 30,230,359 | SFI1 | A(C) | 0.038 | 0.065 | 0.0013 | 0.036 | 0.068 | 0.0030 | 9.79E-06 | 0.60 (0.47–0.75) |
| rs16996381 | 22 | 34,841,225 | APOL3 | G(A) | 0.336 | 0.391 | 0.0018 | 0.371 | 0.432 | 0.0191 | 1.06E-04 | 0.82 (0.75–0.91) |
| rs735853 | 22 | 35,009,161 | MYH9 | G(C) | 0.082 | 0.123 | 4.59E-04 | 0.079 | 0.118 | 0.0091 | 1.20E-05 | 0.69 (0.59–0.82) |
Table 4. Diabetic Nephropathy Candidate Loci: Trait Discrimination.
Comparison of T2DM-ESRD versus T2DM, non-nephropathy subjects and T2DM, non-nephropathy subjects versus non-diabetic normal controls in diabetic nephropathy candidate loci across the genome.
OR: Odds Ratio. 95% CI: 95% Confidence Interval
| Locus |
T2DM-ESRD (n=1674) v T2DM (n=1246) |
T2DM (n=1246) v Controls (n=1719) |
|||||
|---|---|---|---|---|---|---|---|
| Marker | Chr | Position | Nearest Gene(s) |
Additive P value |
OR (95% CI) | Additive P value |
OR (95% CI) |
| rs10888287 | 1 | 246,184,039 | OR2L13 | 0.0361 | 0.89 (0.80–0.99) | 0.1487 | 0.93 (0.84–1.03) |
| rs4260465 | 3 | 164,231,046 | No gene | 2.63E-05 | 0.80 (0.72–0.89) | 0.5177 | 1.03 (0.93–1.15) |
| rs11730446 | 4 | 96,382,267 | UNC5C | 0.0068 | 1.16 (1.04–1.29) | 0.3319 | 1.05 (0.95–1.17) |
| rs891382 | 4 | 147,371,790 | SLC10A7/LSM6 | 1.86E-04 | 1.49 (1.21–1.83) | 0.8984 | 1.01 (0.82–1.25) |
| rs7697691 | 4 | 182,853,951 | No gene | 0.0046 | 0.84 (0.75–0.95) | 0.3664 | 0.95 (0.84–1.07) |
| rs3822908 | 6 | 97,706,333 | C6orf167 | 0.0336 | 0.84 (0.72–0.99) | 0.1979 | 0.91 (0.78–1.05) |
| rs7760831 | 6 | 102,071,536 | GRIK2 | 0.0494 | 0.87 (0.76–1.00) | 0.0587 | 0.88 (0.78–1.00) |
| rs208865 | 6 | 130,114,249 | C6orf191/ARHGAP18 | 0.0220 | 1.23 (1.03–1.46) | 0.1259 | 1.15 (0.96–1.37) |
| rs9493454 | 6 | 133,186,322 | RPS12 | 8.79E-04 | 1.20 (1.08–1.34) | 0.5079 | 1.04 (0.93–1.16) |
| rs7769051 | 6 | 133,188,489 | RPS12 | 0.0036 | 1.18 (1.06–1.32) | 0.1614 | 1.09 (0.97–1.22) |
| rs6930576 | 6 | 148,746,647 | SASH1 | 0.0053 | 1.18 (1.05–1.32) | 0.0621 | 1.12 (0.99–1.25) |
| rs773506 | 9 | 93,015,292 | AUH | 2.57E-04 | 0.78 (0.69–0.89) | 0.7484 | 0.98 (0.87–1.11) |
| rs11175885 | 12 | 64,400,897 | C12orf66/TMEM5 | 0.0226 | 0.86 (0.75–0.98) | 0.1068 | 0.90 (0.79–1.02) |
| rs2358944 | 12 | 64,403,825 | MSRB3/HMGA2 | 0.0047 | 0.83 (0.72–0.94) | 0.1532 | 0.91 (0.80–1.03) |
| rs2904532 | 12 | 65,582,311 | GRIP1/CAND1 | 0.0047 | 0.81 (0.71–0.94) | 0.3862 | 0.94 (0.82–1.08) |
| rs11176482 | 12 | 65,582,814 | GRIP1/CAND1 | 0.0070 | 0.82 (0.71–0.95) | 0.3052 | 0.93 (0.81–1.07) |
| rs12302041 | 12 | 76,654,356 | NAV3 | 0.0226 | 1.27 (1.03–1.55) | 0.0924 | 1.21 (0.97–1.50) |
| rs1978243 | 14 | 86,596,160 | No gene | 0.0332 | 0.87 (0.77–0.99) | 0.0743 | 0.90 (0.79–1.01) |
| rs6494387 | 15 | 61,132,579 | TPM1 | 0.0155 | 1.15 (1.03–1.29) | 0.1683 | 1.08 (0.97–1.21) |
| rs1034589 | 22 | 29,909,233 | RNF185 | 0.0274 | 0.74 (0.57–0.97) | 0.0438 | 0.79 (0.63–0.99) |
| rs2106294 | 22 | 29,975,759 | LIMK2 | 0.0167 | 0.72 (0.55–0.94) | 0.0411 | 0.79 (0.63–0.99) |
| rs4820043 | 22 | 29,977,094 | LIMK2 | 0.0162 | 0.72 (0.55–0.94) | 0.0460 | 0.79 (0.63–1.00) |
| rs5749286 | 22 | 30,230,359 | SFI1 | 0.0274 | 0.75 (0.58–0.97) | 0.0344 | 0.78 (0.62–0.98) |
| rs16996381 | 22 | 34,841,225 | APOL3 | 1.76E-04 | 0.82 (0.74–0.91) | 0.8152 | 1.01 (0.91–1.12) |
| rs735853 | 22 | 35,009,161 | MYH9 | 8.57E-04 | 0.73 (0.61–0.88) | 0.4515 | 0.94 (0.80–1.11) |
The strongest association in the combined analysis (GWAS+replication) was with rs6930576 (P = 7.04×10⁻⁷, Odds Ratio (OR) (95% Confidence Interval (95% CI)) = 1.31 (1.18–1.45); Table 3, Supplemental Figure 2a). SNP rs6930576 is located in intron 1 of the SAM and SH3 domain containing 1 (SASH1) gene. Six other hits were detected in four regions with combined P values less than 1.0×10⁻⁵. SNP rs7769051 is located 8kb upstream of the ribosomal S12 (RPS12) gene (P = 2.2×10⁻⁶, OR (95% CI) = 1.28 (1.16–1.42); Table 3, Supplemental Figure 2b). SNP rs773506 (P = 6.45×10⁻⁶, OR (95% CI) = 0.76 (0.67–0.85); Table 3, Supplemental Figure 2c) is located 600bp 3’ of AUH (AU RNA-binding protein/enoyl-Coenzyme A). Next, SNP rs2358944 (P = 3.54×10⁻⁶, OR (95% CI) = 0.75 (0.67–0.85); Table 3, Supplemental Figure 2d) is 38kb from the non-coding RNA, ribosomal protein SA pseudogene 52 (RPSAP52). This SNP, rs2358944, is also located near two coding genes: HMGA2, high mobility group AT-hook 2, (101kb upstream of the variant) and MSRB3, methionine sulfoxide reductase B3, (257kb downstream of the marker). Finally, there were three hits located in the LIMK2 (LIM domain kinase 2) – SFI1 (Sfi1 homolog, spindle assembly associated (yeast)) region: rs2106294 and rs4820043 are both located in intron 2 of LIMK2 (P = 4.11×10⁻⁶ and 5.07×10⁻⁶, OR (95% CI) = 0.57 (0.45–0.72) and 0.57 (0.45–0.73) respectively, Table 3, Supplemental Figure 2e), and rs5749286 is located in intron 1 of SFI1 (P = 9.79×10⁻⁶, OR (95% CI) = 0.60 (0.47–0.75); Table 3, Supplemental Figure 2e). The MYH9 SNP seen in the initial GWAS, rs5750250 did not replicate (P = 0.0594, Supplemental Table 2) and had a combined P value = 1.66×10⁻⁷ (Supplemental Table 2).
Discrimination between T2DM-ESRD, T2DM, and all-cause ESRD
The 67 SNPs that showed evidence of replication between T2DM-ESRD cases and non-nephropathy, non-diabetic controls were genotyped in an additional 1,246 AA T2DM, non-nephropathy cases and 1,216 non-T2DM ESRD cases to differentiate between T2DM-ESRD, T2DM, and all-cause ESRD loci (Table 2; Results shown in Supplemental Table 3). Thus, T2DM-ESRD SNPs should have allele frequency differences when compared with cases with T2DM alone (lacking nephropathy). When the 25 T2DM-ESRD candidate SNPs were compared between T2DM-ESRD cases and T2DM subjects without nephropathy, there were significant differences between these two groups (P values ranging from 0.049 to 2.63×10⁻⁵, Table 4), suggesting that these are T2DM-ESRD loci rather than T2DM loci. SNPs in RPS12 (rs9493454) and AUH (rs7735506) were still strongly associated in this test (P = 8.79×10⁻⁴ and 2.57×10⁻⁴, OR (95% CI) = 1.20 (1.08–1.34) and 0.78 (0.69–0.89), respectively, Table 4).
As a second test, the allele frequencies of these 25 SNPs in T2DM, non-nephropathy subjects were compared with allele frequencies in the normal, non-diabetic, non-nephropathy controls (Table 4; control data from the GWAS and replication control samples). True T2DM loci would be expected to show evidence of association in this analysis. While the four SNPs in the LIMK2-SFI1 region (rs1034589, rs2106294, rs4820043, and rs5749286) showed nominal evidence of association with P values ranging from 0.034 to 0.046 (OR ranging from 0.78 to 0.79, Table 4), these P values are orders of magnitude lower than comparing T2DM-ESRD to controls (Table 3; Combined analysis). This further supports these SNPs as T2DM-ESRD loci and not T2DM loci.
The 25 SNPs were also investigated for association with all-cause ESRD. In this analysis, cases consisted of 1,674 T2DM-ESRD subjects (from the GWAS and replication phases) and 1,216 non-diabetic ESRD subjects (predominantly ESRD attributed to hypertension and chronic glomerular diseases). These 2,890 cases with ESRD were compared to the combined set of non-diabetic, non-nephropathy controls (n=1,719, from the GWAS and replication phases). Five variants in two genomic regions achieved genome-wide significance in this analysis (P ≤ 5.0×10⁻⁸, Table 5). The LIMK2-SFI1 region contained four of these SNPs. First, rs1034589, located in ring finger protein 185 (RNF185), was associated with all-cause ESRD (P = 2.49×10⁻⁸, OR (95% CI) = 0.56 (0.46–0.69), Table 5, Figure 2a). There were two SNPs that showed evidence of association in the LIMK2 gene, rs2106294 and rs4820043 (P = 3.28×10⁻⁸ and 3.04×10⁻⁸, OR (95% CI) = 0.56 (0.46–0.69) and 0.56 (0.46–0.69) respectively, Table 5, Figure 2a). The last SNP that was significantly associated in this region was rs5749286, located in SFI1 (P = 2.96×10⁻¹¹, OR (95% CI) = 0.51 (0.41–0.62), Table 5, Figure 2a). Finally, SNP rs735853, in MYH9 was also significantly associated with all-cause ESRD (P = 4.77×10⁻¹⁰, OR (95% CI) = 0.63 (0.54–0.73), Table 5, Figure 2b). All markers were also examined for association with non-diabetic ESRD compared to controls (Table 5; control data from the GWAS and replication control samples). Twelve markers showed association with non-diabetic ESRD (P values ranging from 0.0364 to 1.97×10⁻¹⁰, OR ranging from 0.38 to 0.86 and 1.15 to 1.31, Table 5). However, all of these variants were more strongly associated in the test of all-cause ESRD (Table 5) and only four of these markers (rs1034589, rs5749286, rs16996381, and rs735853) showed stronger association with non-diabetic ESRD (Table 5) than with diabetic nephropathy (Table 3, Combined analysis).
Table 5. Diabetic Nephropathy Candidate Loci: All-Cause ESRD.
Comparison of All-cause ESRD (1674 T2DM-ESRD cases and 1216 non-T2DM ESRD cases) with controls (combined from GWAS+Replicaiton), and non-T2DM ESRD cases with controls.
OR: Odds Ratio. 95% CI: 95% Confidence Interval. N/A: SNP rs11176482 failed to type in non-T2DM ESRD subjects.
| Locus |
All-Cause ESRD (n=2890) v Controls (n=1719) |
non-T2DM ESRD (n=1216) v Controls (n=1719) |
|||||
|---|---|---|---|---|---|---|---|
| Marker | Chr | Position | Nearest Gene(s) |
Additive P value |
OR (95% CI) | Additive P value |
OR (95% CI) |
| rs10888287 | 1 | 246,184,039 | OR2L13 | 5.53E-05 | 0.84 (0.77–0.91) | 0.0057 | 0.86 (0.78–0.96) |
| rs4260465 | 3 | 164,231,046 | No gene | 0.0027 | 0.88 (0.81–0.96) | 0.4548 | 0.96 (0.87–1.07) |
| rs11730446 | 4 | 96,382,267 | UNC5C | 8.25E-05 | 1.19 (1.09–1.30) | 0.0085 | 1.15 (1.04–1.28) |
| rs891382 | 4 | 147,371,790 | SLC10A7/LSM6 | 2.56E-04 | 1.37 (1.16–1.63) | 0.0859 | 1.20 (0.97–1.48) |
| rs7697691 | 4 | 182,853,951 | No gene | 0.0036 | 0.87 (0.79–0.95) | 0.6059 | 0.97 (0.86–1.09) |
| rs3822908 | 6 | 97,706,333 | C6orf167 | 2.43E-04 | 0.80 (0.71–0.90) | 0.0364 | 0.85 (0.73–0.99) |
| rs7760831 | 6 | 102,071,536 | GRIK2 | 1.62E-06 | 0.77 (0.69–0.86) | 1.43E-04 | 0.77 (0.68–0.88) |
| rs208865 | 6 | 130,114,249 | C6orf191/ARHGAP18 | 2.60E-05 | 1.37 (1.18–1.59) | 0.0025 | 1.31 (1.10–1.56) |
| rs9493454 | 6 | 133,186,322 | RPS12 | 2.35E-05 | 1.21 (1.11–1.32) | 0.2134 | 1.07 (0.96–1.19) |
| rs7769051 | 6 | 133,188,489 | RPS12 | 5.85E-06 | 1.24 (1.13–1.36) | 0.1958 | 1.07 (0.96–1.19) |
| rs6930576 | 6 | 148,746,647 | SASH1 | 4.76E-07 | 1.27 (1.16–1.40) | 4.80E-04 | 1.23 (1.09–1.38) |
| rs773506 | 9 | 93,015,292 | AUH | 1.40E-04 | 0.82 (0.73–0.91) | 0.0901 | 0.89 (0.79–1.02) |
| rs11175885 | 12 | 64,400,897 | C12orf66/TMEM5 | 3.66E-04 | 0.83 (0.75–0.92) | 0.1247 | 0.90 (0.80–1.03) |
| rs2358944 | 12 | 64,403,825 | MSRB3/HMGA2 | 1.15E-04 | 0.82 (0.74–0.90) | 0.1100 | 0.90 (0.79–1.02) |
| rs2904532 | 12 | 65,582,311 | GRIP1/CAND1 | 4.13E-04 | 0.82 (0.73–0.91) | 0.0902 | 0.89 (0.77–1.02) |
| rs11176482 | 12 | 65,582,814 | GRIP1/CAND1 | N/A | N/A | N/A | N/A |
| rs12302041 | 12 | 76,654,356 | NAV3 | 1.87E-04 | 1.40 (1.17–1.67) | 0.0895 | 1.21 (0.97–1.51) |
| rs1978243 | 14 | 86,596,160 | No gene | 6.25E-04 | 0.84 (0.76–0.93) | 0.2588 | 0.93 (0.83–1.05) |
| rs6494387 | 15 | 61,132,579 | TPM1 | 0.0017 | 1.16 (1.06–1.27) | 0.4478 | 1.04 (0.93–1.17) |
| rs1034589 | 22 | 29,909,233 | RNF185 | 2.49E-08 | 0.56 (0.46–0.69) | 2.17E-06 | 0.52 (0.40–0.68) |
| rs2106294 | 22 | 29,975,759 | LIMK2 | 3.28E-08 | 0.56 (0.46–0.69) | 7.15E-06 | 0.54 (0.42–0.71) |
| rs4820043 | 22 | 29,977,094 | LIMK2 | 3.04E-08 | 0.56 (0.46–0.69) | 5.77E-06 | 0.54 (0.41–0.70) |
| rs5749286 | 22 | 30,230,359 | SFI1 | 6.51E-11 | 0.51 (0.41–0.62) | 1.97E-10 | 0.38 (0.28–0.51) |
| rs16996381 | 22 | 34,841,225 | APOL3 | 2.96E-07 | 0.80 (0.73–0.87) | 7.20E-07 | 0.76 (0.69–0.85) |
| rs735853 | 22 | 35,009,161 | MYH9 | 4.77E-10 | 0.63 (0.54–0.73) | 7.76E-10 | 0.55 (0.45–0.66) |
Figure 2. All-cause ESRD candidate regions.


A) LIMK2-SFI1 gene region. B) MYH9 gene region. −log10 PADD values from the GWAS are plotted versus position (genome build 36). The large red diamond indicates the PADD values from the GWAS of the marker(s) displayed. The large blue diamond and corresponding P value indicates the PADD values from the combined analysis of the marker(s) displayed. LD based on the control samples is color-coded: red (r2 to top SNP 0.8–1.0), orange (0.5–0.8), yellow (0.2–0.5), and white (<0.2). Gene annotations were obtained from UCSC Genome Browser (RefSeq Genes, b36). Arrows represent direction of transcription.
The four hits in the LIMK2-SFI1 region are all highly correlated (Supplemental Table 4). SNPs rs1034589 in RNF185, rs2106294 in LIMK2, and rs4820043 also in LIMK2, are all perfectly correlated with one another (r2=1.0, Supplemental Table 4). In addition, these SNPs are all highly correlated with rs5749286 in SFI1 (r2=0.85, Supplemental Table 4). However, the LIMK2-SFI1 region and the MYH9 region are poorly correlated with r2 values ranging from 0.0324 to 0.0335 (Supplemental Table 4).
Tests for Association of Previously Identified Nephropathy Genes
In prior studies (7, 8, 10–12, 18–23), multiple loci have been implicated in different ethnicities with either renal failure or renal function in both diabetics and non-diabetics. We have assessed association with many of these genes (PVT1, FRMD3, CARS, ACACB, NEDD4L, SERPINB7, CNDP1, CNDP2, ELMO1, SHROOM3, UMOD, GATM-SPATA5L1, GCK2, ALMS1, DAB2, SLC34A1, VEGFA, SLC22A2, PRKAG2, STC1, ATXN2, DACH1, SLC7A9) and T2DM-ESRD in our GWAS. For each locus the entire genic region, along with 10kb upstream and downstream of the gene, were inspected for association in the GWAS data to see if other variants in the same gene were associated with T2DM-ESRD in African Americans. All of these results are presented in Supplemental Table 5. While there are some results that are nominally significant, none of the results meet a Bonferroni correction (P = 0.05/1909 total SNPs = 2.6 × 10⁻⁵) with the lowest P value for this analysis being 5.8 × 10⁻⁴ in the NEDD4L gene.
Discussion
We performed a high density genome-wide association study to investigate genetic susceptibility to T2DM-ESRD and all-cause ESRD in African Americans. Previous genome-wide association studies for diabetes associated nephropathy in Japanese (7), Pima Indians (8), and Caucasian Americans (9) have identified several potential DN loci: ELMO1 (7), PVT1 (8), FRMD3, and CARS (9). We have previously seen association with the ELMO1 and MYH9 genes and T2DM-ESRD in our African American population (17, 20). These studies in other ethnicities have used a study design of comparing cases with T2DM-ESRD and controls with T2DM and no nephropathy. While this study design might be appropriate for other ethnicities, it has serious limitations for African Americans. African Americans with T2DM and preserved renal function for 10 years or more (“hypernormal” controls) are perhaps the ideal control group, but are rare (24). We estimate that less than 10% of African American T2DM-affecteds of 10 years duration have preserved renal function. We have chosen a study design that is flexible and support studies of T2DM and BMI in parallel with T2DM-ESRD. Importantly we have used both replication and several contrast groups to differentiate between T2DM-ESRD and T2DM. This system works quite well: the strongest T2DM associated gene in African Americans is TCF7L2, which is easily filtered out of our hits for T2DM-ESRD, but prominently associated with T2DM (25, 26).
We identified five novel gene regions with evidence of association with T2DM-ESRD in African Americans (P < 1.0×10⁻⁵): SASH1, RPS12, AUH, MSRB3-HMGA2, and LIMK2-SFI1. One of these regions, LIMK2-SFI1, was also significantly associated (P < 5.0×10⁻⁸) with all-cause ESRD. MYH9, which has been previously associated with non-diabetic nephropathy (14–16), and diabetic nephropathy (17), also showed significant association (P < 5.0×10⁻⁸) with all-cause ESRD.
SASH1, located at 6q24.3, encodes the sterile α motif (SAM)- and SH3-domain containing 1 protein and is ubiquitously expressed. SASH1 was originally identified as a candidate tumor suppressor gene, being downregulated in the majority (74%) of breast cancer tumors (27), and has been shown to be downregulated in colon cancer (28). SASH1 also functions as a signaling adapter, as a downstream target in the insulin-like growth factor (IGF1)/phosphatidylinositol 3-kinase (PI 3-kinase) signaling pathway (29). SNP rs6930576, located within this gene, showed the strongest association with T2DM-ESRD in the combined analysis, suggesting this gene may also have a role in the progression of diabetic nephropathy.
Two other candidate regions are also worth mentioning. The ribosomal protein S12 gene (RPS12) is located on chromosome 6q23.2. The protein encoded by this gene is located in the cytoplasm and is a component of the 40S ribosomal subunit (30). RPS12 is also a potential target gene of MicroRNA-377 (miRNA-377), which has been consistently up-regulated in in vitro diabetic nephropathy models, as well as in in vivo diabetic nephropathy mouse models (31). If RPS12 is also up-regulated in the diabetic milieu, it may contribute to the progression of diabetic nephropathy.
LIMK2, LIM-kinase 2, is located on chromosome 22 at 22q12.2 (32). There are three isoforms of LIMK2 produced by alternative splicing: variants 1, 2a, and 2b (33). LIMK2 is one of two members of the LIM kinase family, and contains two LIM domains at the N terminus and a protein kinase domain at the C terminus (32). LIMK2 is activated by Rho and Cdc42 via ROCK and PAK respectively; in turn, LIMK2 phosphorylates cofilin, eliminating cofilin’s ability to bind and depolymerize actin. This leads to an accumulation of actin filaments and aggregates. It is through this action that LIMK2 plays a role in the Rho- and Cdc42-induced reorganization of the actin cytoskeleton (34–36). LIMK2 is widely expressed in all tissues (37), showing moderate expression in the kidney (32, 37). Homozygous Limk2 gene-deficient mice (Limk2−/−), created using a Cre-mediated excision to disrupt all three LIMK2 isoforms, exhibited normal growth to adulthood when compared with wild-type and heterozygous mice (38). However, Limk2−/− mice had moderate kidney abnormalities with dilated collecting tubules and slight decreases in the number of glomeruli, without changes in nephron function (38). If variants in LIMK2 lead to kidney abnormalities in humans, this may be detrimental in a diabetic environment, and could possibly lead to the progression of diabetic nephropathy. This would also support LIMK2 as a potential all-cause ESRD candidate locus.
The other gene in the LIMK2 region that showed evidence of association with T2DM-ESRD and all-cause ESRD was SFI1, Sfi1 homolog, spindle assembly associated (yeast). In yeast, SFI1 has been shown to be an essential and conserved component of centrosomes – known as spindle pole bodies in yeast (39). Also, SFI1 was shown to be required for spindle pole body duplication and may be required for separation of the duplicated spindle pole bodies (40).
MYH9, non-muscle myosin heavy chain 9, which showed evidence of association with T2DM-ESRD and all-cause ESRD in our study, has been previously associated with non-T2DM nephropathy (14–16), and diabetic forms of nephropathy (17). It should be noted that the results reported here are in reference to the minor (less frequent) allele, and are associated with protection. This remains consistent with previous associations where the reported risk allele corresponded to the major allele (14–17). In the Yoruba (YRI) samples in HapMap the protective allele for rs735853 is observed in only 3% of chromosomes, while it is seen in over 57% of CEU chromosomes. For our African American sample, the allele frequencies are 0.082 for cases and 0.123 for controls. This result may reflect a selection for the admixed European allele, or more broadly, the European locus, that provides protection in African Americans. Whether this reflects that some cases in our study could be non-diabetic ESRD ((17): recently reestimated to be 13%), or reflects a role for this allele in T2DM-ESRD remains to be determined. Parenthetically, the LIMK2-SFI1 gene region is located approximately 5 Mb away from the MYH9 gene region. We evaluated linkage disequilibrium across chromosome 22 (Supplemental Table 4). The SNPs that showed evidence of association in the LIMK2-SFI1 gene region were poorly correlated (r2 ≤0.03) with the SNP that showed evidence of association in MYH9; suggesting that these are independent signals.
However, MYH9 and LIMK2 are both involved in the reorganization and maintenance of the actin cytoskeleton. MYH9 encodes the nonmuscle myosin heavy chain IIA, which is highly conserved and similar to other nonmuscle myosins (41, 42). Myosin IIA is expressed in the podocytes and mesangial cells (41). Within the podocyte, myosin IIA localizes to the foot process where it is involved in the movement of actin filaments in order to maintain cell structure (43). Many studies have shown that mutations in MYH9 are associated with kidney disease (14–17). As LIMK2 is in the same pathway, it remains possible that mutations in LIMK2 could produce kidney disease; thus, LIMK2 is a strong candidate in T2DM-ESRD and all-cause ESRD.
We did two further assessments of loci in this study. First, we assessed several of the African American loci (13/25) to test whether they contributed to T2DM-ESRD in a sample of Caucasian American cases and controls. We observed no evidence for association in Caucasian Americans (data not shown), but a more comprehensive, better powered experiment might be more definitive. Conversely, we did not observe evidence of association with any of the diabetic nephropathy and chronic kidney disease candidate genes and T2DM-ESRD in African Americans in the current study. The GWAS here did not interrogate some of the specific disease associated SNPs such as ACACB SNP rs2268388 with which we previously reported evidence of association (21). The large number of SNPs evaluated here (over 1900) results in a more stringent threshold for significance. Since these variants were mainly identified in non-African derived racial/ethnic groups, they may play a limited role in the development of T2DM-ESRD in African Americans.
This study has similar limitations as other GWAS. While we have identified 25 variants that may influence T2DM-ESRD in 19 candidate regions, none of these regions have reached genome-wide significance (P < 5.0×10⁻⁸) with the T2DM-ESRD phenotype. However, even though this study has a limited sample size for the GWAS discovery phase, power calculations (Supplemental Table 6) show that we have moderate statistical power to detect odds ratios of 1.3 (MAF=0.35), consistent with previously published effect sizes for DN (FRMD3 and CARS, OR=1.45 and 1.36, respectively (9)). In addition, the other phases of the study: replication, trait discrimination, and all-cause ESRD analysis have excellent power for detecting association given the goals of each step (e.g. nominal association in replication; P value ≤ 1×10⁻⁶ for the all-cause ESRD analysis). There are almost certainly additional loci of moderate effect that have not been captured in this study and loci of weaker effect will require a significantly larger study. There are few other existing collections of appropriate samples in African Americans and we are one of the few centers with active recruiting efforts in this population. This will make the search for additional replication populations more difficult. In addition, it is difficult to ensure that all subjects clinically labeled as having T2DM-ESRD lack other renal lesions. This difficulty plagues all studies of diabetic nephropathy and we chose inclusion criteria similar to other large studies (44).
In conclusion, we performed a GWAS for T2DM-ESRD in African Americans. We then carried out a replication phase, as well as a trait discrimination phase in order to determine whether associations were with T2DM, T2DM-ESRD, and/or all-cause ESRD. Through these studies, we have discovered 25 potential variants in 19 genes associated with T2DM-ESRD including: SASH1, RPS12, AUH, MSRB3-HMGA2, and LIMK2-SFI1. These results require further replication in order to confirm their role in T2DM-ESRD susceptibility and clarify their role in all-cause ESRD in African Americans.
Methods
Subjects
Genome-wide association study (GWAS) samples and clinical characteristics
Recruitment and sample collection procedures were approved by the Institutional Review Board at Wake Forest University and informed consent was obtained from all study participants. Patients with T2DM were recruited from dialysis facilities. Individuals with a history of ketoacidosis, or who developed diabetes prior to the age of 25 years and received continuous insulin therapy since diagnosis were assumed to have type 1 diabetes and were excluded. T2DM was diagnosed in African-Americans who reported developing diabetes after the age of 25 years and who did not receive only insulin therapy since diagnosis. Cases had T2DM diagnosed at least 5 years before initiating renal replacement therapy, background or greater diabetic retinopathy, and/or ≥100 mg/dl proteinuria on urinalysis in the absence of other causes of nephropathy (T2DM-ESRD subjects). Unrelated African American controls without a current diagnosis of diabetes or renal disease were recruited from the community and internal medicine clinics (Control subjects). All cases and non-diabetic, non-nephropathy controls were born in North Carolina, South Carolina, Georgia, Tennessee, or Virginia. DNA extraction was performed using the PureGene system (Gentra Systems, Minneapolis, MN, USA).
Replication study samples and clinical characteristics
Informed consent was obtained from all study participants and recruitment and sample collection procedures were approved by the Institutional Review Board at Wake Forest University. African American T2DM-ESRD cases and non-diabetic, non-nephropathy controls were recruited using the same criteria as the case and control subjects that were used in the GWAS. DNA extraction was performed using the PureGene system.
T2DM, non-nephropathy and non-T2DM ESRD study samples and clinical characteristics
Sample collection procedures and recruitment was approved by the Wake Forest University Institutional Review Board. Informed consent was obtained from all study participants. Subjects with T2DM without evidence of nephropathy were recruited from medical clinics, churches, health fairs, and community resources (T2DM subjects). Patients who had ESRD attributed to hypertension or primary glomerular disease were recruited (non-T2DM ESRD subjects). Putative hypertension-associated ESRD was diagnosed in patients with high blood pressure preceding initiation of renal replacement therapy and low level proteinuria (≤30 mg/dL on urine dipstick, <0.5 gram protein/24 hours on timed urine collection, or urine protein: creatinine ratio <0.5 g/g) or in the absence of measures of proteinuria. Chronic glomerular disease-associated ESRD was diagnosed in non-diabetic subjects with renal biopsy evidence of primary glomerular disease (e.g. focal segmental glomerulosclerosis), proteinuria ≥ 0.5 grams/24 hours or ≥100 mg/dL on urinalysis. Individuals with diabetic nephropathy (as described above), cystic renal diseases, hereditary nephritis, or urologic causes of ESRD were excluded. Individuals were unrelated and self-described African American. All subjects were born in North Carolina, South Carolina, Georgia, Virginia, or Tennessee. The PureGene system was used for DNA extraction.
Sample Preparation, Genotyping and Quality Control
GWAS
Genotyping was performed at the Center for Inherited Disease Research (CIDR) using 1µg of genomic DNA (diluted in 1X TE buffer and at 50ng/µl) on the Affymetrix Genome-wide Human SNP array 6.0 (Affymetrix, Santa Clara, CA, USA). DNA from cases and controls were equally interleaved on 96-well master plates to ensure technical uniformity during sample processing. To confirm sample identity, a SNP barcode (96 SNPs) was generated prior to genotyping on the Affymetrix array and was confirmed on downstream released genotyping data. Genotypes were called using Birdseed version 2; Affymetrix Power Tools (APT) 1.10.0 (Affymetrix, Santa Clara, CA) by grouping samples by DNA plate to determine the genotype cluster boundaries. All autosomal SNPs (n=868,157) were included in analysis but were classified on data quality. The primary inference was drawn from SNPs which had less than 5% missing data, Hardy-Weinberg P values in cases greater than 0.0001 and in controls greater than 0.01, no significant difference in missing data rate between cases and controls and were polymorphic (n=832,357). The average sample call rate was 99.16% for all autosomal SNPs. Forty-six blind duplicates were included in genotyping and had a concordance rate of 99.59%. In addition, individuals whose gender call from X chromosome genotype data was discordant with the gender obtained from patient interviews were excluded from the analysis (n=1). Cryptic relatedness was estimated by pairwise identity-by-descent (IBD) analysis implemented in the PLINK analysis software package (http://pngu.mgh.harvard.edu/purcell/plink/) (45). Two duplicate samples were identified, and one sample in each duplicate pair was removed. In addition, 104 individuals from pairs of samples were identified as cryptic first degree relatives, these individuals were kept for the analysis. We also assessed heterozygosity by estimating the inbreeding coefficient, F, using PLINK. One subject had an F value > 4 standard deviations from the mean, suggesting population substructure. This subject was removed. Our final dataset of consisted of 1994 individuals (965 T2DM-ESRD cases and 1,029 controls) in which we performed association analysis.
Replication
The replication population was recruited under identical ascertainment criteria to that of the GWAS. A total of 724 SNPs were genotyped using the iPLEX™ Sequenom MassARRAY platform (Sequenom, San Diego, CA, USA). Genotyping efficiency was greater than 90% and 45 blind duplicates were included to ensure genotyping accuracy.
Trait Discrimination
Sixty-seven SNPs were genotyped using the iPLEX™ Sequenom MassARRAY platform. Genotyping efficiency was greater than 90%. There were 50 blind duplicates included to ensure genotyping accuracy.
Analysis
GWAS
To address the effect of admixture in this African American dataset we performed a Principal Components Analysis (PCA) which utilized all high quality data from the GWAS and excluded regions of high LD and inversions. This approach is an iterative process whereby high quality autosomal SNPs (n=832,357) are used to calculate the top 50 principal components. Once calculated, the principal components are examined to determine if they are tied to a region of the genome. If so, those SNPs are excluded and the analysis is repeated. The first principal component (PC1) explained the largest proportion of variation at 22%. A direct comparison of the PCA with FRAPPE (Frequenist Estimation of individual ancestry proportion) analysis of 70 ancestry informative markers (AIMs) resulted in a high correlation between PC1 and the AIMs, r2=0.87. Other principal components were associated with regions of the genome, representing another unclassified source of variance, and did not further reduce the inflation factor. The mean (SD) African ancestry proportions in 965 T2DM-ESRD cases and 1,029 controls were 0.80±0.11 and 0.78±0.11, respectively, as estimated by FRAPPE analysis (46). To test for association with T2DM-ESRD, genotypic tests of association were performed on each SNP individually using SNPGWA version 4.0 (www.phs.wfubmc.edu) (47), an analytic package which includes the capability to perform association calculations adjusting for covariates. Genotypic association reported here is for analyses incorporating adjustment for PC1. The primary inference is based on the additive genetic model. The inflation factor was calculated from the observed mean chi-square statistic across high quality autosomal SNPs (n=832,357). Under the null hypothesis, if there is no inflation, the expected mean value is 1. In our population, the inflation factor calculated in the GWAS sample with 104 cryptic related individuals (n=1,994), adjusting for PC1 was 1.06. After 54 subjects were removed to eliminate the cryptic relations (n=1,940), the inflation factor in the GWAS, adjusting for PC1 was 1.04. With this minimal improvement in inflation, all subjects (n=1,994), were retained for analysis since the difference between the inflation factors is only 0.02.
Replication in T2DM-ESRD cases and non-diabetic, non-nephropathy controls
To account for admixture in the replication cohort, ancestral allele frequencies were estimated from the results of the 70 AIMs genotyped in 44 Yoruba Nigerians and 39 European Americans. Individual ancestral proportions were generated for each subject using FRAPPE, an EM algorithm, under a two-population model. The mean (SD) African ancestry proportions in 709 T2DM-ESRD cases and 690 controls were 0.80±0.12 and 0.76±0.13, respectively. Association analysis was performed as described for the GWAS.
Combined analysis of T2DM-ESRD cases and non-diabetic, non-nephropathy controls
The GWAS and replication cohorts were merged as one cohort for a combined analysis. Admixture in the combined cohort was accounted for by using ancestral allele frequencies as described for the replication analysis. Association analysis was performed as described for the GWAS and replication study.
Discrimination between T2DM-ESRD, T2DM, and all-cause ESRD
In order to determine association with T2DM-ESRD, T2DM, and/or all-cause ESRD additional association analyses were performed as described for the GWAS, replication, and combined analysis incorporating the 1,246 T2DM, non-nephropathy subjects and 1,216 non-T2DM ESRD subjects. Admixture was accounted for through ancestral allele frequencies as described in the replication and combined analysis. The mean (SD) African ancestry proportions in 1,246 T2DM, non-nephropathy cases and 1,216 non-T2DM ESRD cases were 0.76±0.13 and 0.79±0.12, respectively.
Supplementary Material
Acknowledgements
We wish to thank the patients, their relatives, and staff of the Southeastern Kidney Council, Inc./ESRD Network 6 for their participation. This work was supported by NIH grants R01 DK066358 (DWB), R01 DK053591 (DWB), R01 HL56266 (BIF), R01 DK070941 (BIF) and in part by the General Clinical Research Center of the Wake Forest University School of Medicine grant M01 RR07122.
Footnotes
Disclosure
The authors report no interests to disclose.
This work was presented in abstract form at the 2009 Annual Meeting of the American Society of Human Genetics, Honolulu, HI, October 20 through 24; at the 2009 Annual Meeting of the American Society of Nephrology, San Diego, CA, October 29 through November 1; and at the 2010 Annual Meeting of the American Diabetes Association, Orlando, FL, June 25 through 29.
References
- 1.USRDS: U.S. Renal Data System 2009. Annual Data Report: Atlas of Chronic Kidney Disease and End-Stage Renal Disease in the United States. Bethesda, MD: National Institutes of Health: National Institute of Diabetes and Digestive and Kidney Diseases; 2009. [Google Scholar]
- 2.Bowden DW. Genetics of kidney disease. Kidney Int Suppl. 2003;83:S8–S12. doi: 10.1046/j.1523-1755.63.s83.3.x. [DOI] [PubMed] [Google Scholar]
- 3.Quinn M, Angelico MC, Warram JH, Krolewski AS. Familial factors determine the development of diabetic nephropathy in patients with IDDM. Diabetologia. 1996;39:940–945. doi: 10.1007/BF00403913. [DOI] [PubMed] [Google Scholar]
- 4.Seaquist ER, Goetz FC, Rich S, Barbosa J. Familial clustering of diabetic kidney disease. Evidence for genetic susceptibility to diabetic nephropathy. N Engl J Med. 1989;320:1161–1165. doi: 10.1056/NEJM198905043201801. [DOI] [PubMed] [Google Scholar]
- 5.Spray BJ, Atassi NG, Tuttle AB, Freedman BI. Familial risk, age at onset, and cause of end-stage renal disease in white Americans. J Am Soc Nephrol. 1995;5:1806–1810. doi: 10.1681/ASN.V5101806. [DOI] [PubMed] [Google Scholar]
- 6.Freedman BI, Tuttle AB, Spray BJ. Familial predisposition to nephropathy in African-Americans with non-insulin-dependent diabetes mellitus. Am J Kidney Dis. 1995;25:710–713. doi: 10.1016/0272-6386(95)90546-4. [DOI] [PubMed] [Google Scholar]
- 7.Shimazaki A, Kawamura Y, Kanazawa A, Sekine A, et al. Genetic variations in the gene encoding ELMO1 are associated with susceptibility to diabetic nephropathy. Diabetes. 2005;54:1171–1178. doi: 10.2337/diabetes.54.4.1171. [DOI] [PubMed] [Google Scholar]
- 8.Hanson RL, Craig DW, Millis MP, Yeatts KA, et al. Identification of PVT1 as a candidate gene for end-stage renal disease in type 2 diabetes using a pooling-based genome-wide single nucleotide polymorphism association study. Diabetes. 2007;56:975–983. doi: 10.2337/db06-1072. [DOI] [PubMed] [Google Scholar]
- 9.Pezzolesi MG, Poznik GD, Mychaleckyj JC, Paterson AD, et al. Genome-wide association scan for diabetic nephropathy susceptibility genes in type 1 diabetes. Diabetes. 2009;58:1403–1410. doi: 10.2337/db08-1514. [DOI] [PMC free article] [PubMed] [Google Scholar]
- 10.Kottgen A, Glazer NL, Dehghan A, Hwang SJ, et al. Multiple loci associated with indices of renal function and chronic kidney disease. Nat Genet. 2009 doi: 10.1038/ng.377. [DOI] [PMC free article] [PubMed] [Google Scholar]
- 11.Kottgen A, Pattaro C, Boger CA, Fuchsberger C, et al. New loci associated with kidney function and chronic kidney disease. Nat Genet. 2010;42:376–384. doi: 10.1038/ng.568. [DOI] [PMC free article] [PubMed] [Google Scholar]
- 12.Chambers JC, Zhang W, Lord GM, van der Harst P, et al. Genetic loci influencing kidney function and chronic kidney disease. Nat Genet. 2010;42:373–375. doi: 10.1038/ng.566. [DOI] [PMC free article] [PubMed] [Google Scholar]
- 13.CDC: National Diabetes Fact Sheet: general information and national estimates on diabetes in the United States, 2007. U.S. Department of Health and Human Services. Atlanta, GA: CDC; 2008. [Google Scholar]
- 14.Kopp JB, Smith MW, Nelson GW, Johnson RC, et al. MYH9 is a major-effect risk gene for focal segmental glomerulosclerosis. Nat Genet. 2008;40:1175–1184. doi: 10.1038/ng.226. [DOI] [PMC free article] [PubMed] [Google Scholar]
- 15.Kao WH, Klag MJ, Meoni LA, Reich D, et al. MYH9 is associated with nondiabetic end-stage renal disease in African Americans. Nat Genet. 2008;40:1185–1192. doi: 10.1038/ng.232. [DOI] [PMC free article] [PubMed] [Google Scholar]
- 16.Freedman BI, Hicks PJ, Bostrom MA, Cunningham ME, et al. Polymorphisms in the non-muscle myosin heavy chain 9 gene (MYH9) are strongly associated with end-stage renal disease historically attributed to hypertension in African Americans. Kidney Int. 2009;75:736–745. doi: 10.1038/ki.2008.701. [DOI] [PMC free article] [PubMed] [Google Scholar]
- 17.Freedman BI, Hicks PJ, Bostrom MA, Comeau ME, et al. Non-muscle myosin heavy chain 9 gene MYH9 associations in African Americans with clinically diagnosed type 2 diabetes mellitus-associated ESRD. Nephrol Dial Transplant. 2009;24:3366–3371. doi: 10.1093/ndt/gfp316. [DOI] [PMC free article] [PubMed] [Google Scholar]
- 18.Freedman BI, Hicks PJ, Sale MM, Pierson ED, et al. A leucine repeat in the carnosinase gene CNDP1 is associated with diabetic end-stage renal disease in European Americans. Nephrol Dial Transplant. 2007;22:1131–1135. doi: 10.1093/ndt/gfl717. [DOI] [PubMed] [Google Scholar]
- 19.Janssen B, Hohenadel D, Brinkkoetter P, Peters V, et al. Carnosine as a protective factor in diabetic nephropathy: association with a leucine repeat of the carnosinase gene CNDP1. Diabetes. 2005;54:2320–2327. doi: 10.2337/diabetes.54.8.2320. [DOI] [PubMed] [Google Scholar]
- 20.Leak TS, Perlegas PS, Smith SG, Keene KL, et al. Variants in intron 13 of the ELMO1 gene are associated with diabetic nephropathy in African Americans. Ann Hum Genet. 2009;73:152–159. doi: 10.1111/j.1469-1809.2008.00498.x. [DOI] [PMC free article] [PubMed] [Google Scholar]
- 21.Maeda S, Kobayashi M, Araki S, Babazono T, et al. A Single Nucleotide Polymorphism within the Acetyl-Coenzyme A Carboxylase Beta Gene Is Associated with Proteinuria in Patients with Type 2 Diabetes. Plos Genetics. 2010;6 doi: 10.1371/journal.pgen.1000842. [DOI] [PMC free article] [PubMed] [Google Scholar]
- 22.McDonough CW, Bostrom MA, Lu L, Hicks PJ, et al. Genetic analysis of diabetic nephropathy on chromosome 18 in African Americans: linkage analysis and dense SNP mapping. Hum Genet. 2009;126:805–817. doi: 10.1007/s00439-009-0732-8. [DOI] [PMC free article] [PubMed] [Google Scholar]
- 23.McDonough CW, Hicks PJ, Lu L, Langefeld CD, et al. The influence of carnosinase gene polymorphisms on diabetic nephropathy risk in African-Americans. Hum Genet. 2009;126:265–275. doi: 10.1007/s00439-009-0667-0. [DOI] [PMC free article] [PubMed] [Google Scholar]
- 24.Gitter J, Langefeld CD, Rich SS, Pedley CF, et al. Prevalence of nephropathy in black patients with type 2 diabetes mellitus. Am J Nephrol. 2002;22:35–41. doi: 10.1159/000046672. [DOI] [PubMed] [Google Scholar]
- 25.Lewis JP, Palmer ND, Hicks PJ, Sale MM, et al. Association analysis in african americans of European-derived type 2 diabetes single nucleotide polymorphisms from whole-genome association studies. Diabetes. 2008;57:2220–2225. doi: 10.2337/db07-1319. [DOI] [PMC free article] [PubMed] [Google Scholar]
- 26.Sale MM, Smith SG, Mychaleckyj JC, Keene KL, et al. Variants of the transcription factor 7-like 2 (TCF7L2) gene are associated with type 2 diabetes in an African-American population enriched for nephropathy. Diabetes. 2007;56:2638–2642. doi: 10.2337/db07-0012. [DOI] [PubMed] [Google Scholar]
- 27.Zeller C, Hinzmann B, Seitz S, Prokoph H, et al. SASH1: a candidate tumor suppressor gene on chromosome 6q24.3 is downregulated in breast cancer. Oncogene. 2003;22:2972–2983. doi: 10.1038/sj.onc.1206474. [DOI] [PubMed] [Google Scholar]
- 28.Rimkus C, Martini M, Friederichs J, Rosenberg R, et al. Prognostic significance of downregulated expression of the candidate tumour suppressor gene SASH1 in colon cancer. Br J Cancer. 2006;95:1419–1423. doi: 10.1038/sj.bjc.6603452. [DOI] [PMC free article] [PubMed] [Google Scholar]
- 29.Dubois F, Vandermoere F, Gernez A, Murphy J, et al. Differential 14-3-3 affinity capture reveals new downstream targets of phosphatidylinositol 3-kinase signaling. Mol Cell Proteomics. 2009;8:2487–2499. doi: 10.1074/mcp.M800544-MCP200. [DOI] [PMC free article] [PubMed] [Google Scholar]
- 30.Yu Y, Ji H, Doudna JA, Leary JA. Mass spectrometric analysis of the human 40S ribosomal subunit: native and HCV IRES-bound complexes. Protein Sci. 2005;14:1438–1446. doi: 10.1110/ps.041293005. [DOI] [PMC free article] [PubMed] [Google Scholar]
- 31.Wang Q, Wang Y, Minto AW, Wang J, et al. MicroRNA-377 is up-regulated and can lead to increased fibronectin production in diabetic nephropathy. FASEB J. 2008;22:4126–4135. doi: 10.1096/fj.08-112326. [DOI] [PMC free article] [PubMed] [Google Scholar]
- 32.Okano I, Hiraoka J, Otera H, Nunoue K, et al. Identification and characterization of a novel family of serine/threonine kinases containing two N-terminal LIM motifs. J Biol Chem. 1995;270:31321–31330. doi: 10.1074/jbc.270.52.31321. [DOI] [PubMed] [Google Scholar]
- 33.Scott RW, Olson MF. LIM kinases: function, regulation and association with human disease. J Mol Med. 2007;85:555–568. doi: 10.1007/s00109-007-0165-6. [DOI] [PubMed] [Google Scholar]
- 34.Sumi T, Matsumoto K, Takai Y, Nakamura T. Cofilin phosphorylation and actin cytoskeletal dynamics regulated by rho- and Cdc42-activated LIM-kinase 2. J Cell Biol. 1999;147:1519–1532. doi: 10.1083/jcb.147.7.1519. [DOI] [PMC free article] [PubMed] [Google Scholar]
- 35.Edwards DC, Sanders LC, Bokoch GM, Gill GN. Activation of LIM-kinase by Pak1 couples Rac/Cdc42 GTPase signalling to actin cytoskeletal dynamics. Nat Cell Biol. 1999;1:253–259. doi: 10.1038/12963. [DOI] [PubMed] [Google Scholar]
- 36.Ohashi K, Nagata K, Maekawa M, Ishizaki T, et al. Rho-associated kinase ROCK activates LIM-kinase 1 by phosphorylation at threonine 508 within the activation loop. J Biol Chem. 2000;275:3577–3582. doi: 10.1074/jbc.275.5.3577. [DOI] [PubMed] [Google Scholar]
- 37.Acevedo K, Moussi N, Li R, Soo P, et al. LIM kinase 2 is widely expressed in all tissues. J Histochem Cytochem. 2006;54:487–501. doi: 10.1369/jhc.5C6813.2006. [DOI] [PubMed] [Google Scholar]
- 38.Takahashi H, Koshimizu U, Miyazaki J, Nakamura T. Impaired spermatogenic ability of testicular germ cells in mice deficient in the LIM-kinase 2 gene. Dev Biol. 2002;241:259–272. doi: 10.1006/dbio.2001.0512. [DOI] [PubMed] [Google Scholar]
- 39.Kilmartin JV. Sfi1p has conserved centrin-binding sites and an essential function in budding yeast spindle pole body duplication. J Cell Biol. 2003;162:1211–1221. doi: 10.1083/jcb.200307064. [DOI] [PMC free article] [PubMed] [Google Scholar]
- 40.Anderson VE, Prudden J, Prochnik S, Giddings TH, Jr, et al. Novel sfi1 alleles uncover additional functions for Sfi1p in bipolar spindle assembly and function. Mol Biol Cell. 2007;18:2047–2056. doi: 10.1091/mbc.E06-10-0918. [DOI] [PMC free article] [PubMed] [Google Scholar]
- 41.Arrondel C, Vodovar N, Knebelmann B, Grunfeld JP, et al. Expression of the nonmuscle myosin heavy chain IIA in the human kidney and screening for MYH9 mutations in Epstein and Fechtner syndromes. J Am Soc Nephrol. 2002;13:65–74. doi: 10.1681/ASN.V13165. [DOI] [PubMed] [Google Scholar]
- 42.D'Apolito M, Guarnieri V, Boncristiano M, Zelante L, et al. Cloning of the murine non-muscle myosin heavy chain IIA gene ortholog of human MYH9 responsible for May-Hegglin, Sebastian, Fechtner, and Epstein syndromes. Gene. 2002;286:215–222. doi: 10.1016/s0378-1119(02)00455-9. [DOI] [PubMed] [Google Scholar]
- 43.Faul C, Asanuma K, Yanagida-Asanuma E, Kim K, et al. Actin up: regulation of podocyte structure and function by components of the actin cytoskeleton. Trends Cell Biol. 2007;17:428–437. doi: 10.1016/j.tcb.2007.06.006. [DOI] [PubMed] [Google Scholar]
- 44.Knowler WC, Coresh J, Elston RC, Freedman BI, et al. The Family Investigation of Nephropathy and Diabetes (FIND): design and methods. J Diabetes Complications. 2005;19:1–9. doi: 10.1016/j.jdiacomp.2003.12.007. [DOI] [PubMed] [Google Scholar]
- 45.Purcell S, Neale B, Todd-Brown K, Thomas L, et al. PLINK: a tool set for whole-genome association and population-based linkage analyses. Am J Hum Genet. 2007;81:559–575. doi: 10.1086/519795. [DOI] [PMC free article] [PubMed] [Google Scholar]
- 46.Tang H, Peng J, Wang P, Risch NJ. Estimation of individual admixture: analytical and study design considerations. Genet Epidemiol. 2005;28:289–301. doi: 10.1002/gepi.20064. [DOI] [PubMed] [Google Scholar]
- 47.Harley JB, Alarcon-Riquelme ME, Criswell LA, Jacob CO, et al. Genome-wide association scan in women with systemic lupus erythematosus identifies susceptibility variants in ITGAM, PXK, KIAA1542 and other loci. Nat Genet. 2008;40:204–210. doi: 10.1038/ng.81. [DOI] [PMC free article] [PubMed] [Google Scholar]
Associated Data
This section collects any data citations, data availability statements, or supplementary materials included in this article.