Abstract
Intracellular signaling pathways that regulate the production of lethal proteins in central neurons are not fully characterized. Previously, we reported induction of a novel neuronal protein neuronal pentraxin 1 (NP1) in neonatal brain injury following hypoxia-ischemia (HI); however, how NP1 is induced in hypoxic-ischemic neuronal death remains elusive. Here, we have elucidated the intracellular signaling regulation of NP1 induction in neuronal death. Primary cortical neurons showed a hypoxic-ischemia time-dependent increase in cell death and that NP1 induction preceded the actual neuronal death. NP1 gene silencing by NP1-specific siRNA significantly reduced neuronal death. The specificity of NP1 induction in neuronal death was further confirmed by using NP1 (−/−) null primary cortical neurons. Declines in phospho-Akt (i.e. deactivation) were observed concurrent with decreased phosphorylation of its downstream substrate GSK-3α/β (at Ser21/Ser9)(i.e. activation) and increased GSK-3α and GSK-3β kinase activities, which occurred prior to NP1 induction. Expression of a dominant-negative inhibitor of Akt (Akt-kd) blocked phosphorylation of GSK-3α/β and subsequently enhanced NP1 induction. Whereas, overexpression of constitutively activated Akt (Akt-myr) or wild-type Akt (wtAkt) increased GSK-α/β phosphorylation and attenuated NP1 induction. Transfection of neurons with GSK-3α siRNA completely blocked NP1 induction and cell death. Similarly, overexpression of the GSK-3β inhibitor Frat1 or the kinase mutant GSK-3βKM, but not the wild-type GSK-3βWT, blocked NP1 induction and rescued neurons from death. Our findings clearly implicate both GSK-3α and GSK-3β dependent mechanism of NP1 induction and point to a novel mechanism in the regulation of hypoxic-ischemic neuronal death.
Keywords: Neuronal pentraxin 1, hypoxic -ischemic neuronal injury, neonatal brain injury, neuroprotection, glycogen synthase kinase 3α/β, Akt
Introduction
Cerebral hypoxic-ischemia during the pre/perinatal period is the single most important cause of acute mortality, chronic neurological disabilities and intellectual impairment in the surviving infants and children [1–5]. The mechanism(s) involved in the pathogenesis of hypoxic-ischemic brain injury remain inadequately understood, precluding the development of effective therapies. Several studies have emphasized that cell death mechanism requires de novo synthesis of both RNA and lethal proteins [6, 7], and that intracellular signaling pathways andtranscription factors are ideally placed to mediate protein synthesis-dependent processes [8]. However, the cellular signaling pathways that regulate the production of lethal proteins in degenerating neurons are not completely understood. Previously, we reported the induction of a novel neuronal protein neuronal pentraxin 1 (NP1) in central neurons in hypoxic-ischemic brain injury [9]. This indicates that the cellular mechanism(s) that induce NP1 might play an important role in neuronal cell death. However, the mechanism of cellular regulation of NP1 expression is still remains unknown.
NP1 is exclusively express in central neurons [10–13]. Members of this family include neuronal activity regulated pentraxin (Narp) (also called NP2) and neuronal pentraxin receptor (NPR). NP1and Narp are 54% identical [12], and share similar structural features including a ~200 amino acid unique N-terminal coiled-coil domain that is likely to mediate self aggregation and a single C-terminal pentraxin domain required for axonal transport and secretion [10, 13–15]. The long pentraxins have several characteristics that might play a role in promoting excitatory synapse formation and remodeling [10, 16, 17]. We propose, based on our previous findings [9], that NP1 is part of the molecular cascade of neuronal death program participating in hypoxic-ischemic neuronal death.
The glycogen synthase kinase-3 (GSK-3), a serine/threonine protein kinase, has been implicated as an important factor contributing to neuronal cell death induced by ischemia [18, 19] and excitotoxicity [20, 21]. GSK-3 exists as two structurally different isoforms α (51 kDa) and β (47kDa) [22], which is a dual specificity kinase that can be both activated or inhibited [23, 24]. GSK-3α/β in its unphosphorylated form is active and promotes neuronal death, whereas, phosphorylation at serine21 of the α- and serine9 of β-subunit by protein kinse B (Akt/PKB) or by cAMP-dependent protein kinase A (PKA) renders the GSK-3α/β inactive [25–29]. Since, both PI3-K/Akt and PKA signaling pathways are neuroprotective and negatively regulate GSK-3 activity, GSK-3 may be an important downstream proapoptotic target involves in NP1 induction that contributes to neuronal death. However, the majority of previous studies have implicated GSK-3β function only in cell death [26–29]. Enguita et al (2005) have reported that K+ deprived apoptotic cell death is linked to GSK-3β activity and NP1 overexpression [30]. However, the specific involvement of GSK-3α and/or GSK-3β function, and their relative role in NP1 expression underlying the hypoxia-ischemia elicited cell death remain unclear. In the present study, we have elucidated the intracellular signaling regulation of NP1 expression in cultured primary cortical neurons following hypoxia under glucose deprived conditions and directly demonstrated the link between NP1 induction and neuronal death in using NP1−/− vs. wildtype mouse cortical neurons. We particularly focused on the role of GSK-3α and/or GSK-3β isoform-specific signaling pathway to search for the differential roles for both isoforms, known to be associated with proapoptotic cell death mechanisms [18, 19, 31], in regulating NP1 induction in neuronal death. Our findings identify both GSK-3α- and β-dependent cellular signaling mechanisms of NP1 induction in neuronal death and point to a novel regulatory mechanism by which neuronal death can be prevented.
Materials and methods
Embryonic cortical neuronal culture
Primary cortical neuronal cultures were prepared from embryonic day 16 (E16) F344 rats (National Cancer Institute, MD) as described previously [9]. NP1-knockout mice are provided by Dr. Paul Worley, Dept. of Neuroscience, School of medicine, JHU. Primary cortical neurons were grown in a culture medium consisting of Neurobasal™ medium (Invitrogen), 2% B27 supplement (Invitrogen), 2-mM L-glutamine, and 1% penicillin-streptomycin as described [9]. At 3 day in vitro (DIV), one-third of the media were replaced with fresh medium (without L-glutamine) containing cytosine arabinofuranoside (AraC, 5 μM; Sigma) to arrest the growth of non-neuronal cells. Experiments were conducted at DIV 8–10, when cultures consisted primarily of neurons (>95% MAP-2 immunoreactive cells) (MAP-2; Chemicon, Temecula, CA).
Induction of hypoxia-ischemia, modeled in vitro, in cultured primary cortical neurons
To induce hypoxic-ischemic conditions, cultured cells at DIV 8 were placed in a glucose-free medium (Neurobasal™ without glucose; Invitrogen) for at least 1–2 h and exposed to humidified 95% N2/5% CO2 using anaerobic modular incubator chambers (Billups-Rothenberg, Del Mar, CA) as described previously [32]. This medium contains B27 supplement minus anti- oxidant (Invitrogen), which otherwise may interfere with oxidative stress, toxicity, apoptosis and free-radical damage to neurons. After indicated period of hypoxia, cells were washed with ice-cold PBS and harvested to examine various biochemical end points.
Assessment of cell viability/toxicity
Immediately after the indicated periods of exposure, cell viability and cell death were determined by independent and complementary methods as described previously [9, 33].
MTT assay
Mitochondrial dehydrogenase activity cleaves 3-(4,5-dimethylthiazol-2-yl)-2,5-diphenyl tetrazolium bromide (MTT; Sigma) and is a biochemical index for cellular viability. A quantitative colorimetric assay of MTT [21] used to determine cell survival as described previously [9, 34]. The results were expressed as a percentage of control culture viability.
LDH assay
Lactate dehydrogenase (LDH) activity released in the media after hypoxic exposure was measured using the CytoTox96 Non-radioactive Cytotoxicity Assay kit (Promega, Madison, WI) as described previously [9, 33]. Percent cell death was determined using the formula: % cytotoxicity = hypoxic LDH release (OD490)/maximum LDH release (OD490) after correcting for baseline absorbance of LDH release at 490 nm.
TUNEL staining
The DeadEnd Fluorometric TUNEL System (Promega) was used to detect cell death in cultured cerebellar granule neurons exposed to hypoxia (10–12 h) as described previously [35]. Fluorescein fluorescence was visualized in a fluorescence microscope (Carl Zeiss Axioplan 1) with an excitation at 485 nm and an emission at 535 nm. DAPI fluorescence (blue) was visualized with an excitation and emission filters at 365 nm and 450 nm, respectively.
Comet assay
Comet assays were conducted to assess DNA damage in cortical neurons exposed to hypoxic-ischemic conditions. DNA fragmentation was monitored by monitoring DNA integrity with SYBR green staining using a CometAssay Kit for single cell gel electrophoresis (Trevigen, Inc., Gaithresburg, MD USA; Catalog # 4250-050-K) according to manufacturers’ instructions as described by Wang et al (2004) [36]. Briefly, control and hypoxia-exposed neurons were washed with ice-cold PBS and harvested by centrifugation at 720 × g for 10 min. After re-suspending at 1 × 10⁵ cells/ml in ice cold PBS (Ca2+ and Mg2+-free), the cells were combined with 1% low melting point agarose in PBS (37°C) in a ratio of 1:10 (v/v) and immediately pipetted 75 μl onto the CometSlide. The samples were then placed flat at 4°C in the dark for 30 min to enhance the attachment. After being lysed in a lysis buffer, samples were washed with 1 × TBS and then transferred and electrophoresed for 15 min in a horizontal electrophoresis apparatus. The samples were fixed in ethanol and stained with SYBR Green. Comet slides were visualized under fluorescence microscope at excitation/emission of 494/521 nm, respectively. Cells with intact DNA has compact circular staining, whereas cell with damage DNA have bright tails that resembles comets. We observed that a significant portion of cells exhibited DNA damage after 6–8 h of exposure.
Immunofluorescence analysis
For immunofluorescence analysis, cells were incubated with mouse anti-rat monoclonal NP1 antibody (1:250, Transduction Laboratories, Tamecula, CA), washed 3 × with PBS and incubated with FITC-conjugated goat anti-mouse secondary antibody (1:500) (Jackson Immunochemicals, West Grove, PA) and 4,6-diamino-2-phenylindole (DAPI; that stains nuclei) for 1 h at RT as described previously [9]. For negative controls appropriate non-immune IgG was used instead of primary antibody. Immunofluorescence was visualized using a fluorescence microscope (Carl Zeiss Axiplan 1 fitted with Axiovision 3.0 software) as described [9, 33].
Transient transfection of primary cortical neurons
Primary cortical neurons were isolated from E16 embryonic rat brain cerebral cortex and transfected by nucleofection system using Rat Neuron Nucleofector kit (Amaxa, Inc., Cat No. VPG-1003) as described previously [33]. Primary neuronal cells in a suspension containing 12 × 106 cells were mixed with 1–2 μg of either control CMV or with a kinase-inactive dominant-negative form of Akt (Akt-kd), wild-type Akt (wtAkt), constitutively active Akt (Akt-myr) (kindly provided by Dr. M.E. Greenberg, Harvard Medical School, Boston, MA) [37]. All forms of Akt were tagged with a hemagglutinin A (HA) epitope. For inhibition of GSK-3β experiments, cells were nucleofected with either control CMV6 vector DNA (2 μg) or with Frat1, GSK-3β WT (wild type) or GSK-3β KM (kinase mutant) vector DNA (kindly provided by Dr. Robert Freeman, University of Rochester School of Medicine, Rochester, NY) [27]. Following nucleofection, cells were seeded at a density of 2.5 × 10⁵ cells per cm2 area. We have achieved >65% transfection efficiencies in primary cortical cultures as determined by GFP expression [33].
Short interference RNA directed against NP1 mRNA
We generated siRNA constructs directed against rat NP1 target sequences corresponding to nucleotides of 460-478 (5′-AATTCTTCCAGCCAAACCAAC-3′) (construct #3) and nucleotides 574–592 (5-AAGAACGACACAGAGGAAAGG-3′) (construct #5) of NP1 mRNA and the corresponding control scramble siRNA (SsiRNA) using Silencer™ siRNA construction kit (Cat # 1620) (Ambion, Inc. Austin, TX). The ODN sequences exhibited no similarity to any other known mammalian genes as determined by BLAST.
Commercially available control scramble siRNA and GSK-3α-specific siRNA (Cell Signaling Technology, Baverly, MA Cat #6312) were transfected (~100 nM) into cells using LipofectAMINE RNAiMAx (Invitrogen) as described previously [33]. Experimental treatments were initiated ~ 48 h after transfection. Using siRNA specific for NP1 and GSK-3 α, we have achieved >90%reduction in NP1 and GSK -3α protein levels compared to control siRNA.
Generation of lentivirus constructs for in vitrotransduction
Lentivirus production and infection were performed following procedures described by Janas et al (2006) [38] using a ViraPower Lentiviral expression system (Invitrogen) according to manufacturer s instruction. In briefly, the pLenti6V5-NP1 was generated by co-transfection with four plasmids including Rev gene (Rev), vesicular stomatitis virus G-protein (VSV-G) and self-inactivating (SIN) plasmids into HEK293FT cells by Lipofectamine LTX Reagent, and removed the medium 6h-post-transfection. The conditioned media were harvested 72h-post-transfection, then filtered at a 0.45 μm pore size, and ultra-centrifuged at 120,000 × g at 4°C for 3 hrs. The pellet was re-suspended in 100 μl of PBS. Mouse primary cortical neurons were cultured for 7 days followed by infection with lentiviral vector at 2 MOI. The medium was replaced with conditioned medium 8h-post-infection, and the cells (NP1-V5) were assayed 72h-post-infection.
SDS-PAGE and Western blot analyses
SDS-PAGE and immunoblottings were performed according to the method of Laemmli [39] as described previously [34]. Total cellular proteins (20 μg) were electrophoretically resolved on a 4–20% gradient PAGEr Gold Tris-Glycine precast gel (Cambrex Bio Science, Rockland, ME) at 130 V for 1 h, and immunoblotted with specific antibody to NP1 (BD Transduction Laboratories), Akt and phospho-Akt (Ser 473) (Cell Signaling; Cat #9272 and at #9271, respectively) or total and phospho-GSK-3α/β (Cell Signaling, Cat #9331and #93932). Blots were washed and incubated with horseradish peroxidase (HRP)-conjugated secondary antibodies (Jackson Immonoresearch Laboratories) at 1:1,000 dilutions for 1 h at RT. Specific bands were visualized by enhanced chemiluminescence using an ECL western blotting detection kit (Amersham-Pharmacia). Digitized images were quantified by densitometry (Molecular Dynamics).
GSK -3α and GSK-3β kinase activity assay
The GSK-3α and GSK-3β activity was measured by using the PKLight® HTS protein kinase assay kit according to the manufacturer’ s instructions (Cambrex Bio Science Rockland, Rockland, ME; Cat No. LT07-500). PKLight® assay exploits kinases’ intrinsic ATPase activity resulting in the cleavage of the γ-phosphate from ATP and requires a relatively pure kinase. For this assay we employed the immunoprecipitation technique to completely immunoprecipitate GSK-3α or GSK-3β from whole cell extracts. Briefly, cells were lysed in immunoprecipitation lysis buffer (20 mM Tris-Hcl, pH 7.4, 0.1% Triton X-100, 150 mM NaCl, 1 mM EDTA, 1 mM EGTA) containing phosphatase inhibitors (1 mM Sodium vanadate, 2 mM sodium pyrophosphate and 1 mM sodium β-glycerophosphate) and 1 × Protease inhibitor cocktail (Calbiochem, La Jolla, CA) as described previously [9]. Protein concentrations was determined using the Bradford protein assay reagent according to the manufacturer’s instructions. One hundred micrograms of total proteins were incubated with either 1 μg of GSK-3α (Cell Signaling) or GSK-3β (BD Biosciences) specific primary antibody at 4°C. After 2 h, 30 μl of Protein A/G agarose conjugated beads (Santa Cruz) was added to each sample in a volume of 500 μl and then incubated overnight with constant shaking at 4°C. Negative controls were performed under identical conditions by incubating with equal amount of non-immune IgG instead of primary antibody. Immunoprecipitates were collected by centrifugation (1,000 × g for 5 min), and washed twice with lysis buffer. Kinase activity was assayed by adding 40 μl of kinase assay buffer (25 mM sodium glycerophosphate, 20 mM Tris-HCl, pH 7.4, 10 mM MgCl2, 5 mM dithiotheritol) containing 100 μM GSK-3 peptide substrate (Biomol, Cat No. P-151), 1–3 μM ATP to each sample and was incubated at 30°C for 30 min. The GSK-3 inhibitor LiCl (20 mM) was added in vitro to a set of samples to confirm that phosphorylation was mediated by GSK-3α or GSK-3β isoforms. Ten microliters of kinase stop solution (PKLight kit) was added to each sample and incubated for 10 min at RT to stop further kinase activity. Twenty microliters of reconstituted ATP-DR (detection reagent) from the assay kit were added to each samples and further incubated at RT for 10 min to measure remaining ATP present after kinase activity. Control for ATP was prepared by excluding the immunoprecipitated protein from the reaction mixtures. The bioluminescent signal is inversely proportional to the kinase activity. Luminescence was measured as relative light units (RLU) and results were expressed as a percentage of controls.
Statistical analysis
We used analysis of variance StatView 5.0 software program (SAS Institute, Inc. Cary, NC, USA) for statistical comparisons involving multiple groups, followed by Bonferroni/Dunn post-hoc test to determine significance (p<0.05).
Results
Induction of NP1 andhypoxic-ischemic neuronal death in primary cortical neurons
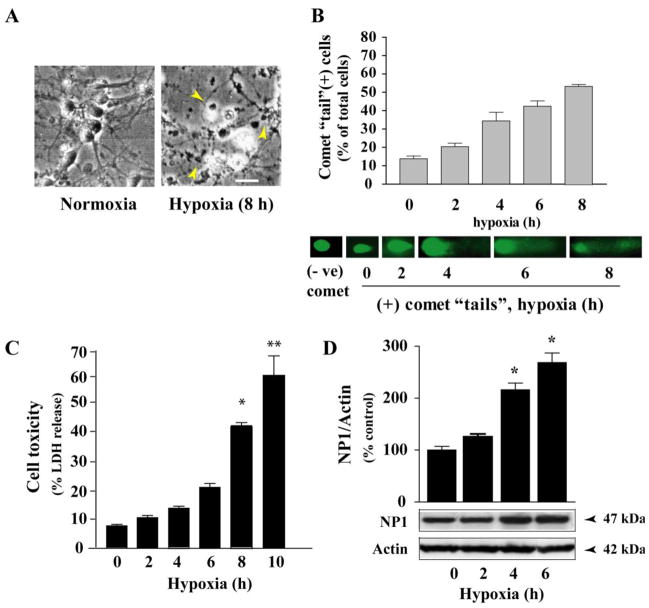
Primary neuronal cultures provide an excellent model for investigating the molecular and intracellular signaling events that regulate cell death and survival [6, 37]. We used an established model of primary cortical cultures to study cellular mechanisms of neurotoxicity triggered following hypoxic-ischemic exposure (Fig. 1) [9]. Cortical neurons cultured for 8 days in vitro (DIV 8) were placed in glucose-free neurobasal medium containing B27 minus antioxidant for at least 1–2 h before exposure to hypoxia (0–10 h). Light microscopic analysis showed characteristic morphological changes of dying cells at 8–10 h of exposure; which were round, smaller and translucent with disintegration of processes and cell bodies compared to control normoxic neurons (Fig. 1A). Control cells were healthy and retained normal morphology, as indicated by larger size, phase brightness and intact processes. To explore the potential mechanism by which neuronal death occurred, we monitored DNA damage as a measure of cell death after hypoxic-ischemic exposure. DNA fragmentation was monitored by comet assay using CometAssay Kit for single cell gel electrophoresis (Trevigen, Inc.,) (Fig. 1B). Comet assay detects DNA fragmentation after electrophoresis of cells, and monitoring DNA integrity by SYBR Green staining [36]. Cells with intact DNA have compact circular staining, whereas cells with DNA damage have bright tail resemble comets. By comet assay, hypoxic-ischemic exposure elicits DNA damage by 2–4 h of exposure and continues to increase up to 8 h of exposure examined (Fig. 1B) indicating DNA damage. Comet tails were almost absent over 10 h of exposure (not shown), consistent with the death of cortical neurons.
Fig. 1.
Hypoxic-ischemic exposure of primary cortical neurons resulted NP1 induction and substantial neuronal death. A) Morphological evidence of injury and death in cortical neurons after 10 h of hypoxic-ischemic exposure. Scale bar 20 μm. B) Hypoxic-ischemic time- dependent DNA damage in primary cortical neurons. Representative images from the comet assay are shown. ‘Tails’ can be observed at 2 h of exposure and continues to increase upto 8 h due to the difference in mobility of denatured cleaved DNA fragments, indicating DNA damage. C) Total cellular proteins (20 μg/lane) were analyzed by SDS-PAGE and immunoblotted for NP1 protein. Chemiluminescent detection showed an intense NP1 immunoreactive protein band at ~47 kDa and bands were quantified by densitometry and normalized to actin (mean ± SEM, n=4; *p<0.01). D) Quantification of cell death by LDH release revealed cell death with ~30–40% cell death occurring at 6–8 h of exposure. Data is expressed as percent LDH release from control normoxic cells (mean ± SEM, n=8; *p<0.05, **p<0.01).
Quantification of neuronal cell death under similar conditions by LDH release cytotoxicity assay showed a hypoxic-ischemic time-dependent increase in cell death with ~40% (P<0.01) cell death occurred at 8 h of exposure (Fig. 1C). To elucidate the relationship between hypoxic-ischemic neuronal death and NP1 induction, we next examine NP1 protein levels by Western blot analysis of total cellular extracts of cortical neurons under similar time period of exposure (Fig. 1D). Densitometric quantification of NP1-specific protein band with apparent molecular mass of ~ 47 kDa and normalization to actin (42 kDa) revealed a temporal pattern of increase in NP1 induction with >2.0-fold induction observed at ~ 4 h of exposure compared to the normoxic control (0 h) set at 100% (Fig. 1D). We found no difference in NP1 protein levels under normoxic conditions and 0 h hypoxia time. These results confirmed our detection of hypoxia time-dependent NP1 induction, and revealed that NP1 induction occurred before neuronal death was observed, which is consistent with a role for NP1 in the death cascade.
NP1 knockdown by NP1-siRNA prevents hypoxic-ischemic neuronal death
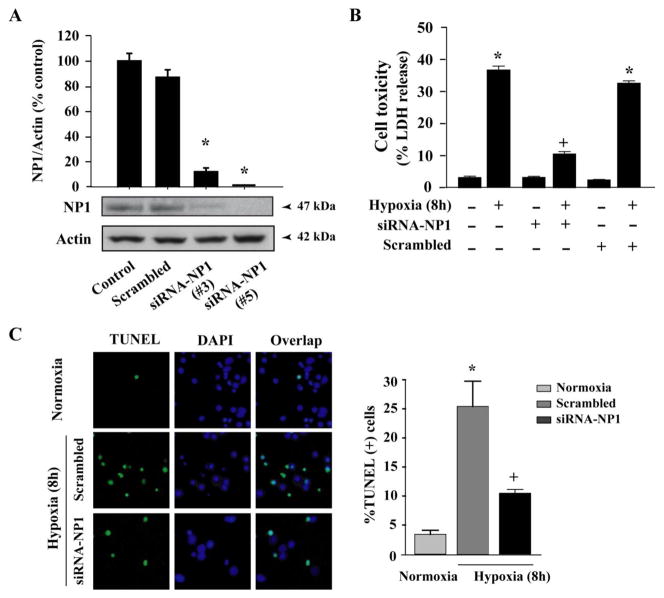
To elucidate if there is a direct link between NP1 induction and the neuronal death, we used NP1-siRNA gene silencing strategy to knockdown NP1 protein. First, we determined NP1 protein levels in cultured cortical neurons (at DIV 8) ~ 48 h after transfection with NP1-siRNA constructs (Fig. 2). We found that NP1-siRNA almost completely knockdown NP1 protein levels compared to normal controls and cells transfected with control scramble siRNA (SsiRNA) (Fig. 2A). The NP1-siRNA constructs (#3 and #5) effectively inhibited NP1 protein levels and were used in subsequent experiments. Next, we asked if the NP1 induction was directly associated with neuronal death then knocking down of NP1 might prevent hypoxic-ischemic neuronal death. Neuronal death was assessed independently by LDH release cytotoxicity and TUNEL assays. Hypoxic-ischemic exposure (8 h) caused >35% cell death (p<0.001 vs. normoxia controls) (Fig. 2B). Transfection of cells with NP1-specific siRNA, but not the control scrambled SsiRNA, resulted in significant neuroprotection (p<0.01) against cell death (Fig 2B). Quantification of TUNEL (+) cells showed significant reduction (~2.5-fold, p<0.01) in the number of TUNEL (+) cells in NP1-siRNA transfected neurons compared to that observed in control scramble siRNA transfected cortical neurons (Fig. 2C). These results show that direct inhibition of NP1 induction by NP1 siRNA rescued cortical neurons from hypoxic death.
Fig. 2.
Knockdown of NP1 by siRNA targeted against NP1 mRNA protected against hypoxic-ischemic neuronal death. A) Western immunoblot analysis of total cellular extracts using NP1 primary antibody (1:500) and densitometric quantification of NP1 bands revealed complete abolishment of NP1 protein levels in cells transfected with NP1-siRNA. Mean SEM (n=4; *p <0.01 vs. scrambled siRNA). Representative blots are shown. B) Magnitude of cell death after 8 h of exposure was assessed by LDH release cytotoxicity. NP1-siRNA significantly reduced cell toxicity compared to control scramble-transfected cells. Data represents mean ± SEM (n=8; *p <0.01, vs. normoxia control; +p <0.01 vs. respective hypoxia group. C) TUNEL-staining of cortical neurons transfected with either control scramble or NP1-siRNA and exposed to hypoxic- ischemic condition (8 h). Quantification of TUNEL (+) cells (green) over total cells (DAPI staining; blue) revealed 5-fold increased TUNEL (+) cell in scramble siRNA transfected cells, which was significantly reduced in cells transfected with NP1-siRNA. Representative TUNEL (+) cells are shown. Values represent mean ± SEM (n=5) relative to controls (*p<0.01 vs. normoxia control; +p<0.01 vs. scrambled siRNA group).
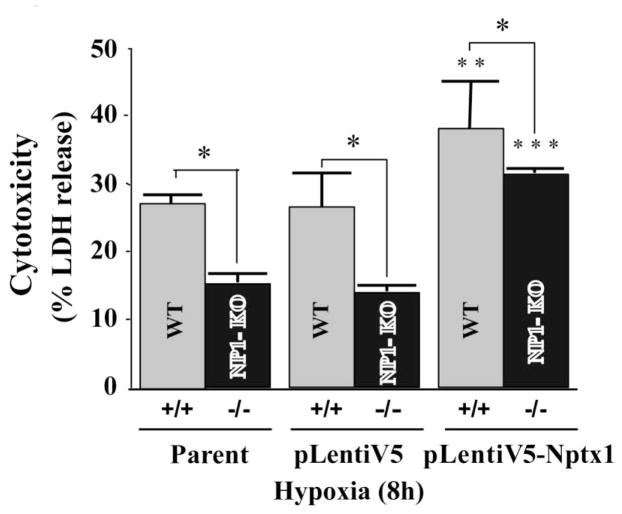
To further demonstrate the specificity of NP1 induction we used NP1 (−/−) null mouse primary cortical neurons. We found that NP1 (−/−) null primary cortical neurons showed significantly reduced LDH release cytotoxicity under identical conditions. Whereas, reintroduction of NP1 into WT and NP1 (−/−) null cells by infecting with NP1 expressing lentivirus (pLenti6v5-Nptx1) further enhanced the hypoxic-ischemic neuronal death (Fig. 3).
Fig. 3.
NP1 (−/−) null primary cortical neurons are significantly protected against hypoxic-ischemia induced neuronal death. Primary cortical neurons (WT and NP-KO cultures) were exposed to OGD at DIV 10 for 4–6 h. LDH cytotoxicity assay showed significantly less cell death in NP1 −/− cells vs. WT cells. Whereas, reintroduction of NP1 into NP1 −/− neurons further enhanced LDH release. Data are expressed as percentage of control cells (normoxia vs. OGD) mean ± SEM; n=8; *p<0.01 vs. WT. **p<0.001 and ***p<0.01 vs. parent WT and NP1-KO, respectively.
Akt deactivation increases GSK-3α/βkinase activity and induces NP1 expression
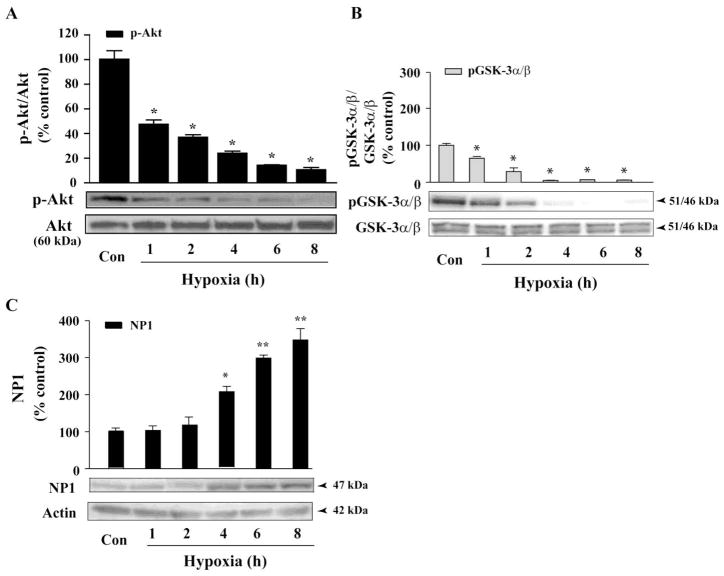
Activation of the PI3-K/Akt signaling pathway protects cells from pro-apoptotic stimuli [19, 24, 27]. Previously we found dephosphorylation of Akt (e.g. deactivation) in NMDA-elicited excitotoxicity as a causal mediator of cell death [40]. Here, we examined activation of Akt, which was monitored by phospho-Akt levels, in primary cortical cultures (DIV 8) exposed to hypoxic-ischemic conditions (Fig. 4). Western blot analysis of total cellular extracts revealed a decline in phospho-Akt levels that was evident at 1 h, with negligible levels of p-Akt was observed at 8 h of exposure (Fig. 4A). By contrast, total Akt protein levels did not change. Results show a temporal pattern of Akt dephosphorylation under the conditions we observed significant neuronal death, demonstrating a link between Akt deactivation and hypoxic-ischemic neuronal death as we previously observed with NMDA-elicited excitotoxicity [40].
Fig. 4.
GSK-3 α/β dephosphorylation (i.e. activation) occurred concurrent with Akt kinase deactivation following hypoxic-ischemic exposure and resulted induction of NP1 in neuronal death. A) Total protein extracts from hypoxic-ischemic and control cortical cultures were collected at indicated time points, resolved by SDS/PAGE and immunoblotted with phospho (Ser473)-specific Akt and total Akt antibodies. Deactivation of Akt is indicated by the decreased p-Akt/total Akt ratio. Data represent mean SEM (n=4–5; *p<0.001 vs. control Akt activity. Western blot analyses were performed using antibodies specific for phospho (Ser21/9)-specific GSK-3 α/β, total GSK-3/(B) and NP1 normalized to actin (C) as described in the “Experimental Procedures”. Results show decreased p-GSK-3 α/β/total GSK-3 α/β ratio (i.e. activation) followed by significant accumulation of NP1 protein levels at 4 h onset. Data represent mean ± SEM (n=5; +P<0.05, ++p,<0.001 vs. control NP1; *p<0.001 vs. control GSK-3 α/β. Controls are taken as 100%. Representative blots are shown.
The GSK-3α/β is a downstream substrate of activated Akt [25] which negatively regulates the GSK-3 function by phosphorylation of GSK-3α (at Ser21) and 3β (at Ser9) to inactivate GSK-3 [37, 41]. Next, we examined the levels of phospho-GSK-3α/β protein relative to total GSK-3α/β protein levels under identical experimental conditions (Fig. 4B). Western blot analysis showed that levels of p-GSK-3α/β significantly declined within 1–2 h of hypoxic-ischemic exposure with negligible p-GSK-3α/β levels observed at 4 h onset, suggesting activation of GSK-3 α/β under such conditions (Fig. 4B). In contrast, total GSK-3 α/β levels were unaffected.
Next, we examined if the decline in p-GSK-3 α/β levels (i.e. activation) altered NP1 induction by performing a similar time-course of hypoxic-ischemic exposure (0–8h) of cortical cultures. Quantification of NP1-specific protein band by Western blot analysis revealed significantly increased NP1 protein levels at 4h of exposure onset, which persisted till 8 h examined (Fig. 4C). Most importantly, we observed that the increase in NP1 induction occurred (4 h) following significant decline in phosphorylation of GSK-3 at Ser21 (α subunit) and Ser9 (β subunit) occurred between 1–2 h of exposure, which is consistent with a role for GSK-3 α/β in the regulation of NP1 induction.
Upregulation of GSK-3 and GSK-3 activity in hypoxic-ischemic neurons
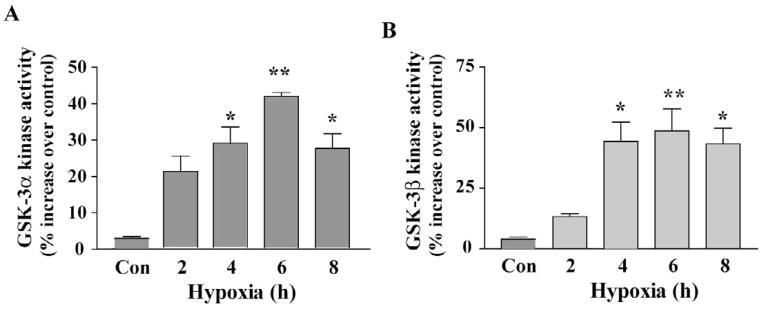
To directly demonstrate that decrease in phosphorylation of GSK-3 α/β (at Ser21 and Ser9) was indeed led to increase in its kinase activity, we assayed GSK-3α and GSK-3β kinase activity (Fig. 5) under identical conditions that exhibited dephosphorylation of GSK-3α/β (Fig. 3). Kinase activity assay showed significantly increased (P<0.01) kinase activity of both GSK-3α and GSK-3β at 2 h of exposure with ~ 40% increase in activity occurred at 6 h compared to that of respective control (Fig. 5A and B). Kinase activity, however, decreased significantly by 8 h of exposure. Results revealed that decrease in phosphorylation of GSK-3α and GSK-3β directly correlated with their increased kinase activities observed under hypoxic-ischemic condition.
Fig. 5.
Increase in GSK-3α and GSK-3β activities in hypoxic-ischemic cortical neurons. Total cellular extracts were prepared from control and hypoxic-ischemic cells and immunoprecipitated with GSK-3α - and GSK-3β-specific antibodies. GSK-3α - and GSK-3β activity was assayed separately as described under the Experimental procedures”. Results showed hypoxia time-dependent increase in kinase activity of both GSK- 3α and GSK-3β in cortical neurons. Data are mean ± SEM (n=4; *p<0.01, **p<0.001 vs. control normoxia group.
Akt deactivation is required for GSK-3-dependent NP1 induction in hypoxic-ischemic neuronal death
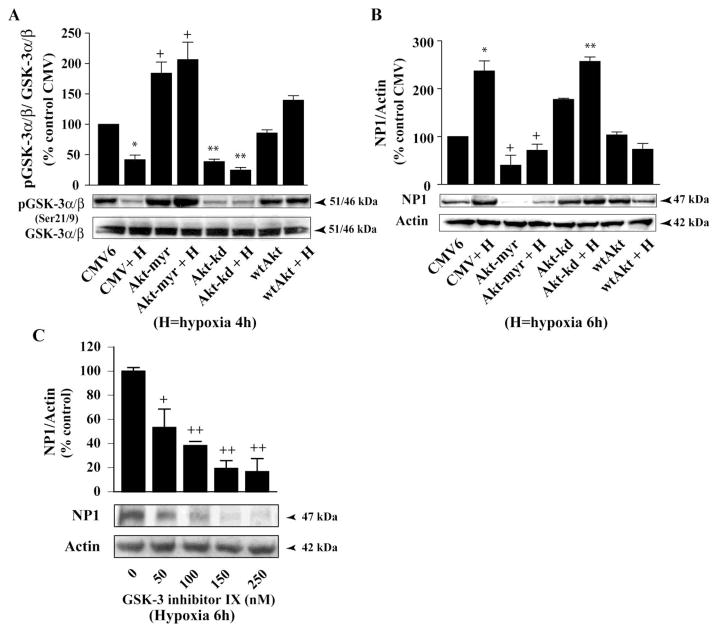
Next, we examined if there is any direct regulatory link among Akt dephosphorylation (i.e. deactivation) and the declines in phosphorylation of the downstream target GSK-3 α/β (i.e. activation) with NP1 induction by hypoxia (Fig. 6). Primary cortical neurons were nucleofected with either control CMV6 plasmid DNA (2 μg) or vectors encoding the wild type Akt (wtAkt), a kinase-inactive dominant-negative mutant form AktK179A (Akt-kd), or constitutively activated Akt (Akt-myr) as described and GSK-3 α/β phosphorylation was examined using phospho-specific GSK-3 α/β antibody. Quantification of p-GSK-3 α/β-specific protein bands over total GSK-3 α/β revealed significant decrease in phosphorylation at Ser21/9 sites of GSK-3 α/β (i.e. activation) in Akt dominant-negative inhibitor Akt-kd transfected cells compared to the control CMV6 transfected cells (Fig. 6A). In contrast, transfection with the Akt-myr and wtAkt further enhanced GSK-3 α/β phosphorylation at Ser21/9 (i.e. inhibition). Subsets of parallel cultures similarly transfected as above and were exposed to 6 h of hypoxia to determine NP1 induction (Fig. 6B). We found >2-fold increase (p<0.01) in NP1 expression in hypoxic-ischemic CMV6 transfected cells compared to control normoxia cells (Fig. 6B). Inhibition of Akt by Aktkd also resulted >2.5-fold (p<0.001) increase in NP1 expression. In contrast, overexpression of the constitutively active Akt-myr or the wild type wtAkt caused a marked decrease in NP1 expression as evidenced by densitometric quantification of NP1 bands (normalized to actin) (Fig. 6B). To further establish the involvement of GSK-3 in NP1 induction, we pretreated cells with the pharmacological inhibitor ‘GSK-3 inhibitor IX’ {Bio; 2′Z,3′E)-6-Bromoindirubin-3′-oxime}, a potent inhibitor of both GSK-3α and GSK-3β, 8–10 h. GSK-3 inhibitor IX pretreatment significantly blocked NP1 induction in a concentration-dependent manner (Fig. 6C). Our results show that deactivation of Akt function increased GSK-3 α/β activity that subsequently induced NP1 expression in hypoxic-ischemic neuronal death.
Fig. 6.
Inhibition of Akt kinase is required for GSK-3 α/β activation and subsequent NP1 induction. Primary cortical neuronal cultures were transfected with control CMV, Akt-myr, Akt-kd or wtAkt plasmid DNA (2 μg) as described in the “Experimental Procedures”. Total cellular extracts were prepared after hypoxia as indicated and analyzed by SDS/PAGE electrophoresis. Western immunoblotting was performed (A) with total and phospho (Ser21/9)-specific GSK- 3 α/β, and (B) with NP1 and actin antibodies. Densitometric quantification show increased accumulation of NP1 levels and decreased ratio p-GSK-3 α/β/total GSK-3 α/β following inhibition of Akt kinase by Akt-kd. Data represent mean ± SEM (n=4; *p<0.01 vs. control CMV; +p<0.01 vs. CMV + Hypoxia; and **p <0.001 vs. Akt-myr + Hypoxia group. Controls are taken as 100%. C) Cells were pretreated with varying concentrations (0–250nM) of GSK-3 inhibitor IX for 8–10 h. Total cellular extract were analyzed by Western blot analyses. Data represent mean ± SEM (n=4; +P<0.05, ++p<0.001 vs. control). Representative blots are shown.
Inhibition of GSK-3α and GSK-3β function blocked NP1 expression and neuronal death
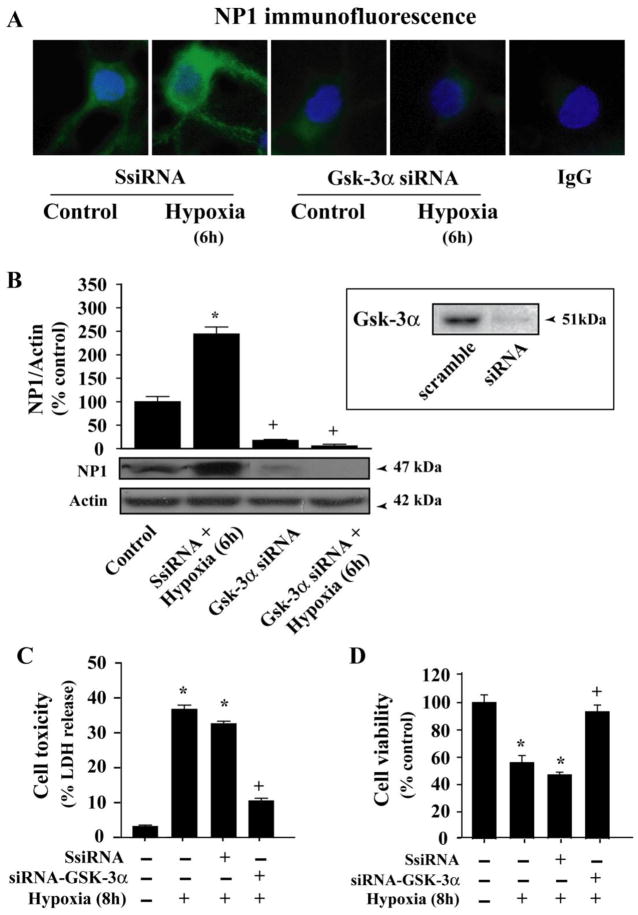
Above results suggest a mechanism in which NP1 induction in hypoxic-ischemic neuronal death is regulated by GSK-3α and GSK-3β activity under the control of upstream Akt signaling pathway. Selective inhibition of GSK-3 has been shown to protect primary neurons against apoptotic stimuli [42]. We asked whether GSK-3α and/or GSK-3β were contributing to NP1 induction. To delineate the specificity of GSK-3α and GSK-3β in NP1 induction, we applied a loss-of-function strategy to inhibit individual subunit by using GSK-3α specific siRNA (Fig. 7), or a dominant negative inhibitor of GSK-3β Frat1 (Fig. 8). Specificity of GSK-3α siRNA was examined by Western blot analyses of cellular extracts from respective group. Immunofluorescence analysis shows intense NP1-specific immunofluorescence in hypoxic-ischemic cortical neurons transfected with control scramble siRNA (Fig. 7A). Whereas, cells transfected with the GSK-3α-siRNA showed almost complete knockdown of NP1 proteins under both normoxia and hypoxia (6 h) as evident by decreased intensity of NP1-specific immunofluorescence (Fig. 7A). Western blot analysis and quantification of NP1-specific protein band (~47 kDa molecular mass and normalized to actin) confirmed significant inhibition of NP1 protein accumulation (Fig. 7B).
Fig. 7.
Knockdown of GSK-3α by GSK-3α-specific siRNA blocked NP1 expression. Primary cortical cultures at DIV 6 were transfected with either control scramble siRNA or GSK-3α-siRNA and exposed to hypoxic-ischemic condition as described under “Experimental procedures”. A) Immunofluorescence microscopy demonstrates almost complete inhibition of NP1expression in cells transfected with GSK-3α-siRNA that completely knockdown GSK-3α (not shown). IgG immunofluorescence (−ve control) show no evidence of NP1 protein. B) Western immunoblotting of total cellular proteins and densitometric quantification (normalized to actin) show significant abolishment of NP1 protein accumulation in GSK-3α-siRNA compared to that in control scramble siRNA transfected cells. Data are mean ± SEM (n=4; *p<0.01 vs. control; +p<0.01 vs. Scramble siRNA + Hypoxia) of control taken as 100%. Representative blots are shown. Neuronal death was assessed independently by complementary LDH release cytotoxicity (C) and MTT reduction cell viability assays (D). Inhibition of GSK-3α significantly reduced cell toxicity and increased cell viability (mean ± SEM, n=8; *p<0.01 vs. control normoxic cells, +p<0.01 vs. hypoxia + control scramble siRNA transfected group).
Fig. 8.
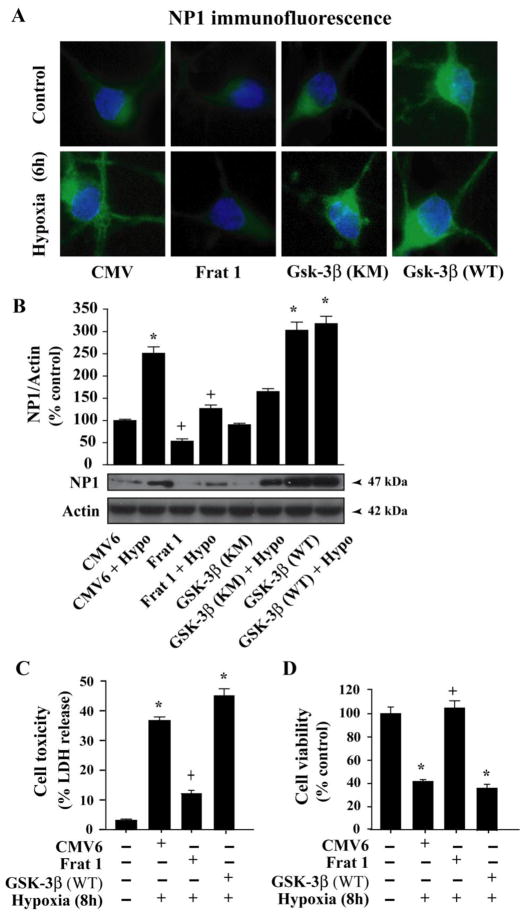
Inhibition of GSK-3β function inhibits induction of NP1 in hypoxic-ischemic cortical neurons. Cortical neurons were transfected with control CMV, dominant-negative inhibitor Frat 1,kinase mutant GSK-3β (GSK-3βKM) or WT-GSK-3β (GSK-3βWT) plasmid DNA (2 μg) as described under “Experimental procedures”. Fluorescence microscopy (A) and Western immunoblotting with NP1 antibody showed effective inhibition of GSK-3β by Frat1 that resulted significant decrease in NP1 accumulation. Whereas, overexpression of the GSK-3βWT significantly enhanced NP1 expression. Data represent mean ± SEM (n=4; *p<0.001 vs. control CMV6 and +p <0.001 vs. Frat1 + Hypoxia group. Representative blots are shown. Neuronal death was assessed by LDH release cytotoxicity (C) and MTT reduction cell viability assays (D). Inhibition of GSK-3β significantly reduced cell toxicity and increased cell viability (mean ± SEM, n=8; *p<0.01 vs. control normoxic cells, +p<0.01 vs. hypoxia + control CMV6 transfected group).
To further examine the specific involvement of GSK-3β relative to GSK-3α in NP1 induction, cells were transfected with Frat1, a protein that binds to GSK-3β and inhibits its kinase activity and serves as a dominant negative inhibitor [27, 43, 44]. Both immunofluorescence microscopy (Fig. 8A) and Western blot (Fig. 8B) analyses revealed significant inhibition of NP1 expression following hypoxic-ischemic exposure (6 h) compared to control normoxia (Fig. 8A and B). To test whether the inhibition of NP1 expression by Frat1 was dependent on GSK-3β kinase function, a subset of sister cultures were transfected with a kinase-deficient GSK-3β mutant (GSK-3 KM) or wild-type GSK-3β (WT) and exposed to hypoxia as indicated. Results showed that the kinase mutant GSK-3β KM partially blocked NP1 induction, whereas, overexpression of WT GSK-3β further enhanced NP1 expression (Fig. 8A and B). GSK-3β function, therefore, appears to be contributing to NP1 induction. Together these results clearly demonstrate specific requirements of both GSK-3α and GSK-3β signaling contributing to NP1 induction in hypoxic-ischemic neurons.
We next examined whether the GSK-3α/β-dependent NP1 induction could contribute to hypoxic-ischemic neuronal death. Neuronal death was assessed independently by complementary LDH release cytotoxicity and MTT reduction cell viability assays. Cultured cortical neurons were transfected with either control scramble siRNA, or GSK-3α-specific siRNA as above (Fig. 7C). Similarly, a subset of culture cells was also nucleofected with either control CMV6 vector DNA (2 μg) or Frat1, wildtype GSK-3β vector DNA (Fig 8C). Transfection with GSK-3α-siRNA that knocked down NP1 expression rescued cortical neurons from hypoxic-ischemic neuronal death as evidenced by decreased LDH release and enhanced cell viability compared to control scramble siRNA-transfected cells (Fig. 7C). Similar results were also observed in cells transfected with the GSK-3β inhibitor Frat1 (Fig. 8C). On the other hand, overexpression of WT GSK-3β resulted increased cell death under conditions we observed higher magnitude of NP1 expression (Fig. 8A and B). Collectively these results demonstrate a direct link between induction of NP1 expression and hypoxic-ischemic neuronal death that occurred via both GSK-3α-and GSK-3β-dependent-signaling mechanisms, and that inhibition of NP1 induction rescues cortical neurons from neuronal death.
Discussion
This study identifies the cellular signaling pathways involved in the regulation of a novel neuronal protein NP1 expression, which we found are induced in hypoxic-ischemic neuronal death [9]. The experiments presented here demonstrate that the GSK-3 α/β kinase signaling pathways, which is implicated in the apoptotic cell death mechanism, regulate NP1 induction. Our results provide direct evidence for both GSK-3α -and GSK-3β-specific activities as key regulators of NP1 induction participating in hypoxic-ischemic cell death program. Particularly interesting are those molecular manipulations to selectively silencing/inhibiting the GSK-3α and/or GSK-3β signaling significantly blocked NP1 induction, and thus, rescuing primary cortical neurons from hypoxic-ischemic cell death. Our findings provide a novel mechanism of regulating hypoxic-ischemic neuronal death in brain.
We observed a temporal pattern of NP1 induction in hypoxic-ischemic neuronal cells that preceded the time course of neuronal death observed in our experimental model. In demonstrating this we also found that NP1 gene silencing by NP1 target specific siRNA prevented this hypoxic-ischemic neuronal death, which is in agreement with our previous findings [9]. The link between NP1 induction and neuronal death was further validated in NP1−/− cortical neurons. Furthermore, comparing the time period of NP1 induction relative to cell death, it appears that NP1 induction occurred before the actual appearance of morphological signs and biochemical evidences for neuronal death. This is consistent with a role for NP1 in the injury mechanisms. It is now widely accepted that the cell fate of mature neurons depends on the balance between the survival and death signals. In this report, we applied loss/gain-of-function strategies to examine the specific involvement of GSK-3α and GSK-3β cellular signaling pathways known to be associated with the apoptotic death mechanism [18–20, 30]. In addition, we examined the upstream survival promoting regulatory kinases Akt that suppresses neuronal death and negatively regulates the GSK-3 α/β function. We asked if Akt signaling influences NP1 expression. Previously, we observed activation of the Akt kinase involved in the neurotrophin FGF-1-elicited neuroprotection against NMDA-mediated excitotoxicity [34]. On the other hand, we also found that dephosphorylation of Akt (e.g. deactivation) is a causal mediator of NMDA-elicited excitotoxicity [40], a process that contributes to cell loss in brain following HI, trauma, stroke, epilepsy and in many neurodegenerative diseases [45, 46]. Interestingly, the present results show that the deactivation of Akt kinase signaling under hypoxic-ischemic conditions significantly enhanced NP1 induction. Blockade of Akt kinase function by the dominant negative inhibitor Akt-kd showed similar increase in NP1 induction. On the other hand, overexpression of the wtAkt or the constitutively active Akt-myr in cortical neurons significantly blocked NP1 induction in hypoxic-ischemic neurons. Our interpretation of these results is that inhibition of the survival promoting pathways potentially shifts the cell fate balance towards the prodeath signaling mechanism of GSK-3, which in turn triggers NP1 induction and ultimately lead to the cell death.
To investigate the intracellular signaling mechanism(s) regulating the NP1 expression, we next examined the role of the prodeath signaling kinase GSK-3. GSK-3 has been implicated in apoptotic neuronal death induced by ischemia [18, 19] and glutamate-induced excitotoxicity [20, 21]. Although, several studies have emphasized the role of GSK-3β isoforms in the mechanism of apoptotic cell death [18–20, 30], the efficacy of GSK-3α in the neuronal cell death program triggered by hypoxia-ischemia is unclear. GSK-3 is a dual specificity kinase that can be both activated or inhibited through phosphorylation and dephosphorylation of its α and the β isoforms [25–29]. Enguita and co-workers (2005) have shown a role for GSK-3β in NP1 overexpression in cerebellar granule neurons undergoing apoptosis [30], but the relative role of the GSK-3α isoform of this prodeath signaling kinase in their findings was not described. We found that Akt deactivation occurred in cortical neurons following exposure to hypoxic-ischemic condition as evidenced by decreased levels of phospho-Akt. Our findings suggest that Akt, under basal conditions, exerts a restraining effect on cytotoxic process. Hypoxic-ischemic exposure of cortical neurons deactivated Akt, terminating its protective effect. Moreover, this Akt deactivation is in agreement with Akt deactivation we previously observed in multiple cell death models including NMDA excitotoxicity [40]. Since, GSK-3 is a downstream substrate for activated Akt, it is likely that deactivation of Akt leads to decrease in phosphorylation of GSK-3α and GSK-3β isoforms resulting in disinhibition of kinase activity of both GSK-3α and GSK-3β isoforms. The fact that this GSK-3 signaling pathway is activated in cortical neurons under our experimental conditions is further supported by our findings of increased kinase activity of both GSK-3α and GSK-3β isoforms with a time course that preceded that of NP1 induction. Activation of GSK-3 has been proposed to regulate transcription of many genes through directly phosphorylation or indirectly as a consequence of changes in GSK-3 activity, thus, shifting the cell fate towards the prodeath pathway [47–49]. This is evident from our findings that silencing GSK-3α and/or inhibiting GSK-3β signaling significantly inhibited NP1 induction, resulting significant decreases in cell death.
Conclusions
Together, our results demonstrate that hypoxic-ischemia, in vitro, in central neurons deactivated the survival promoting Akt signaling pathway with concurrent activation of a prodeath intracellular signaling mechanism underlying the dephosphorylation i.e. activation of both GSK-3α and GSK-3β signaling pathways leads to neuronal death through induction of a novel neuronal protein NP1 expression. Furthermore, this induction of NP1 precedes cell death and is directly regulated by both GSK-3α and GSK-3β kinase activities and, hence, the hypoxic-ischemic neuronal death. Our results present a novel mechanism of neuronal death following hypoxic-ischemic insult, which triggers NP1 induction through the regulation of the multifunctional GSK-3 α/β kinase, and suggest a preventive strategy against hypoxic-ischemic neuronal death in brain.
Acknowledgments
We gratefully acknowledge Dr. Paul Worley for providing NP1-KO mice. This work was supported by the National Institutes of Health grant RO1 NS046030 and The Cerebral Palsy International Research Foundation grant R-793-09.
Abbreviations used
- NP1
neuronal pentraxin 1
- GSK-3α/β
glycogen synthase kinase 3α/β
- Akt/PKB
protein kinase B
- PI3-K
phosphatidyl inositol-3 kinase
Footnotes
Publisher's Disclaimer: This is a PDF file of an unedited manuscript that has been accepted for publication. As a service to our customers we are providing this early version of the manuscript. The manuscript will undergo copyediting, typesetting, and review of the resulting proof before it is published in its final citable form. Please note that during the production process errors may be discovered which could affect the content, and all legal disclaimers that apply to the journal pertain.
References
- 1.Lorenz JM, Wooliever DE, Jetton JR, Paneth N. Arch Pediatr Adolesc Med. 1998;152(5):425–435. doi: 10.1001/archpedi.152.5.425. [DOI] [PubMed] [Google Scholar]
- 2.Northington FJ, Ferriero DM, Flock DL, Martin LJ. J Neurosci. 2001;21(6):1931–1938. doi: 10.1523/JNEUROSCI.21-06-01931.2001. [DOI] [PMC free article] [PubMed] [Google Scholar]
- 3.Northington FJ, Ferriero DM, Martin LJ. Dev Neurosci. 2001;23(3):186–191. doi: 10.1159/000046141. [DOI] [PubMed] [Google Scholar]
- 4.Johnston MV. Brain Dev. 1997;19(4):235–239. doi: 10.1016/s0387-7604(96)00561-x. [DOI] [PubMed] [Google Scholar]
- 5.Volpe JJ. Ment Retard Dev Disabil Res Rev. 2001;7(1):56–64. doi: 10.1002/1098-2779(200102)7:1<56::AID-MRDD1008>3.0.CO;2-A. [DOI] [PubMed] [Google Scholar]
- 6.D’Mello SR, Galli C, Ciotti T, Calissano P. Proc Natl Acad Sci U S A. 1993;90(23):10989–10993. doi: 10.1073/pnas.90.23.10989. [DOI] [PMC free article] [PubMed] [Google Scholar]
- 7.Watson A, Eilers A, Lallemand D, Kyriakis J, Rubin LL, Ham J. J Neurosci. 1998;18(2):751–762. doi: 10.1523/JNEUROSCI.18-02-00751.1998. [DOI] [PMC free article] [PubMed] [Google Scholar]
- 8.Dragunow M, Preston K. Brain Res Brain Res Rev. 1995;21(1):1–28. doi: 10.1016/0165-0173(95)00003-l. [DOI] [PubMed] [Google Scholar]
- 9.Hossain MA, Russell JC, O’Brien R, Laterra J. J Neurosci. 2004;24(17):4187–4196. doi: 10.1523/JNEUROSCI.0347-04.2004. [DOI] [PMC free article] [PubMed] [Google Scholar]
- 10.Schlimgen AK, Helms JA, Vogel H, Perin MS. Neuron. 1995;14(3):519–526. doi: 10.1016/0896-6273(95)90308-9. [DOI] [PubMed] [Google Scholar]
- 11.Hsu YC, Perin MS. Genomics. 1995;28(2):220–227. doi: 10.1006/geno.1995.1134. [DOI] [PubMed] [Google Scholar]
- 12.Dodds DC, Omeis IA, Cushman SJ, Helms JA, Perin MS. J Biol Chem. 1997;272(34):21488–21494. doi: 10.1074/jbc.272.34.21488. [DOI] [PubMed] [Google Scholar]
- 13.Tsui CC, Copeland NG, Gilbert DJ, Jenkins NA, Barnes C, Worley PF. J Neurosci. 1996;16(8):2463–2478. doi: 10.1523/JNEUROSCI.16-08-02463.1996. [DOI] [PMC free article] [PubMed] [Google Scholar]
- 14.Goodman AR, Cardozo T, Abagyan R, Altmeyer A, Wisniewski HG, Vilcek J. Cytokine Growth Factor Rev. 1996;7(2):191–202. doi: 10.1016/1359-6101(96)00019-6. [DOI] [PubMed] [Google Scholar]
- 15.O’Brien R, Xu D, Mi R, Tang X, Hopf C, Worley P. J Neurosci. 2002;22(11):4487–4498. doi: 10.1523/JNEUROSCI.22-11-04487.2002. [DOI] [PMC free article] [PubMed] [Google Scholar]
- 16.Kirkpatrick LL, Matzuk MM, Dodds DC, Perin MS. J Biol Chem. 2000;275(23):17786–17792. doi: 10.1074/jbc.M002254200. [DOI] [PubMed] [Google Scholar]
- 17.Bjartmar L, Huberman AD, Ullian EM, Renteria RC, Liu X, Xu W, Prezioso J, Susman MW, Stellwagen D, Stokes CC, Cho R, Worley P, Malenka RC, Ball S, Peachey NS, Copenhagen D, Chapman B, Nakamoto M, Barres BA, Perin MS. J Neurosci. 2006;26(23):6269–6281. doi: 10.1523/JNEUROSCI.4212-05.2006. [DOI] [PMC free article] [PubMed] [Google Scholar]
- 18.Nonaka S, Chuang DM. Neuroreport. 1998;9(9):2081–2084. doi: 10.1097/00001756-199806220-00031. [DOI] [PubMed] [Google Scholar]
- 19.Bhat RV, Shanley J, Correll MP, Fieles WE, Keith RA, Scott CW, Lee CM. Proc Natl Acad Sci U S A. 2000;97(20):11074–11079. doi: 10.1073/pnas.190297597. [DOI] [PMC free article] [PubMed] [Google Scholar]
- 20.Elyaman W, Terro F, Wong NS, Hugon J. Eur J Neurosci. 2002;15(4):651–660. doi: 10.1046/j.1460-9568.2002.01899.x. [DOI] [PubMed] [Google Scholar]
- 21.Nonaka S, Hough CJ, Chuang DM. Proc Natl Acad Sci U S A. 1998;95(5):2642–2647. doi: 10.1073/pnas.95.5.2642. [DOI] [PMC free article] [PubMed] [Google Scholar]
- 22.Welsh GI, Wilson C, Proud CG. Trends Cell Biol. 1996;6:274–279. doi: 10.1016/0962-8924(96)10023-4. [DOI] [PubMed] [Google Scholar]
- 23.Wang QM, Fiol CJ, DePaoli-Roach AA, Roach PJ. J Biol Chem. 1994;269(20):14566–14574. [PubMed] [Google Scholar]
- 24.Bijur GN, De Sarno P, Jope RS. J Biol Chem. 2000;275(11):7583–7590. doi: 10.1074/jbc.275.11.7583. [DOI] [PubMed] [Google Scholar]
- 25.Cross DA, Alessi DR, Cohen P, Andjelkovich M, Hemmings BA. Nature. 1995;378(6559):785–789. doi: 10.1038/378785a0. [DOI] [PubMed] [Google Scholar]
- 26.Hetman M, Cavanaugh JE, Kimelman D, Xia Z. J Neurosci. 2000;20(7):2567–2574. doi: 10.1523/JNEUROSCI.20-07-02567.2000. [DOI] [PMC free article] [PubMed] [Google Scholar]
- 27.Crowder RJ, Freeman RS. J Biol Chem. 2000;275(44):34266–34271. doi: 10.1074/jbc.M006160200. [DOI] [PubMed] [Google Scholar]
- 28.Li M, Wang X, Meintzer MK, Laessig T, Birnbaum MJ, Heidenreich KA. Mol Cell Biol. 2000;20(24):9356–9363. doi: 10.1128/mcb.20.24.9356-9363.2000. [DOI] [PMC free article] [PubMed] [Google Scholar]
- 29.Fang X, Yu SX, Lu Y, Bast RC, Jr, Woodgett JR, Mills GB. Proc Natl Acad Sci U S A. 2000;97(22):11960–11965. doi: 10.1073/pnas.220413597. [DOI] [PMC free article] [PubMed] [Google Scholar]
- 30.Enguita M, DeGregorio-Rocasolano N, Abad A, Trullas R. Mol Pharmacol. 2005;67(4):1237–1246. doi: 10.1124/mol.104.007062. [DOI] [PubMed] [Google Scholar]
- 31.Liang MH, Chuang DM. J Biol Chem. 2006;281(41):30479–30484. doi: 10.1074/jbc.M607468200. [DOI] [PubMed] [Google Scholar]
- 32.Russell JC, Whiting H, Szuflita N, Hossain MA. J Neurochem. 2008 doi: 10.1111/j.1471-4159.2008.05482.x. [DOI] [PubMed] [Google Scholar]
- 33.Russell JC, Blue ME, Johnston MV, Naidu S, Hossain MA. Neuroscience. 2007;150(3):563–574. doi: 10.1016/j.neuroscience.2007.09.076. [DOI] [PMC free article] [PubMed] [Google Scholar]
- 34.Hossain MA, Bailone JC, Gomez R, Laterra J. J Neurochem. 2002;81(2):365–378. doi: 10.1046/j.1471-4159.2002.00837.x. [DOI] [PubMed] [Google Scholar]
- 35.Hossain MA, Russell JC, Miknyoczki S, Ruggeri B, Lal B, Laterra J. Ann Neurol. 2004;55(5):660–667. doi: 10.1002/ana.20065. [DOI] [PubMed] [Google Scholar]
- 36.Wang H, Yu SW, Koh DW, Lew J, Coombs C, Bowers W, Federoff HJ, Poirier GG, Dawson TM, Dawson VL. J Neurosci. 2004;24(48):10963–10973. doi: 10.1523/JNEUROSCI.3461-04.2004. [DOI] [PMC free article] [PubMed] [Google Scholar]
- 37.Dudek H, Datta SR, Franke TF, Birnbaum MJ, Yao R, Cooper GM, Segal RA, Kaplan DR, Greenberg ME. Science. 1997;275(5300):661–665. doi: 10.1126/science.275.5300.661. [DOI] [PubMed] [Google Scholar]
- 38.Janas J, Skowronski J, Van Aelst L. Methods Enzymol. 2006;406:593–605. doi: 10.1016/S0076-6879(06)06046-0. [DOI] [PubMed] [Google Scholar]
- 39.Laemmli UK. Nature. 1970;227(259):680–685. doi: 10.1038/227680a0. [DOI] [PubMed] [Google Scholar]
- 40.Luo HR, Hattori H, Hossain MA, Hester L, Huang Y, Lee-Kwon W, Donowitz M, Nagata E, Snyder SH. Proc Natl Acad Sci U S A. 2003;100(20):11712–11717. doi: 10.1073/pnas.1634990100. [DOI] [PMC free article] [PubMed] [Google Scholar]
- 41.Franke TF, Kaplan DR, Cantley LC, Toker A. Science. 1997;275(5300):665–668. doi: 10.1126/science.275.5300.665. [DOI] [PubMed] [Google Scholar]
- 42.Cross DA, Culbert AA, Chalmers KA, Facci L, Skaper SD, Reith AD. J Neurochem. 2001;77(1):94–102. doi: 10.1046/j.1471-4159.2001.t01-1-00251.x. [DOI] [PubMed] [Google Scholar]
- 43.Jonkers J, Korswagen HC, Acton D, Breuer M, Berns A. EMBO J. 1997;16(3):441–450. doi: 10.1093/emboj/16.3.441. [DOI] [PMC free article] [PubMed] [Google Scholar]
- 44.Li L, Yuan H, Weaver CD, Mao J, Farr GH, 3rd, Sussman DJ, Jonkers J, Kimelman D, Wu D. Embo J. 1999;18(15):4233–4240. doi: 10.1093/emboj/18.15.4233. [DOI] [PMC free article] [PubMed] [Google Scholar]
- 45.Choi DW, Rothman SW. Ann Rev Neurosci. 1990;13:171–182. doi: 10.1146/annurev.ne.13.030190.001131. [DOI] [PubMed] [Google Scholar]
- 46.Olney JW. Biol Psychiatry. 1989;26:505–525. doi: 10.1016/0006-3223(89)90072-3. [DOI] [PubMed] [Google Scholar]
- 47.Wang QM, Park IK, Fiol CJ, Roach PJ, DePaoli-Roach AA. Biochemistry. 1994;33(1):143–147. doi: 10.1021/bi00167a018. [DOI] [PubMed] [Google Scholar]
- 48.Hoeflich KP, Luo J, Rubie EA, Tsao MS, Jin O, Woodgett JR. Nature. 2000;406(6791):86–90. doi: 10.1038/35017574. [DOI] [PubMed] [Google Scholar]
- 49.Phiel CJ, Wilson CA, Lee VM, Klein PS. Nature. 2003;423(6938):435–439. doi: 10.1038/nature01640. [DOI] [PubMed] [Google Scholar]


